
- To manage global carbon budgets, we’re becoming increasingly reliant on the concept of future ‘negative emissions’. Future generations will be forced to attempt to draw down the excessive greenhouse gas emissions that we continue to generate today (while they struggle to cope with disruptive climate change).
- Some of the proposed methods to deliver ‘negative emissions’ (or ‘carbon dioxide reduction’) would be ecologically-destructive at scale (eg. BECCS – bioenergy with carbon capture and storage13). ‘Natural climate solutions’ offer the hope of delivering climate change mitigation while preserving the ecosystems that we depend on for our security and wellbeing. While natural climate solutions are important, they wouldn’t provide sufficient emissions mitigation by themselves to stay within global carbon budgets (we’d also need to reduce the emissions caused by fossil-fuel use).
Photo by Artem Sapegin on Unsplash
(This is an early draft of an incomplete article. The figures and tables might be used later)Table of Contents
Carbon budgets
Converting between GtCO2 and GtC:
Atomic masses: C = 12, O = 16, CO2 = 12 + (2 x 16) = 44 ; 1 GtCO2 corresponds to 12 / 44 GtC ≈ 0.2727 GtC ; 1 GtC corresponds to 44 / 12 GtCO2 ≈ 3.667 GtCO2 ; And a petagram equals a gigatonne: 1 PgCO2 = 1 GtCO2 (1 petagram = 1015 grams = 109 tonnes. Where ‘t’ stands for ‘tonne’ which is a metric ton (= 1,000 kg))Global anthropogenic disturbances to the carbon cycle (GtC/year averaged over 2008-2017)

Source: Le Quéré et al (2018)1, Fig. 2
Combined components of the global carbon budget

Source: Le Quéré et al (2018)1, Fig. 3
Global emissions projections to 2100 and Paris 2015 target
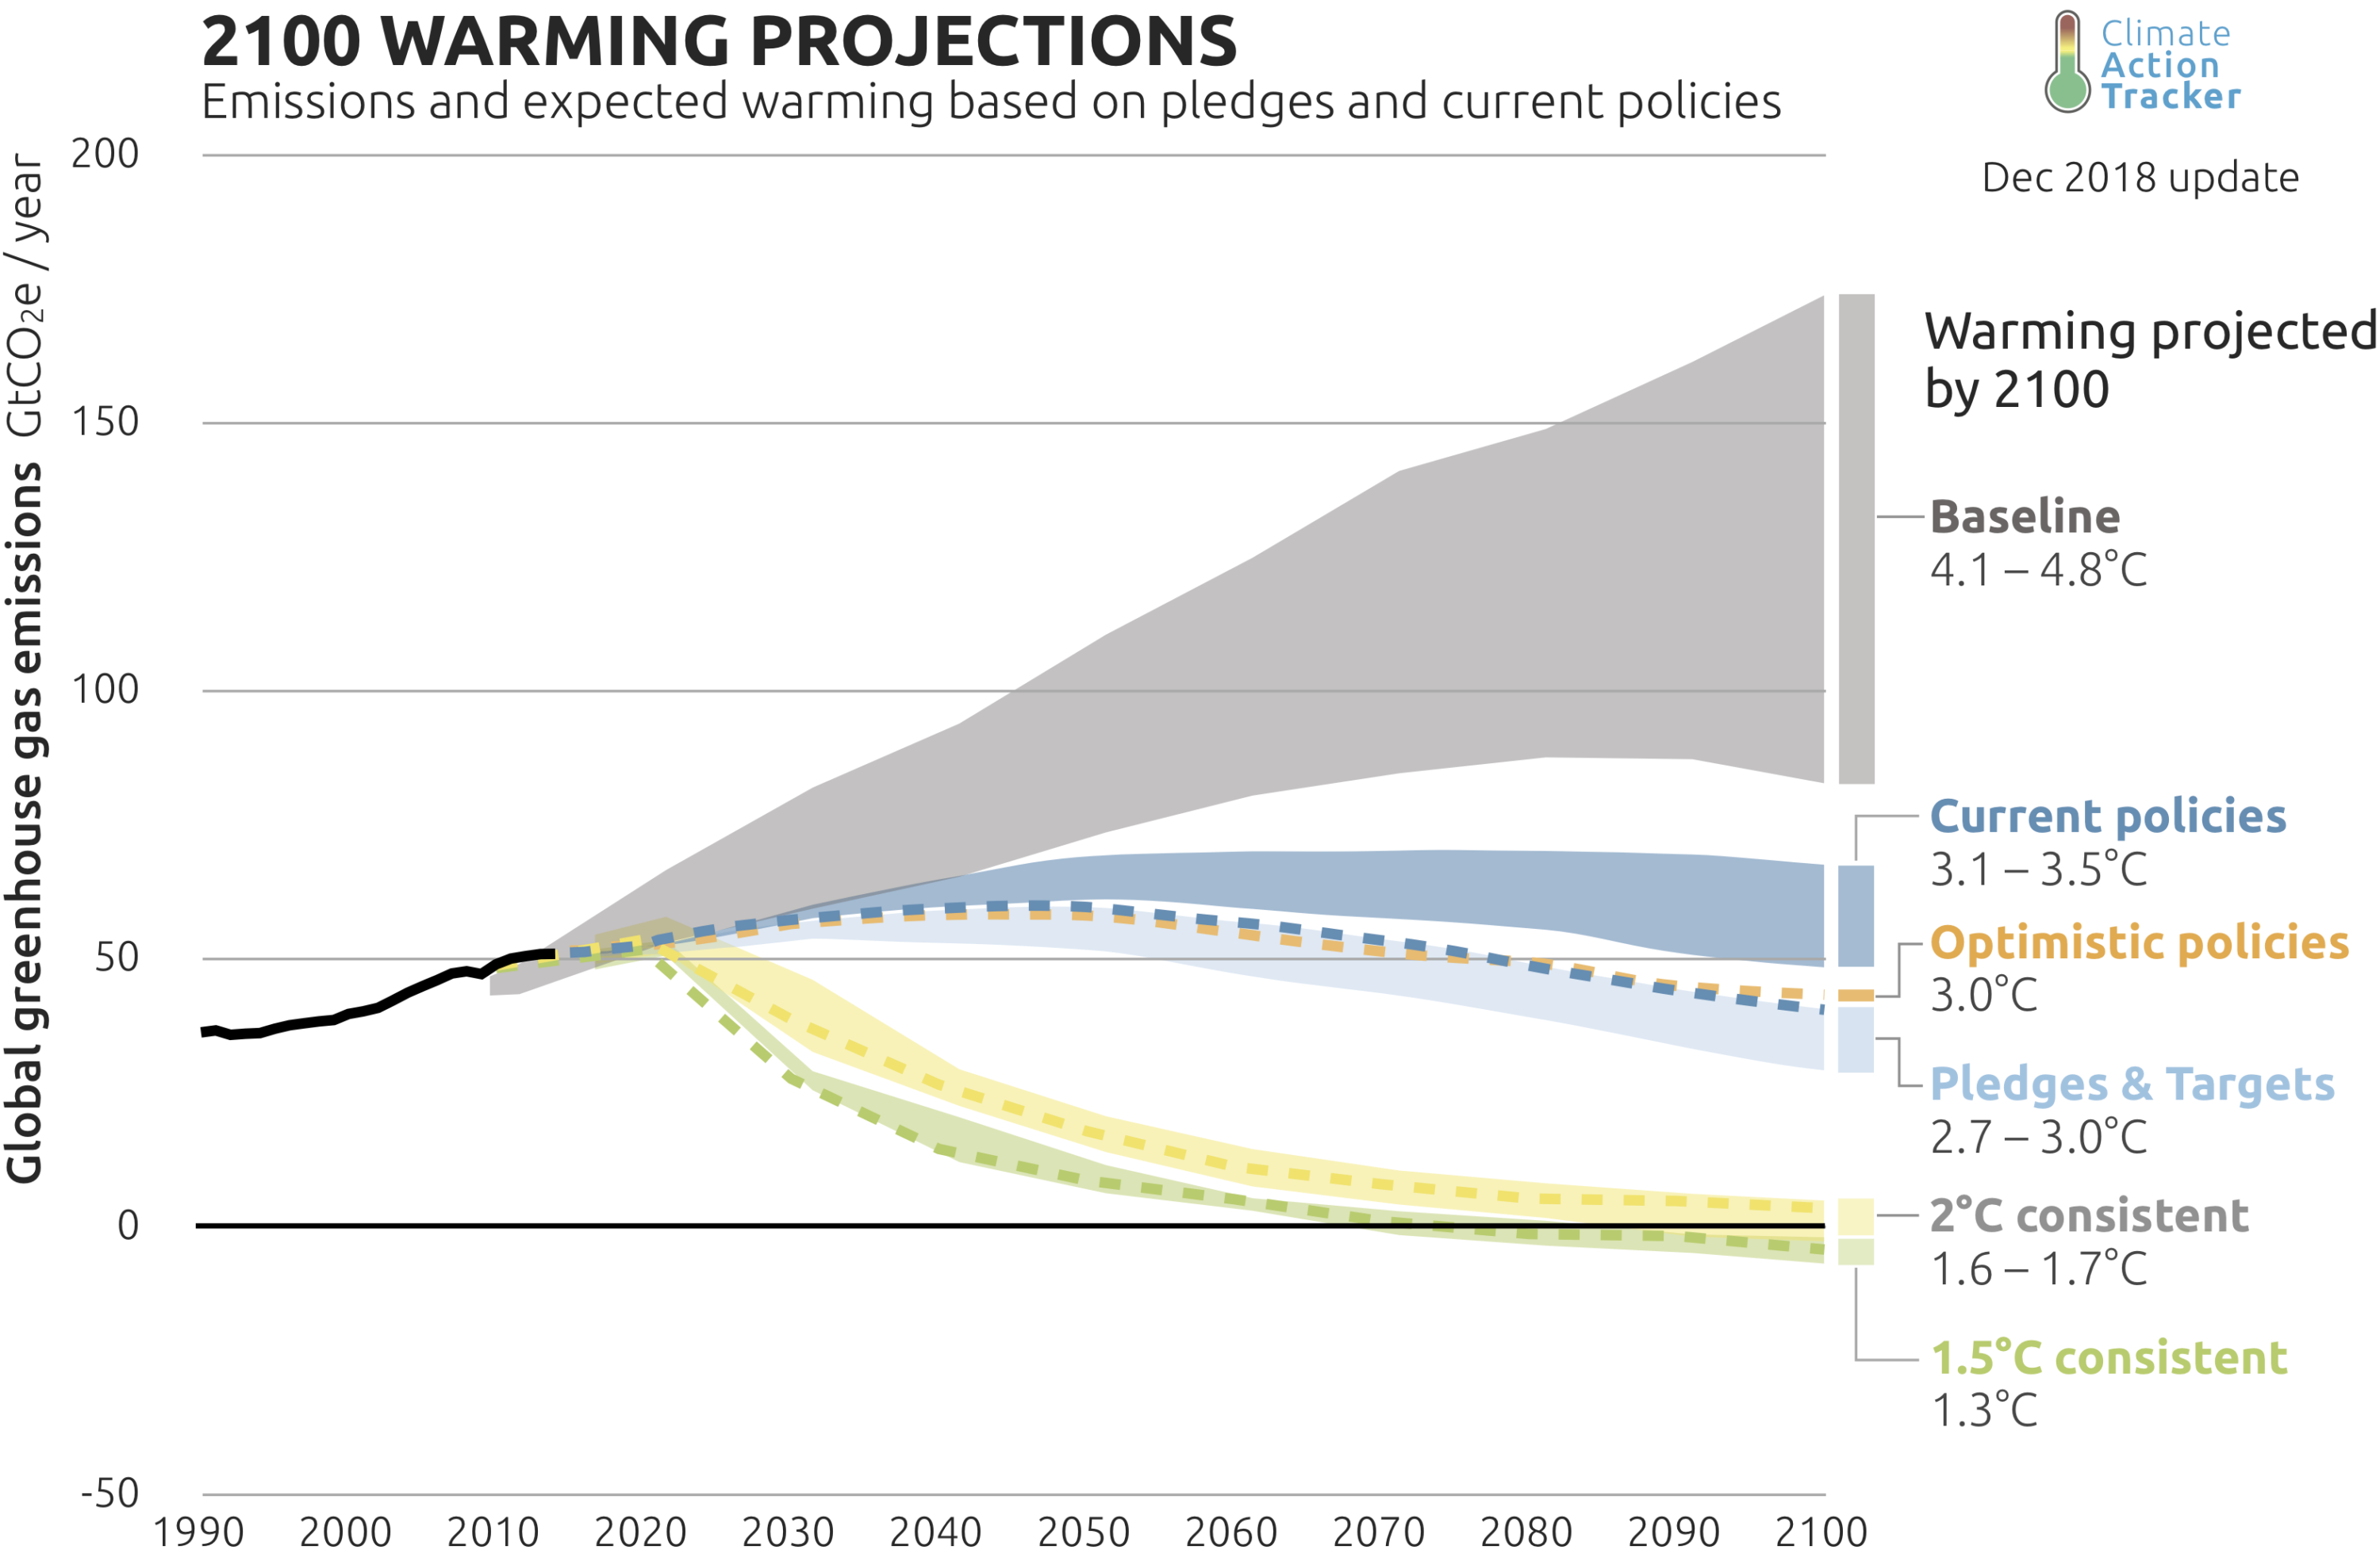
Source: https://climateactiontracker.org/global/temperatures/2
Global emissions projections to 2030 and emissions gaps to Paris target
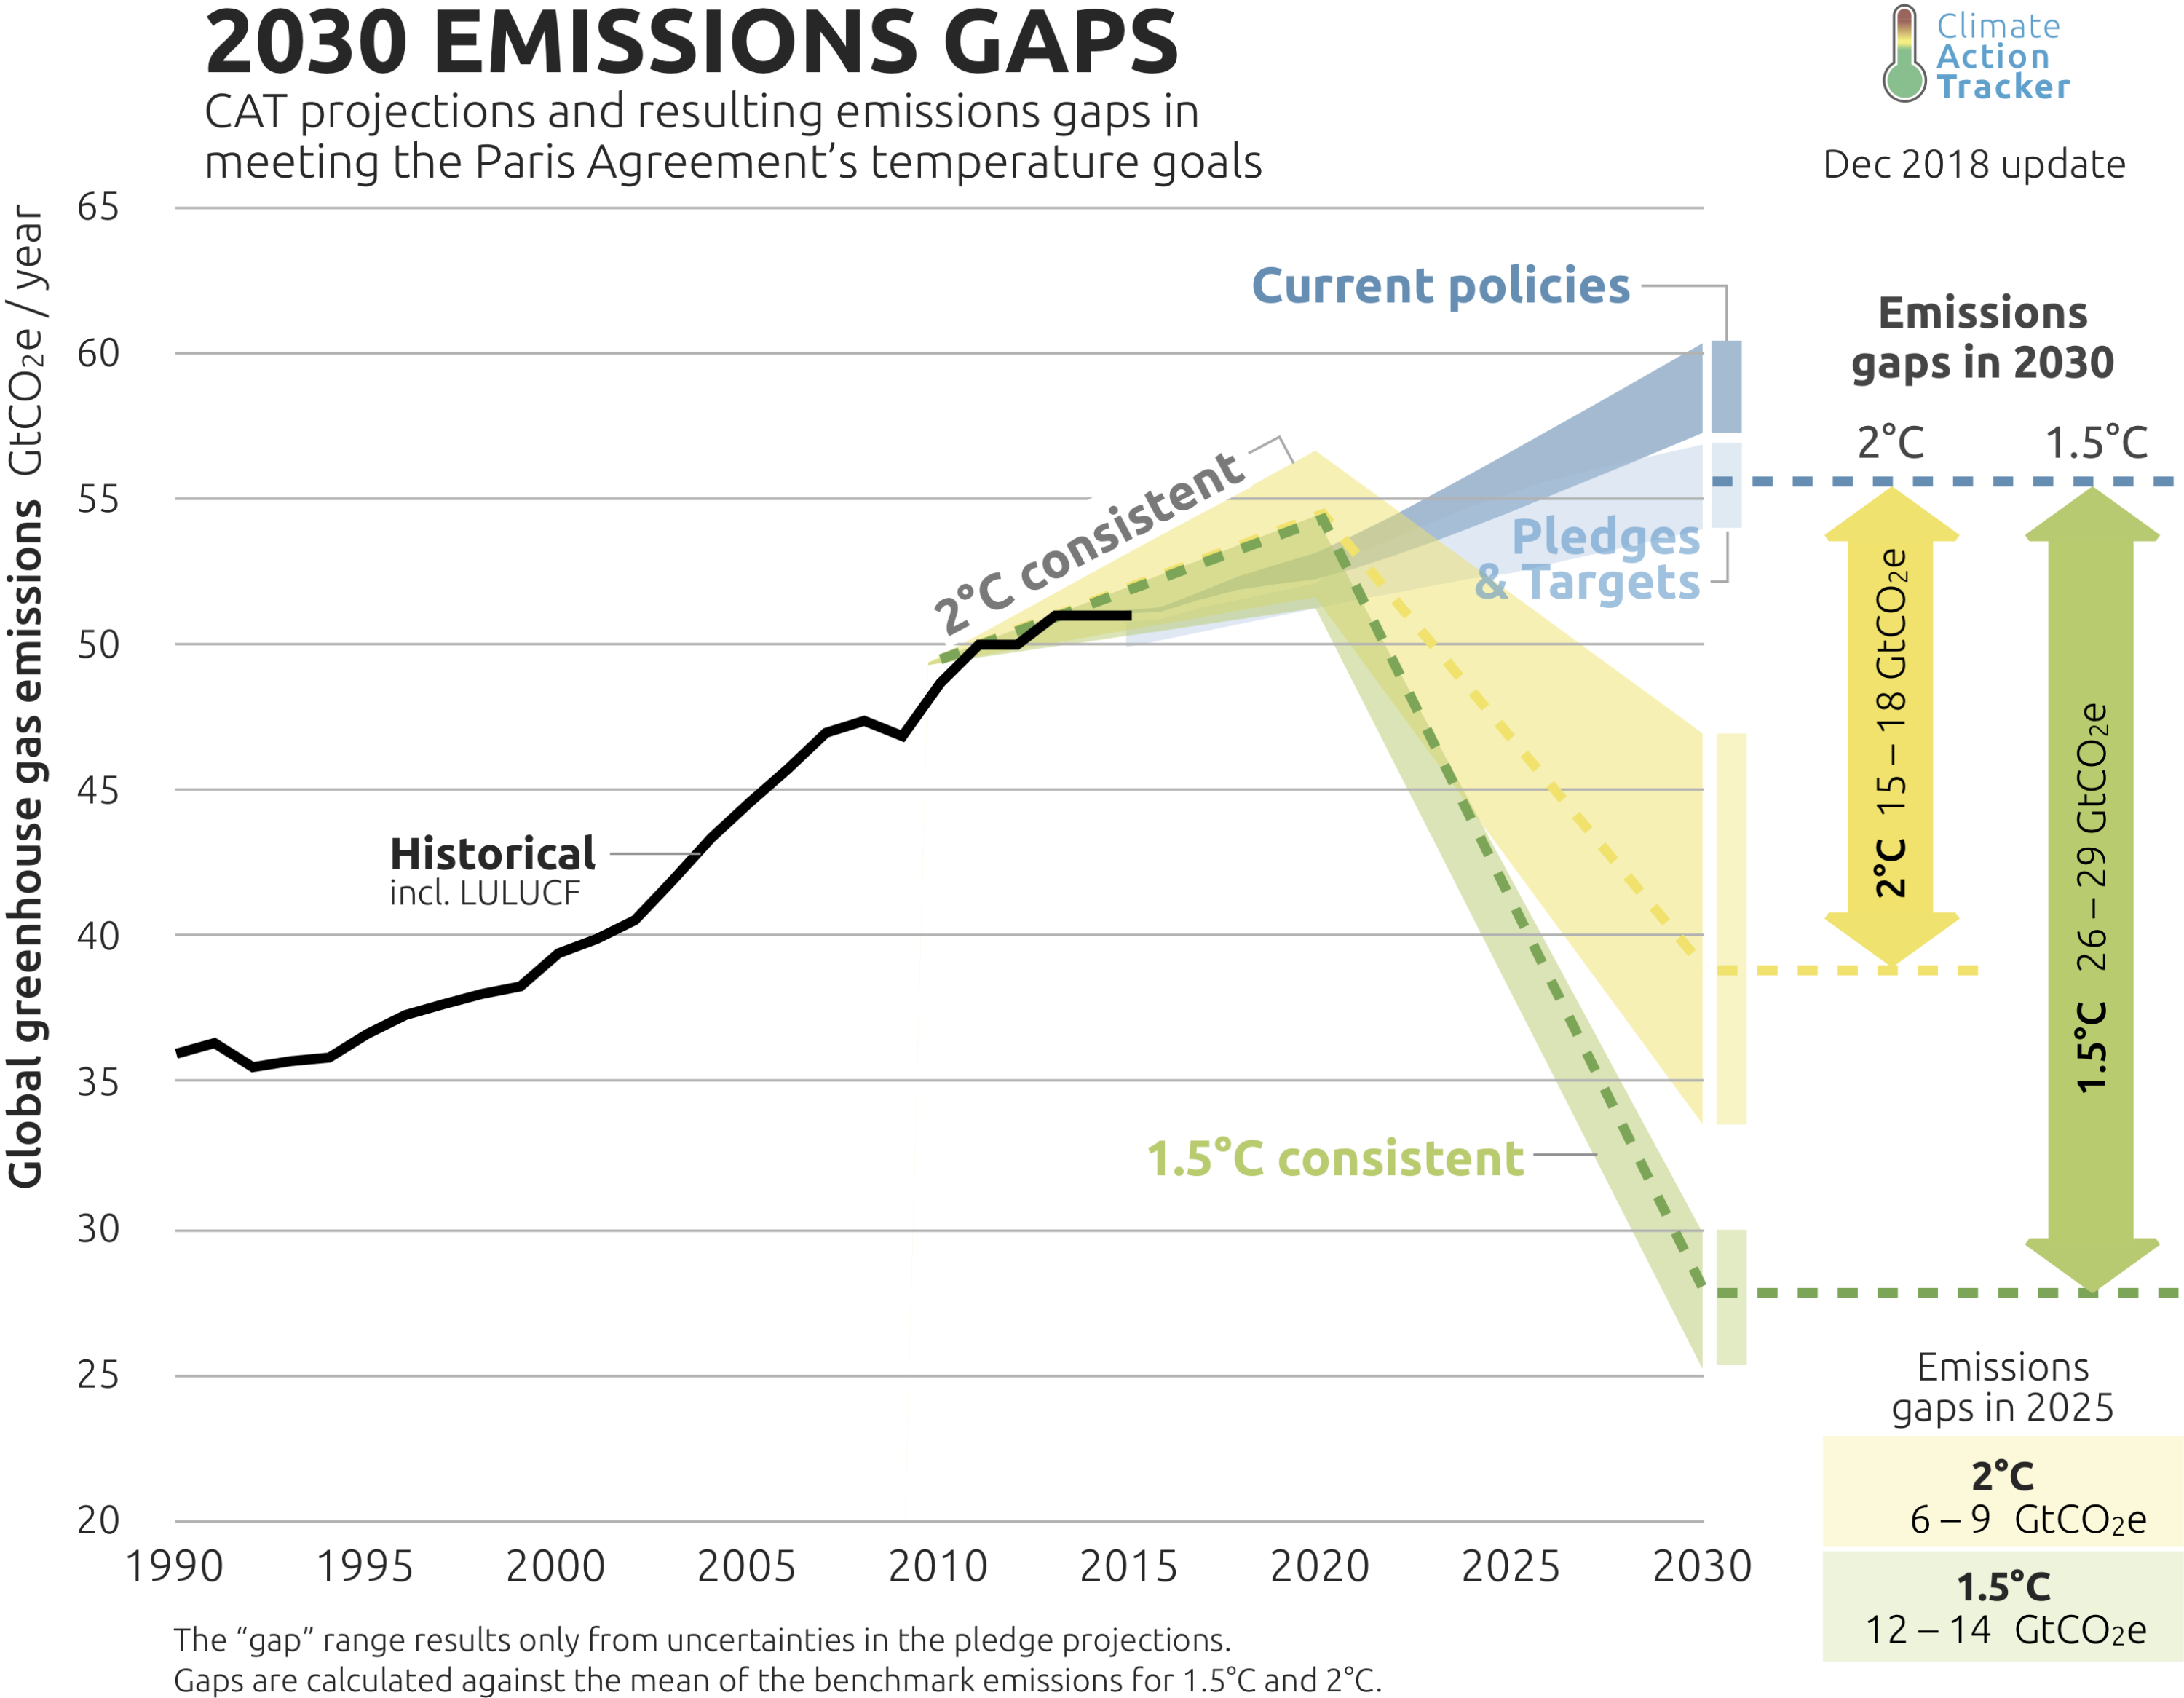
Source: https://climateactiontracker.org/global/cat-emissions-gaps/3
Relationship between temperature rise and CO2 budgets
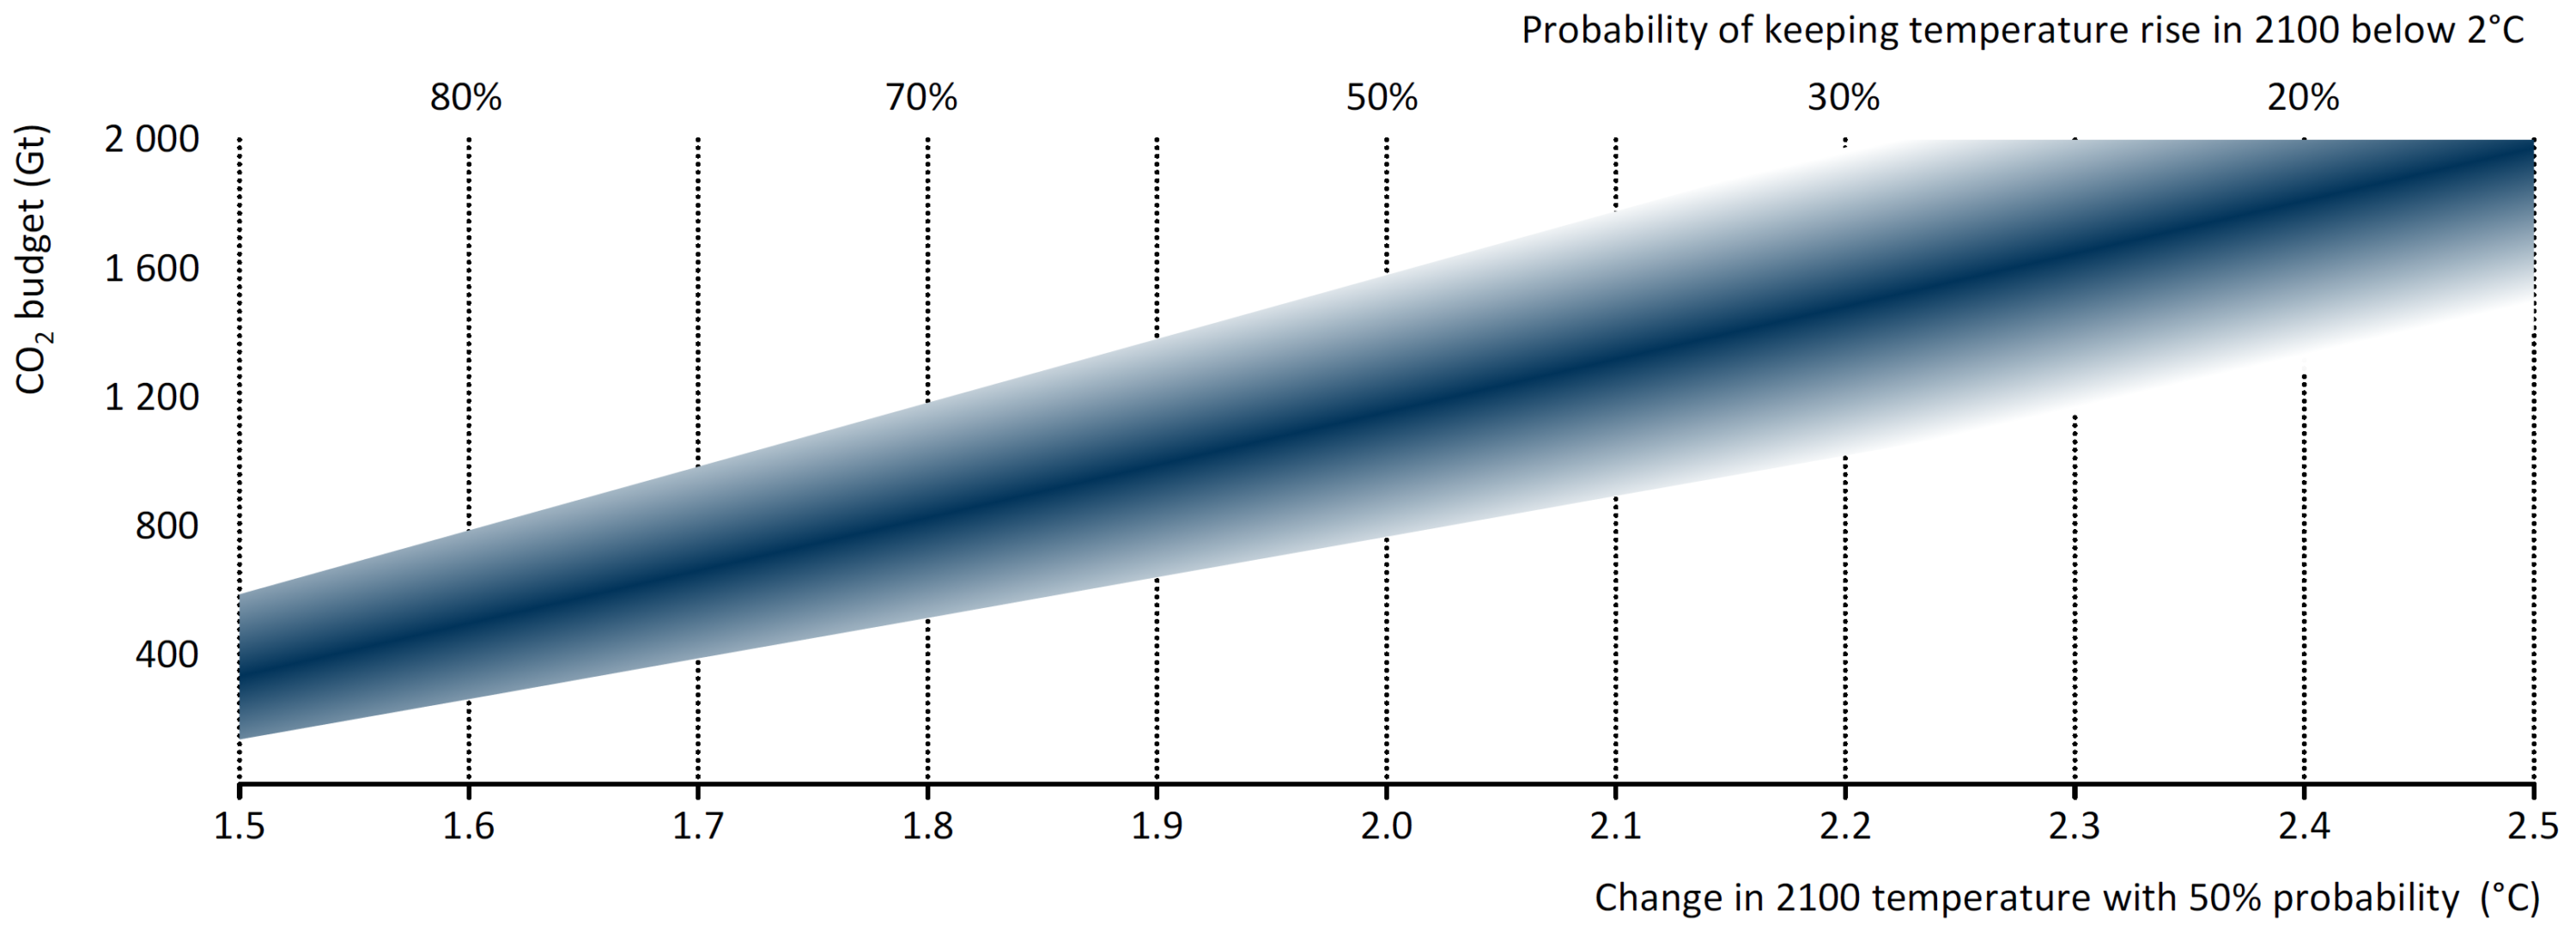
Source: IEA (2017)4 Fig. 1.22
Cumulative global carbon budget (GtCO2) and remaining emission quotas (rel. to 1850-1900)
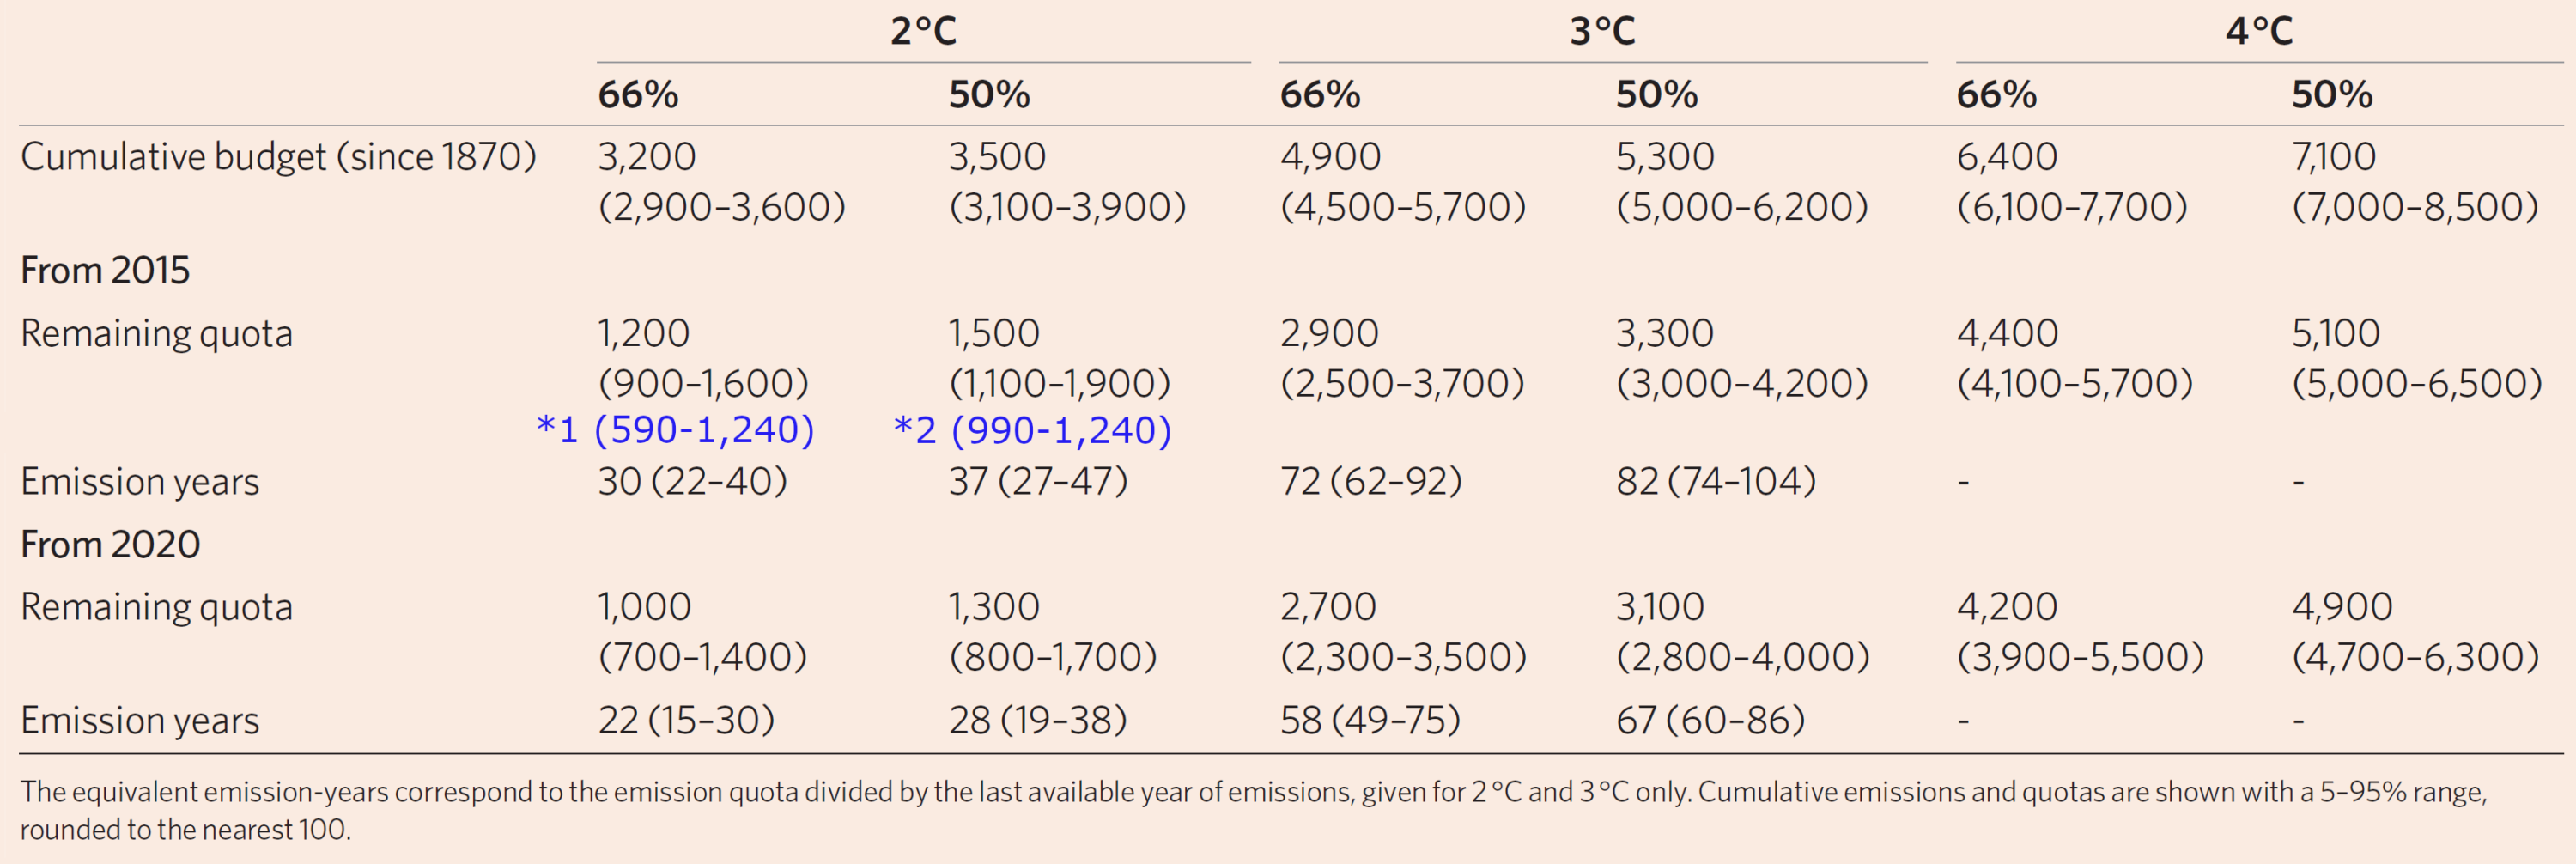
Sources: Friedlingstein et al (2014)5 Table 1, Rogelj et al (2016)6 Table 2
*1 To limit warming to below 2°C with 66–100% probability, accounting for non-CO2 forcing, IPCC AR5, (10–90% range), year 2015. *2 To limit warming to below 2°C with 50–66% probability, accounting for non-CO2 forcing, IPCC AR5, (10–90% range), year 2015.Rogelj et al (2016)6
Before the industrial revolution, roughly 3,000-3,500 GtCO2 (or 820-950 GtC) was available in total for a 50% chance of a 2°C temp. rise above the pre-industrial temp. About 2,050 GtCO2 (or 560 GtC) was emitted globally up to 2015.Rogelj et al (2016)6
This leaves a little over 1,000 GtCO2 (or 273 GtC) global budget for 2015-2100, for a 50% chance of a 2°C temperature rise. The table below shows the latest IPCC estimate for the remaining carbon budget for a 1.5°C temperature rise above the pre-industrial level.The remaining carbon budget for 1.5°C and its uncertainties

Source: IPCC (2018) SR157, Table 2.2
Guest post: A new approach for understanding the remaining carbon budget, Rogelj & Forster for CarbonBrief, 17 July 2019Global mitigation curves (with no net-negative emissions)
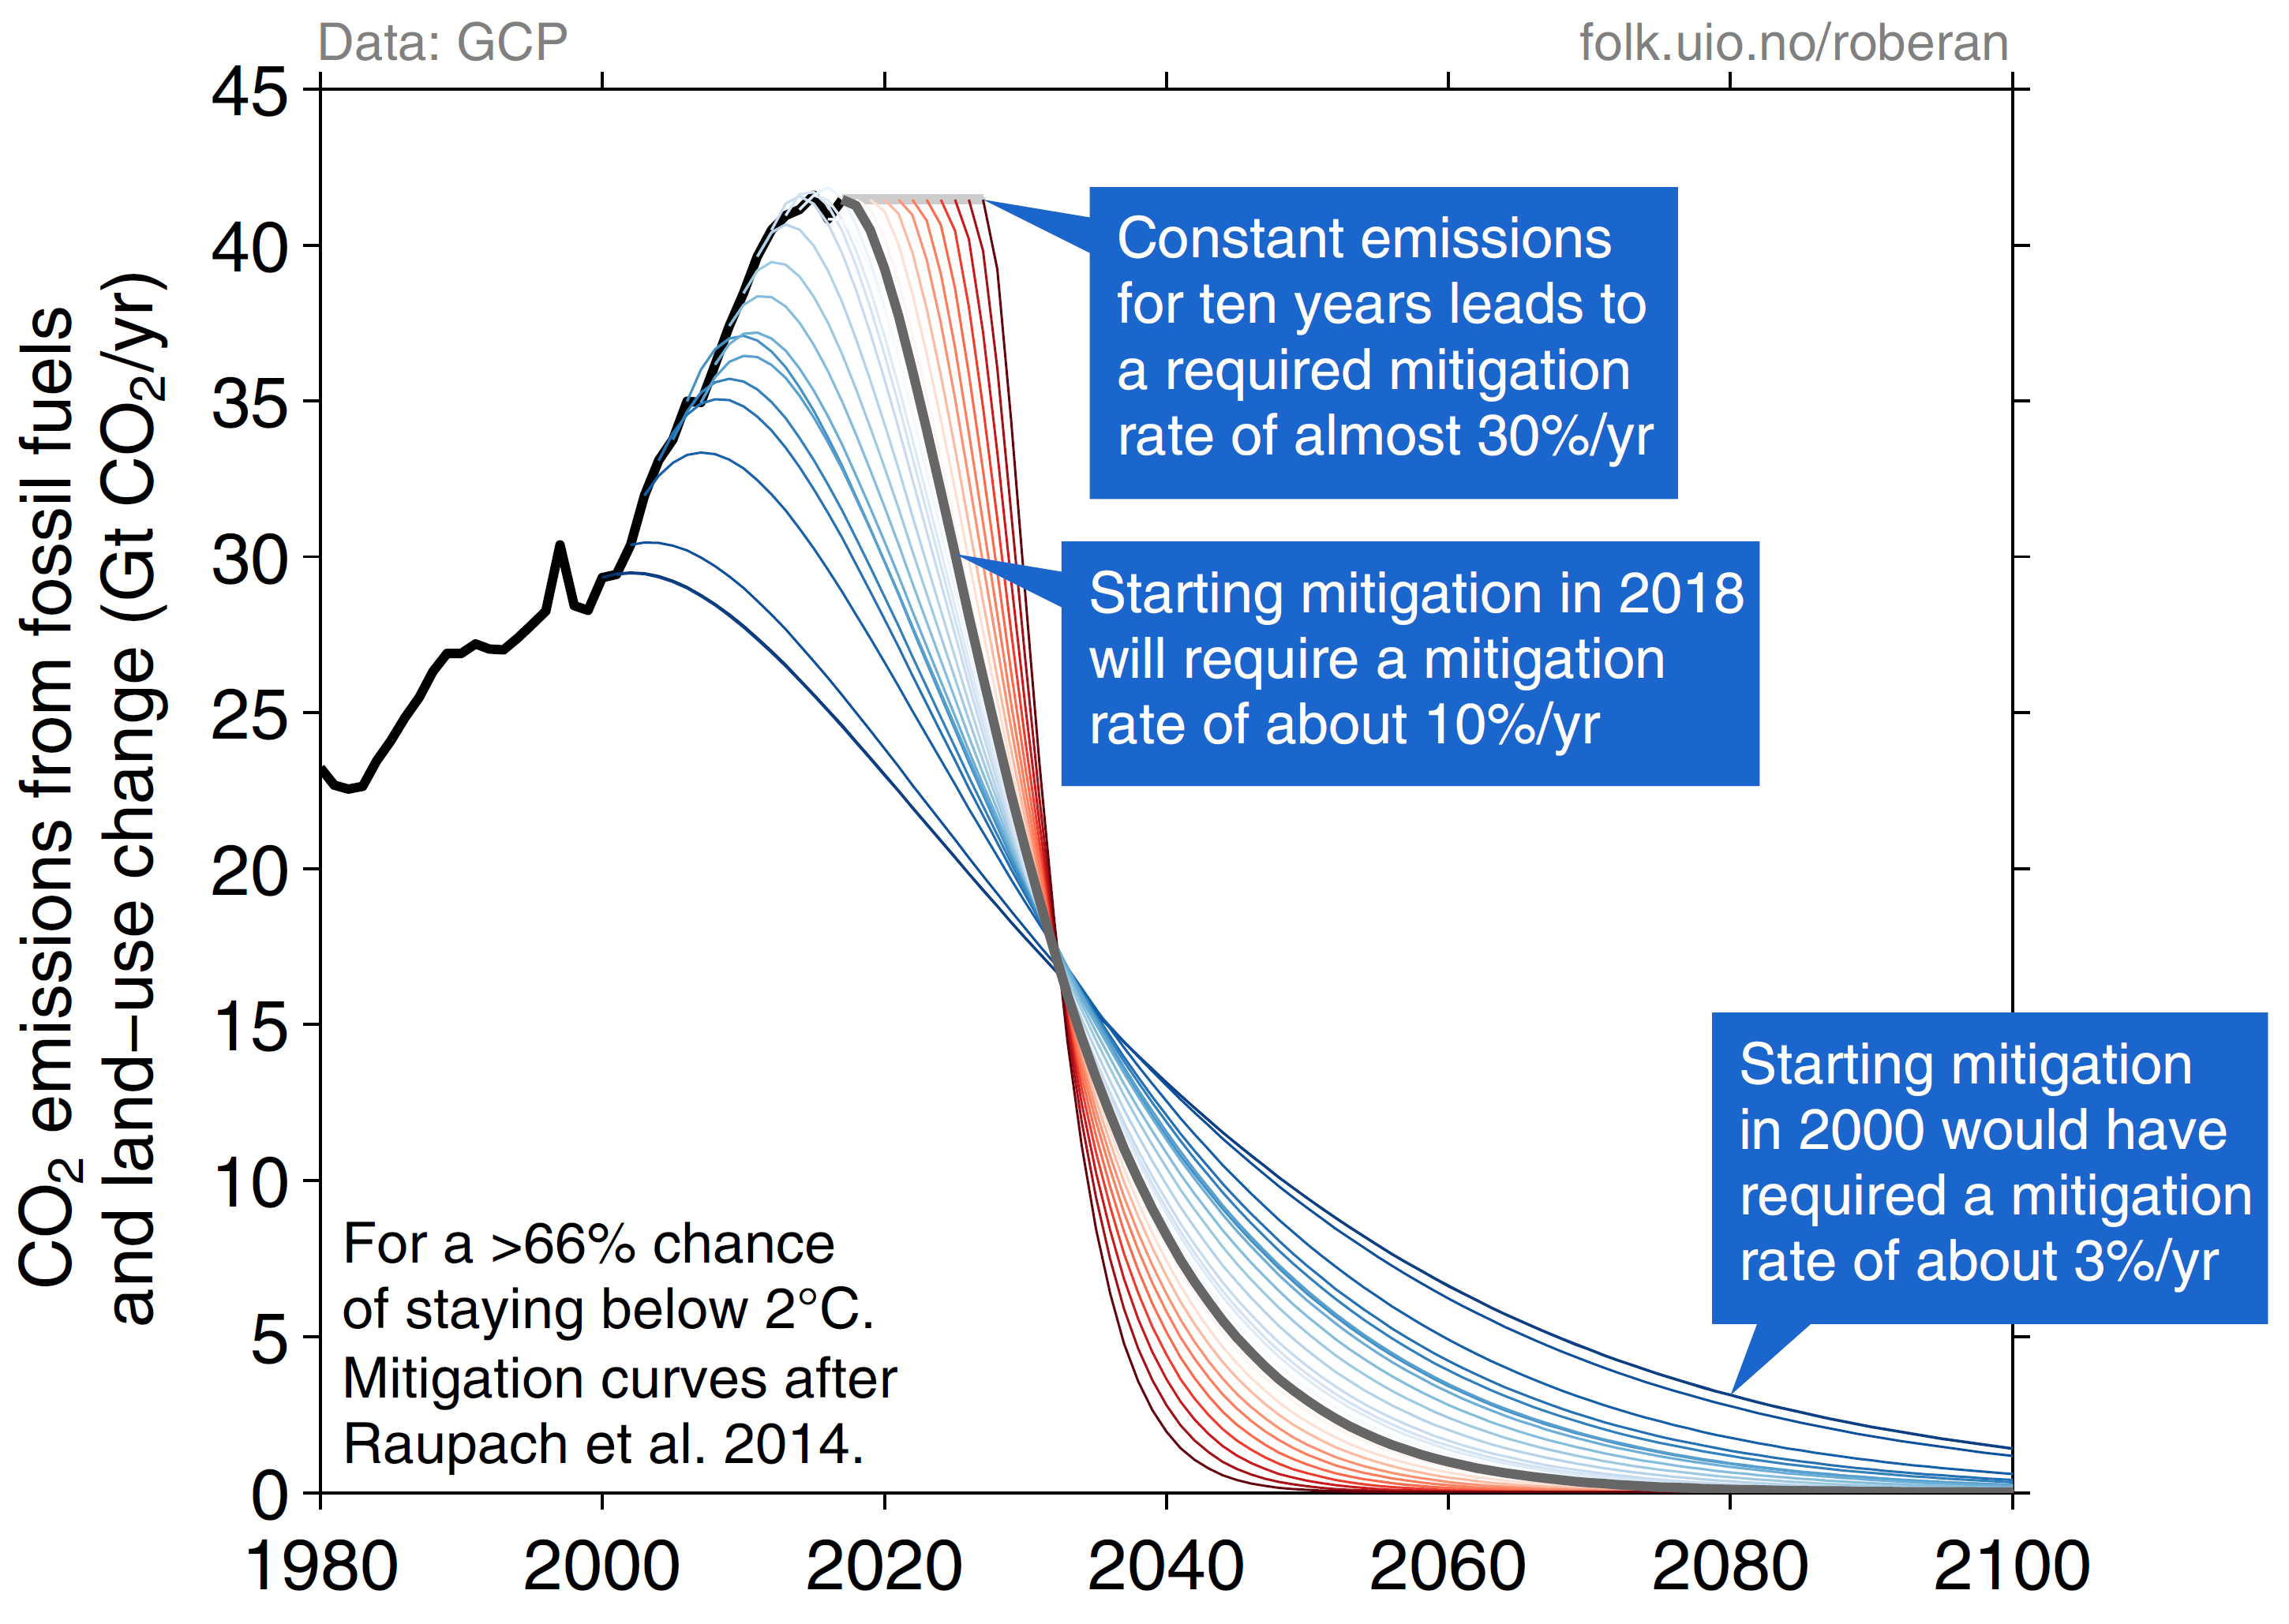
Source: Robbie Andrew8 – Senior Researcher at CICERO Centre for Global Climate Research.
The carbon budget here is 1,000 GtCO2 (or 273 GtC)Negative emissions & BECCS
Carbon removal extends our remaining carbon quotas

Source: Glen Peters9, Research Director at CICERO Centre for Global Climate Research.
Betting on negative emissions & BECCS
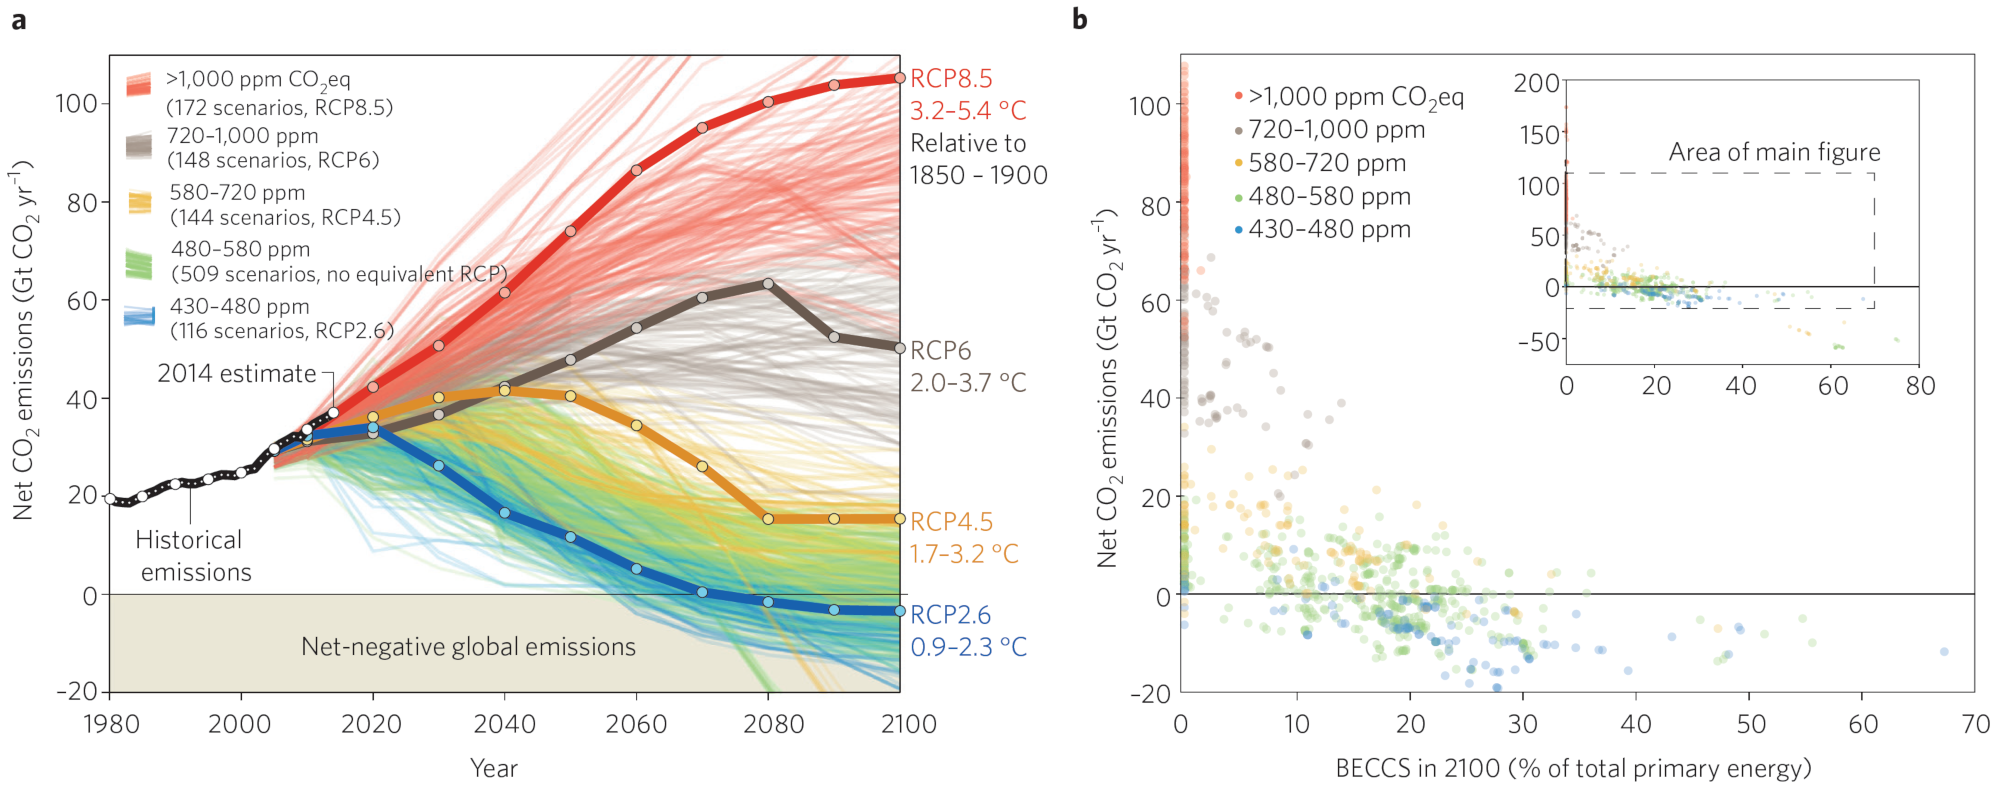
Source: Fuss et al (2014)10 Fig. 1
These articles explain the need to reduce our greenhouse gas emissions today, rather than relying on the hope of developing effective ‘negative emissions’ technologies in the future:- Anderson & Peters (2016) The trouble with negative emissions11
- Smith et al (2016) Biophysical and economic limits to negative CO2 emissions12
Timeline: How BECCS became climate change’s ‘saviour’ technologySmith et al (2016) Biophysical and economic limits to negative CO2 emissions12
A taxonomy of negative emissions technologies (NETs)
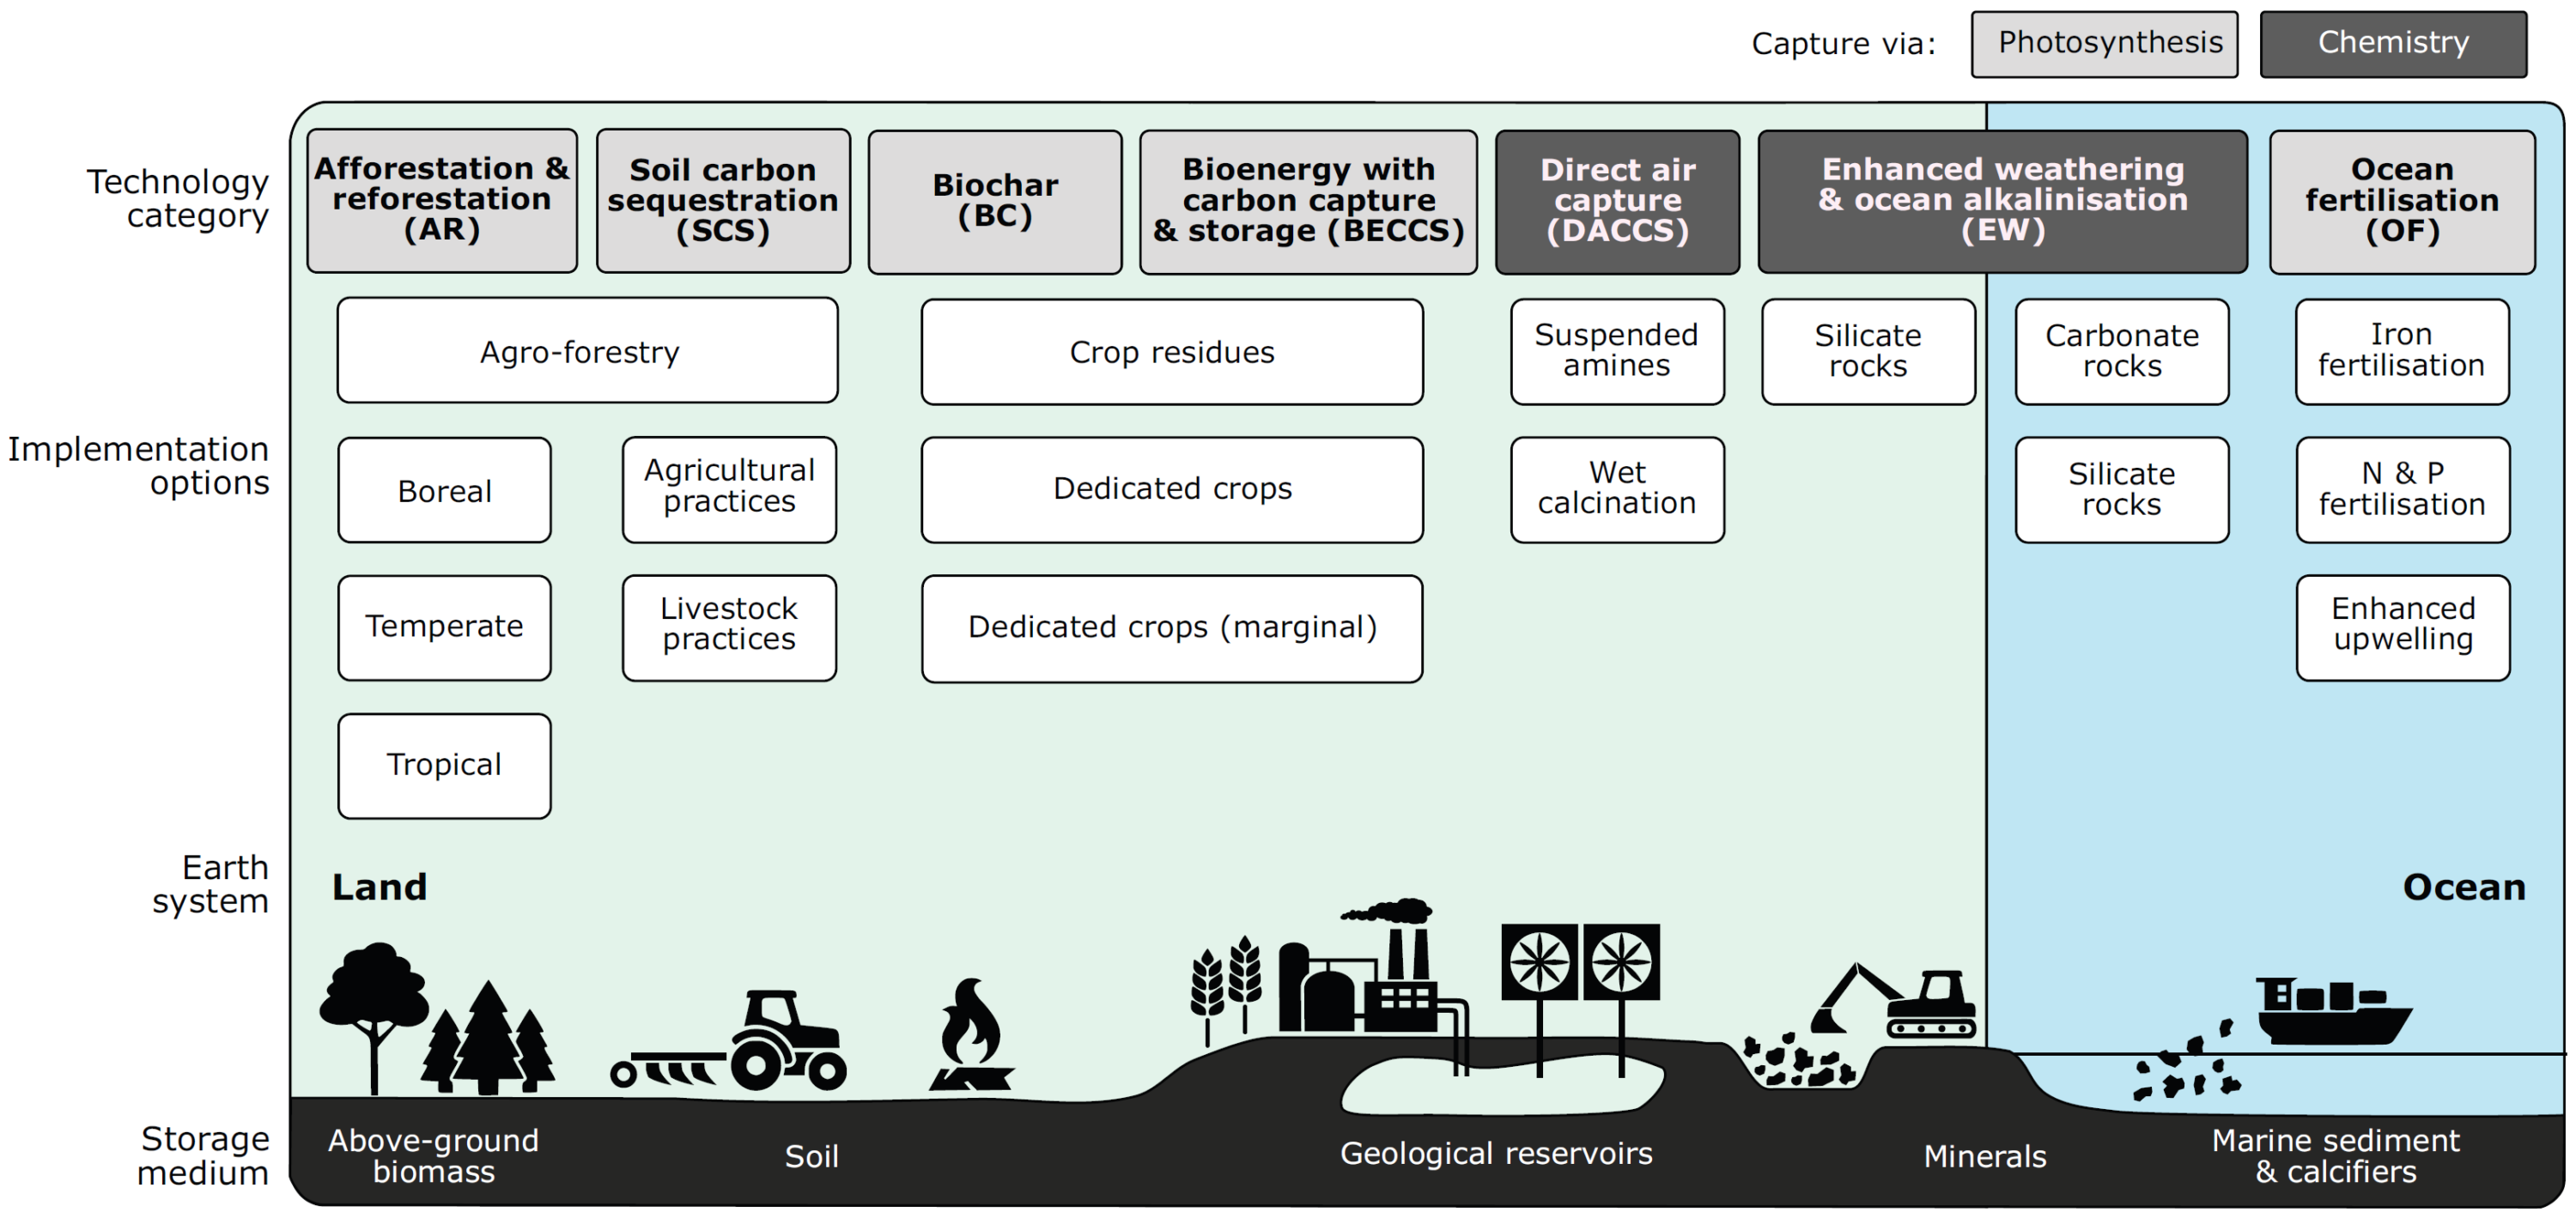
Source: Minx et al (2018)14 Fig. 2
Negative emissions technologies – costs, potentials, and side-effects

Source: Minx et al (2018)14 Fig. 6
Carbon flows among atmospheric, land, ocean and geological reservoirs
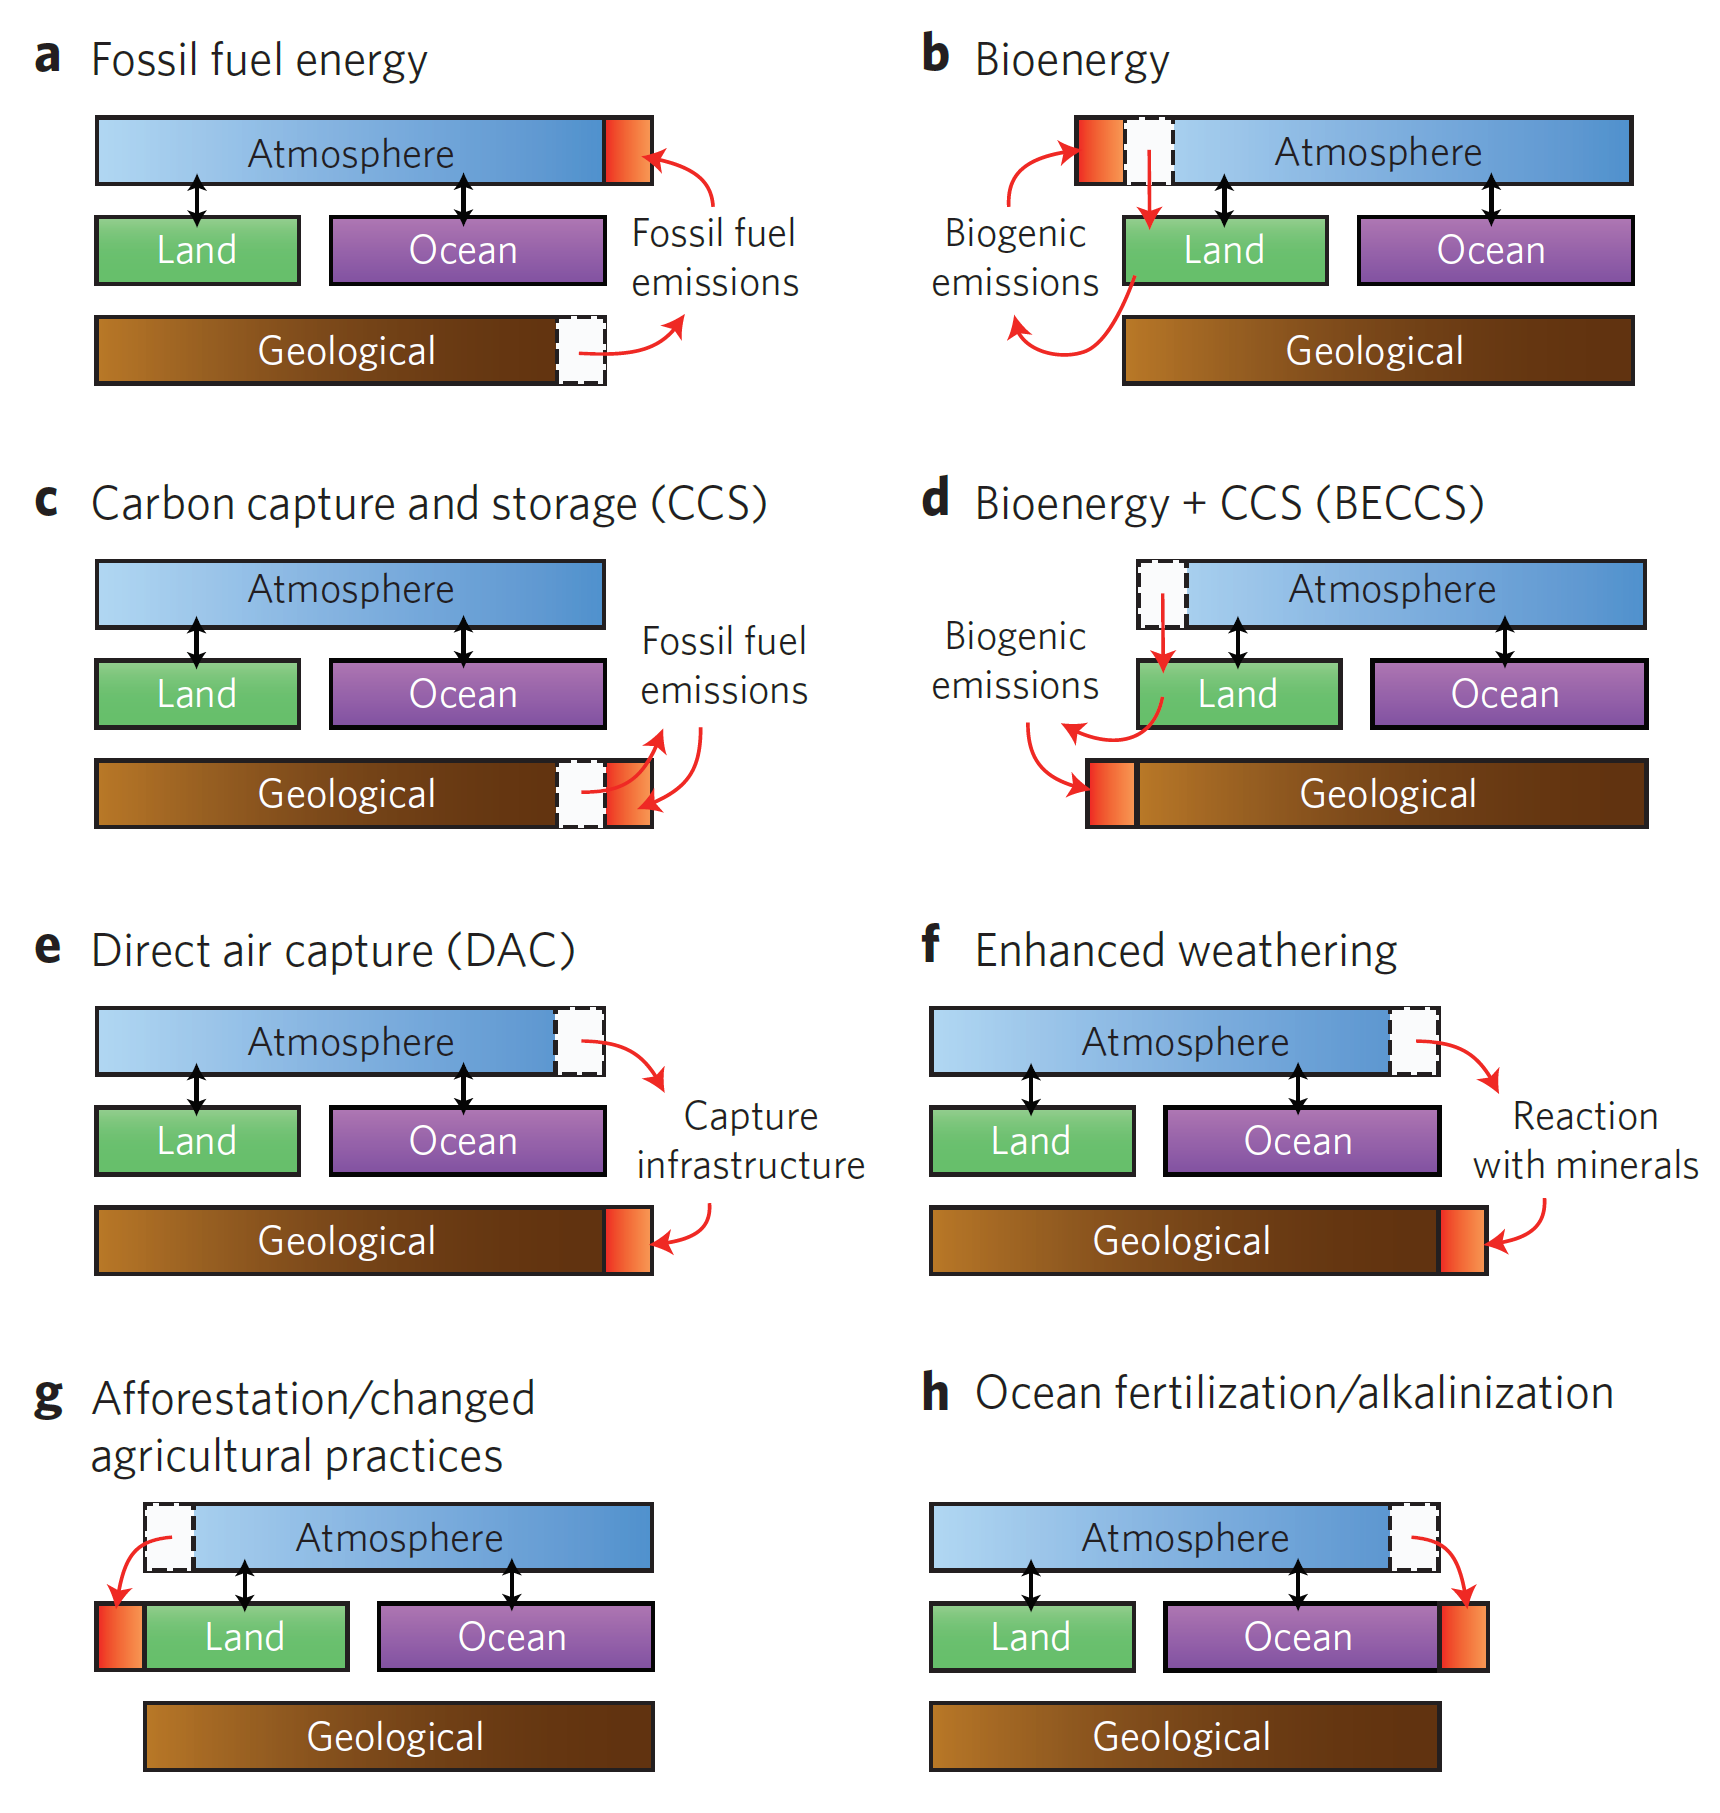
Source: Smith et al (2016)12 Fig. 1
IPCC scenarios reliant on BECCS
“Of the 114 scenarios assessed by the IPCC leading to forcing values of around 2.6 Wm−2 (likely probability for 2°C), 104 show net CDR in the second half of the century, mostly achieved by bioenergy with CCS (BECCS)” (CDR is ‘carbon dioxide removal’, or ‘negative emissions’)van Vuuren et al (2018)15
A decarbonisation scenario that avoids BECCS.
“This analysis shows that alternative pathways exist allowing for more moderate use and postponement of BECCS”. BECCS can “be limited by a range of societal and technological factors and choices” … “A rapid transformation in energy consumption and land use is needed in all scenarios”van Vuuren et al (2018)15
Scenarios and assumptions

Source: van Vuuren et al (2018)15 Table 1
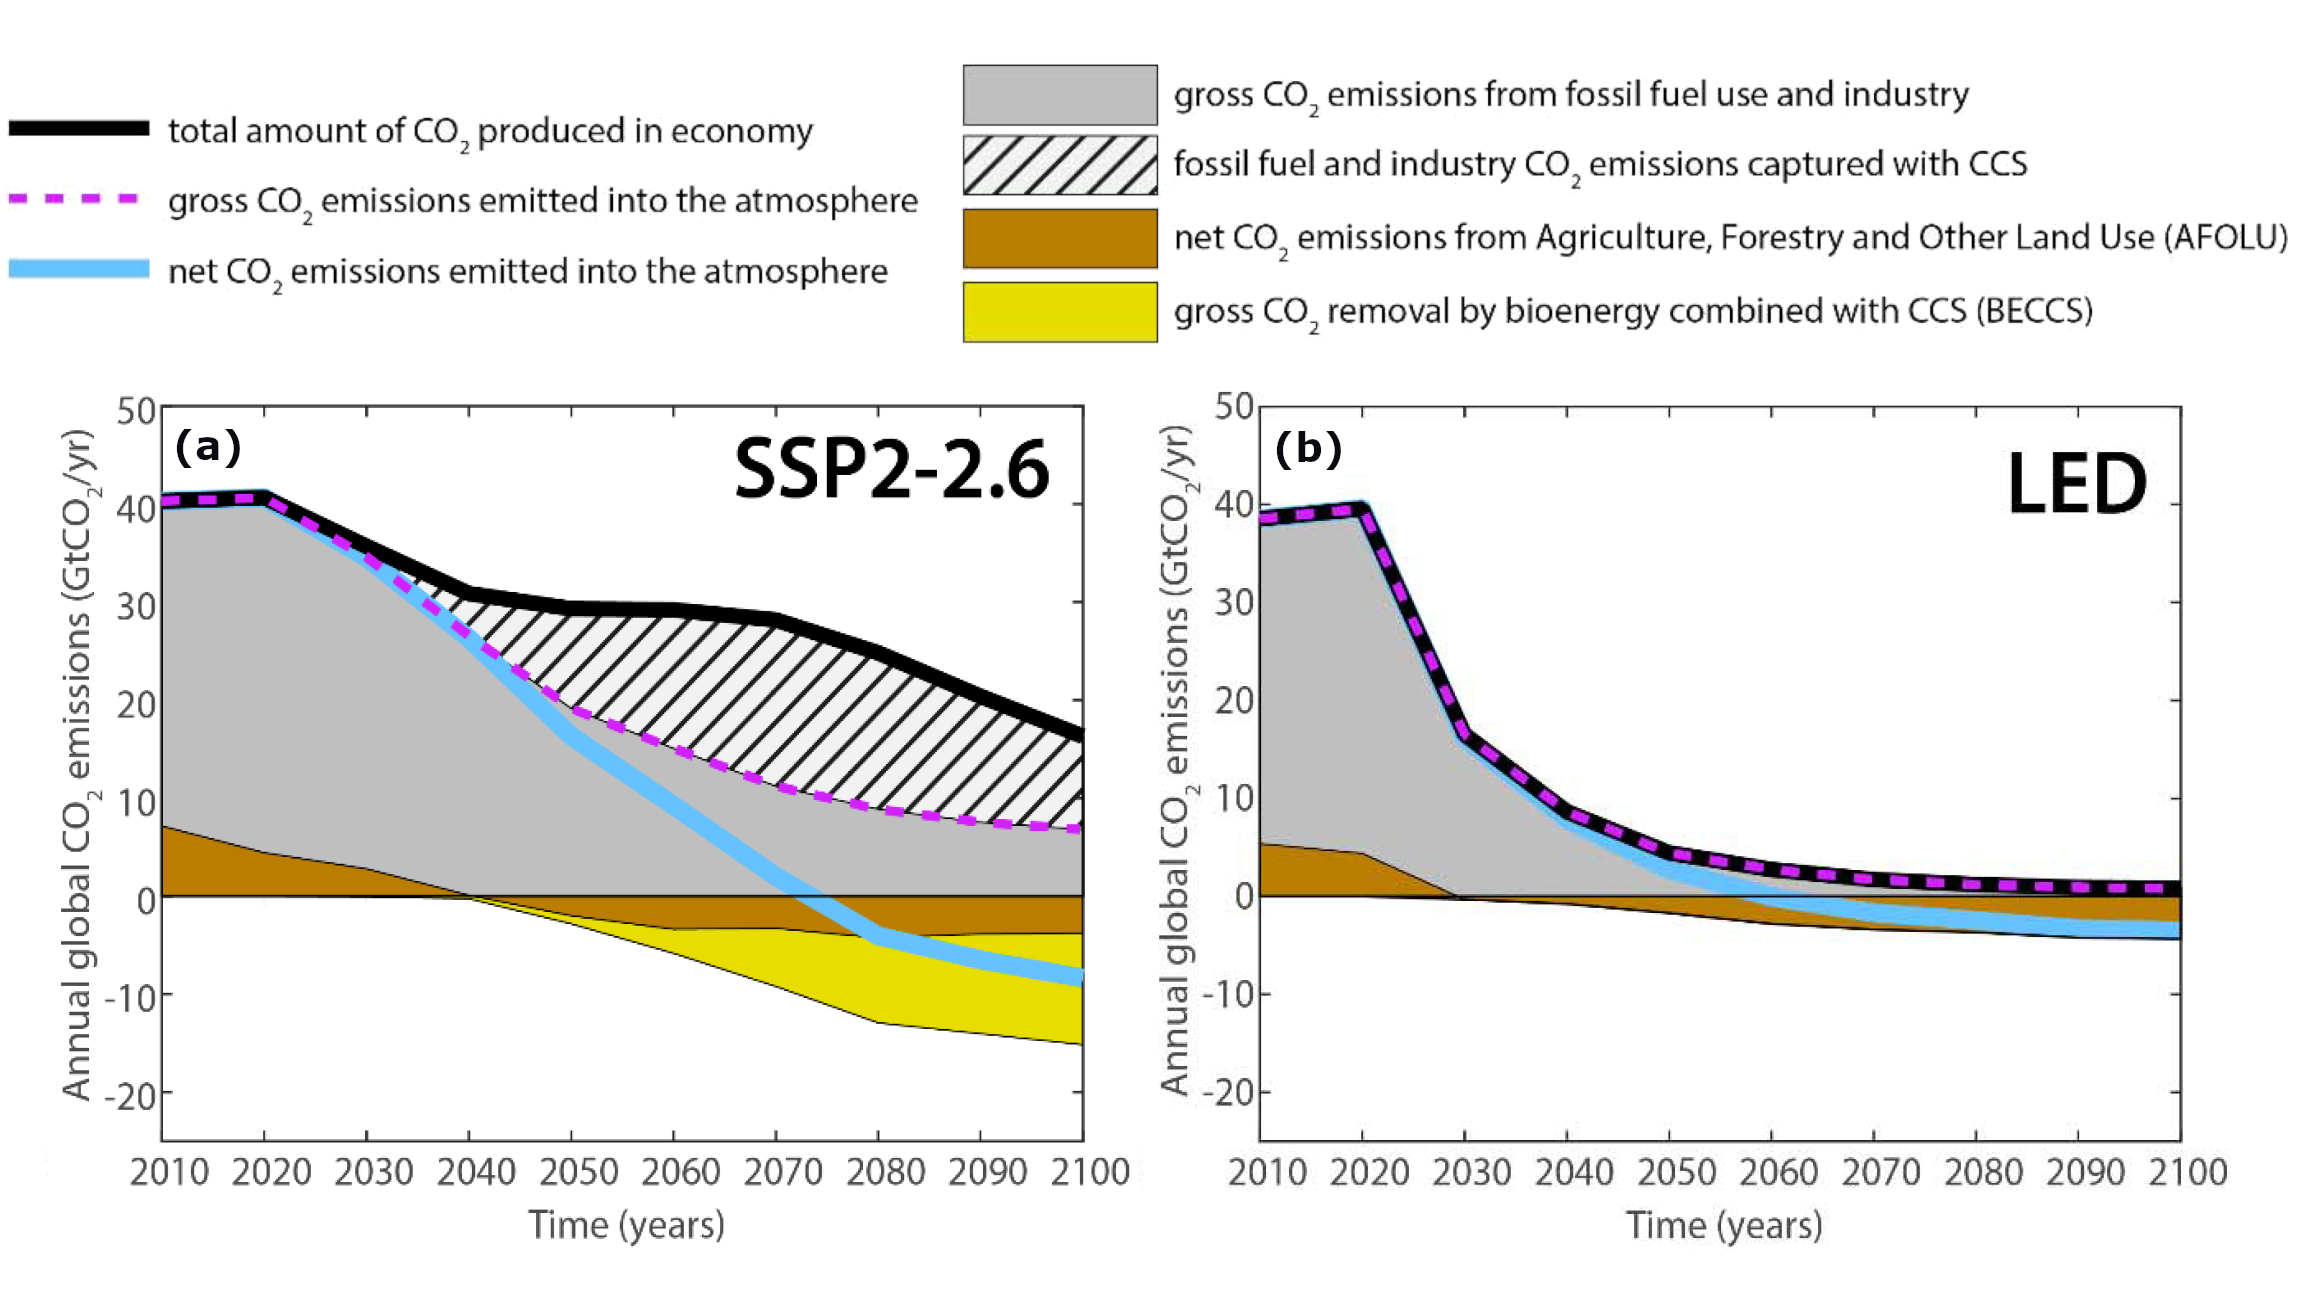
Avoiding reliance on BECCS by decarbonising via alternative pathways
Source: van Vuuren et al (2018)15 Fig. 3c
Trad.Bio: traditional bioenergy Mod.Bio: modern bioenergy Mod.BECCS: modern BECCS The baseline for this scenario is IPCC’s ‘SSP2’ ‘Middle of the road’. Key point: there’s no BECCS in the ‘Total’ scenario (which combines the other scenarios in this study). Many decarbonisation scenarios rely on BECCS to reach net-zero emissions (eg. some scenarios used by IPCC, some IEA scenarios, Shell’s ‘Sky’ scenario, etc). There are concerns about damage that would be caused by large-scale BECCS. The primary energy mix is mostly solar and wind in 2100, with a continued reliance on gas, gas with CCS, coal with CCS, oil, and nuclear power. Other groups recommend energy mixes with far less reliance on fossil fuels. The van Vuuren et al (2018) article was discussed by David Roberts in Vox16 and here:World can limit global warming to 1.5C ‘without BECCS’
Avoiding ‘unfair and risky’ climate change scenarios
Guest post: How to avoid ‘unfair and risky’ climate change scenarios
Source: Rogelj20 for CarbonBrief, Sept. 2019
Three structural elements that define the level of achievement of the Paris Agreement’s long-term temperature goal (LTTG)
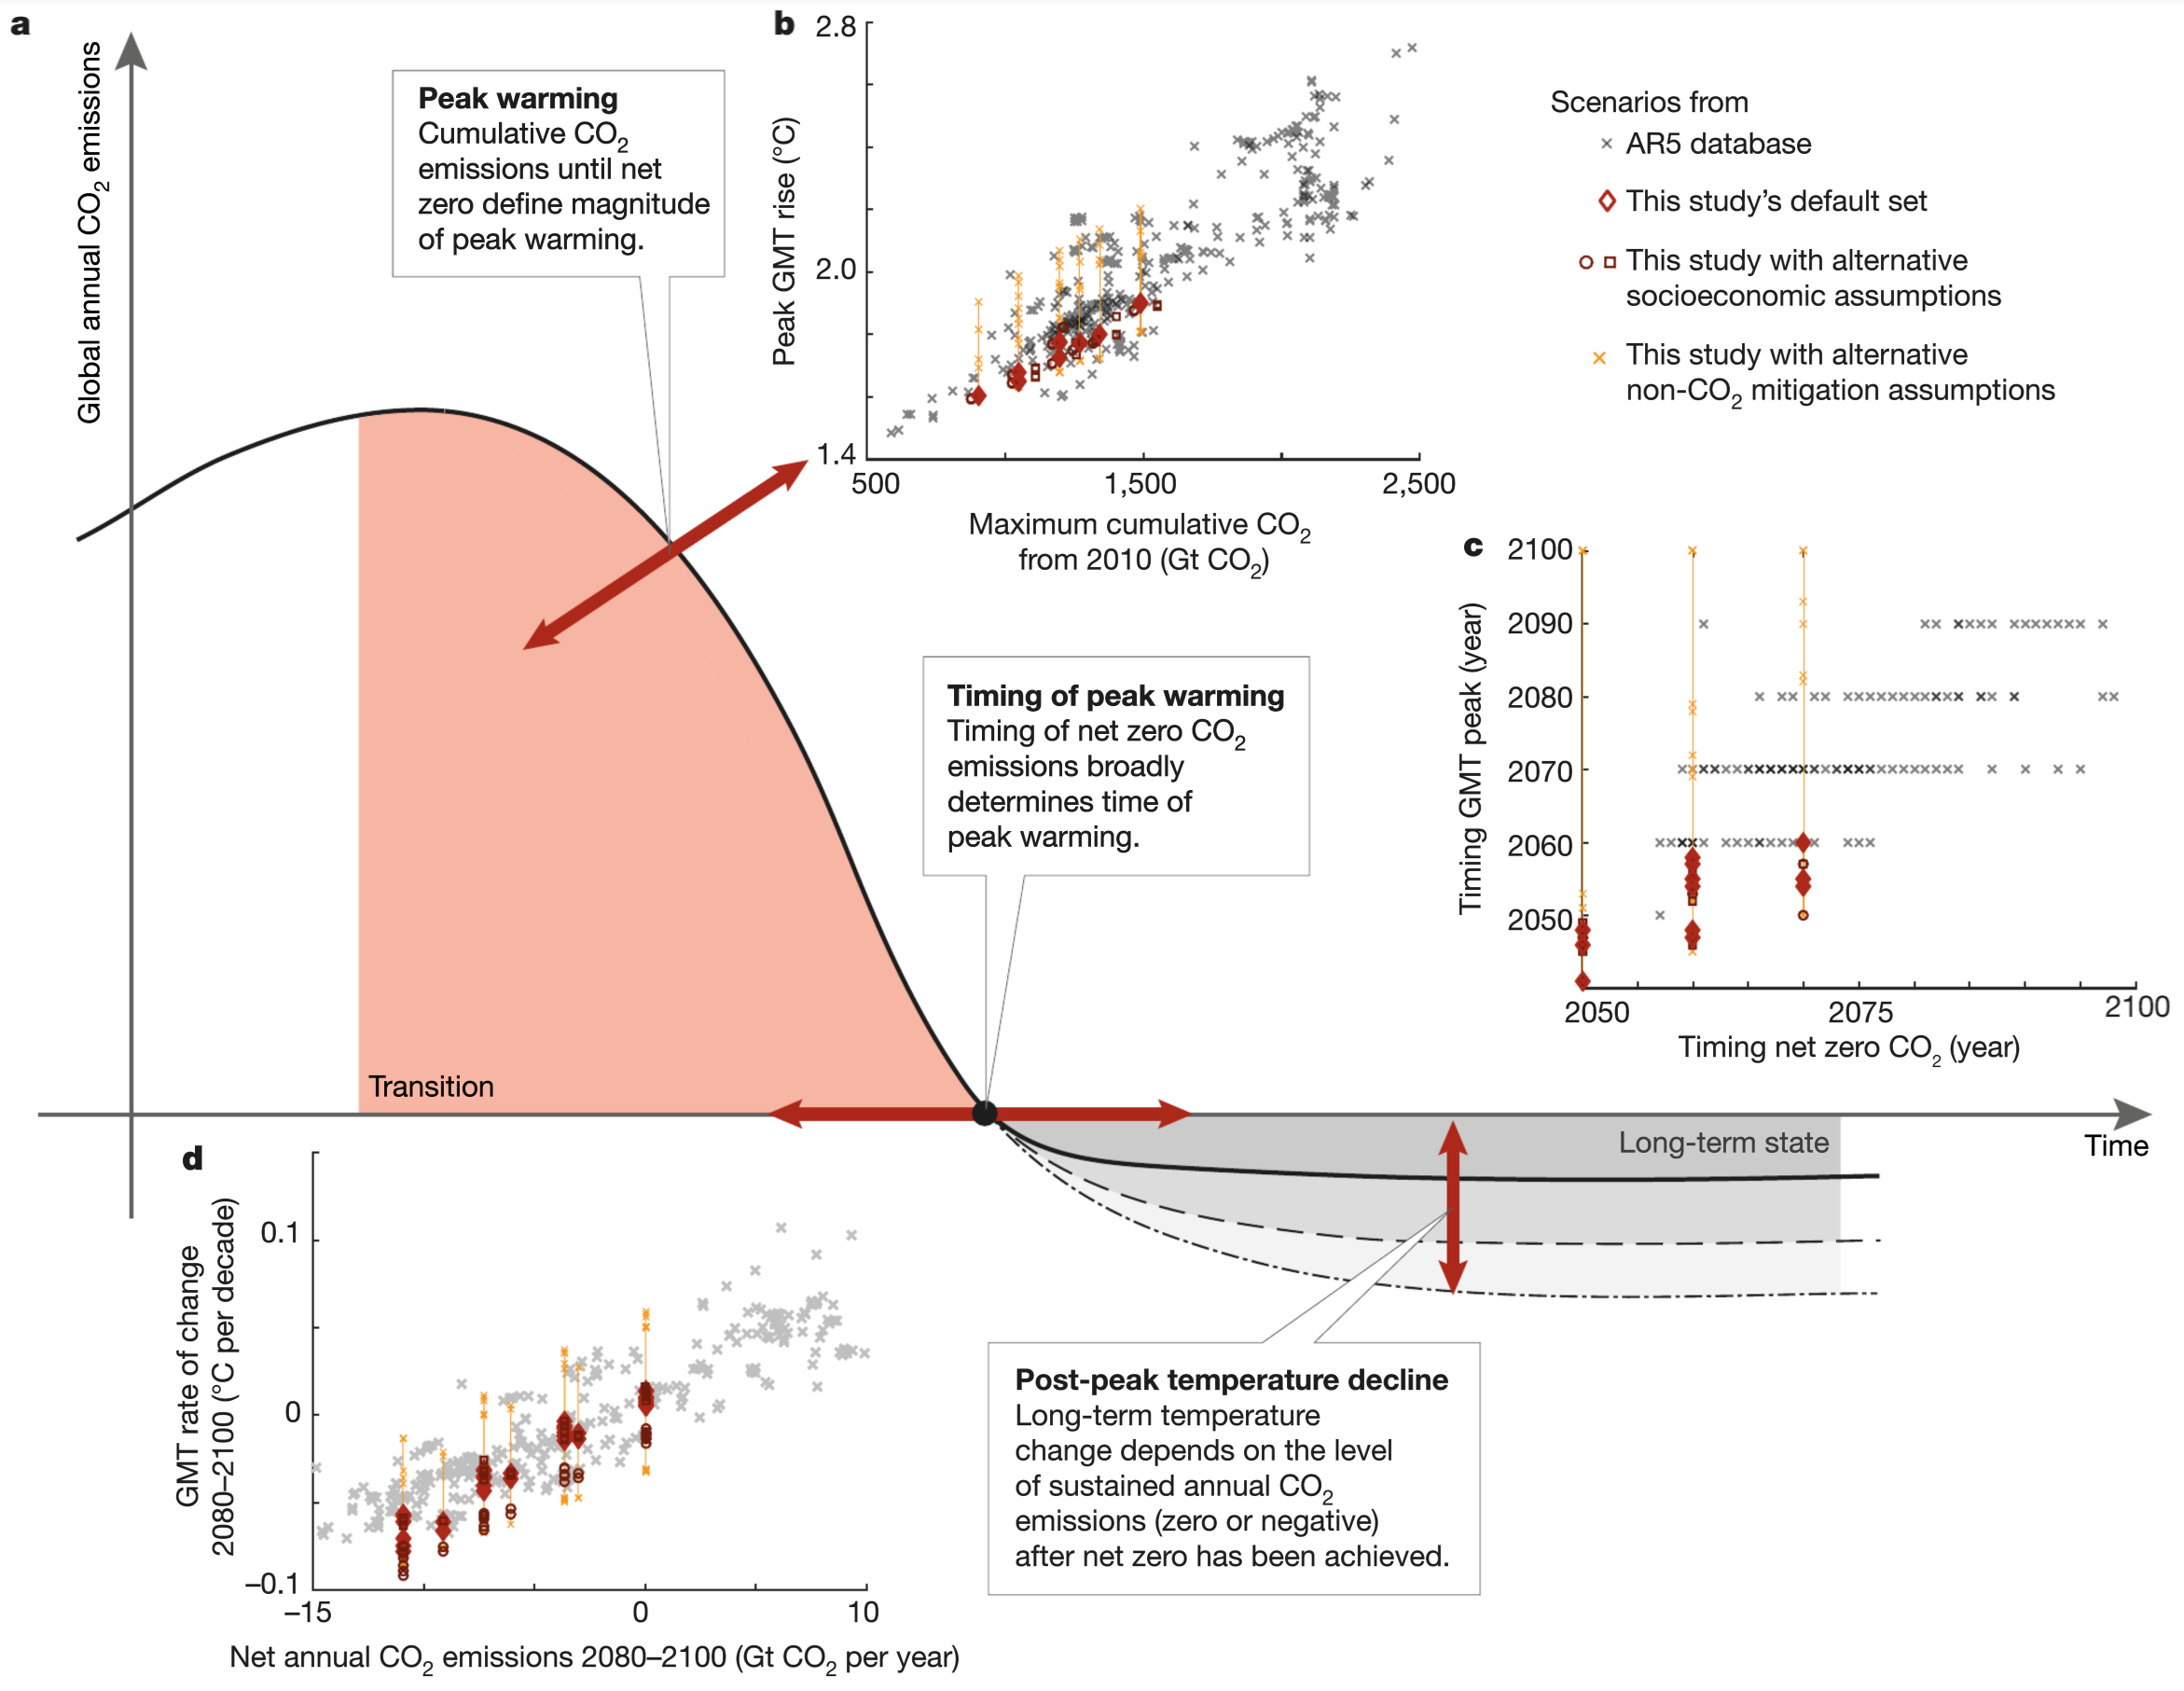
Source: Rogelj et al (2019)21 Fig. 1
Scenario variations of contributions of CDR technologies and bioenergy to achieve different levels of negative emissions

Source: Rogelj et al (2019)21 Fig. 3
Global mitigation investment evolutions and choices in scenarios
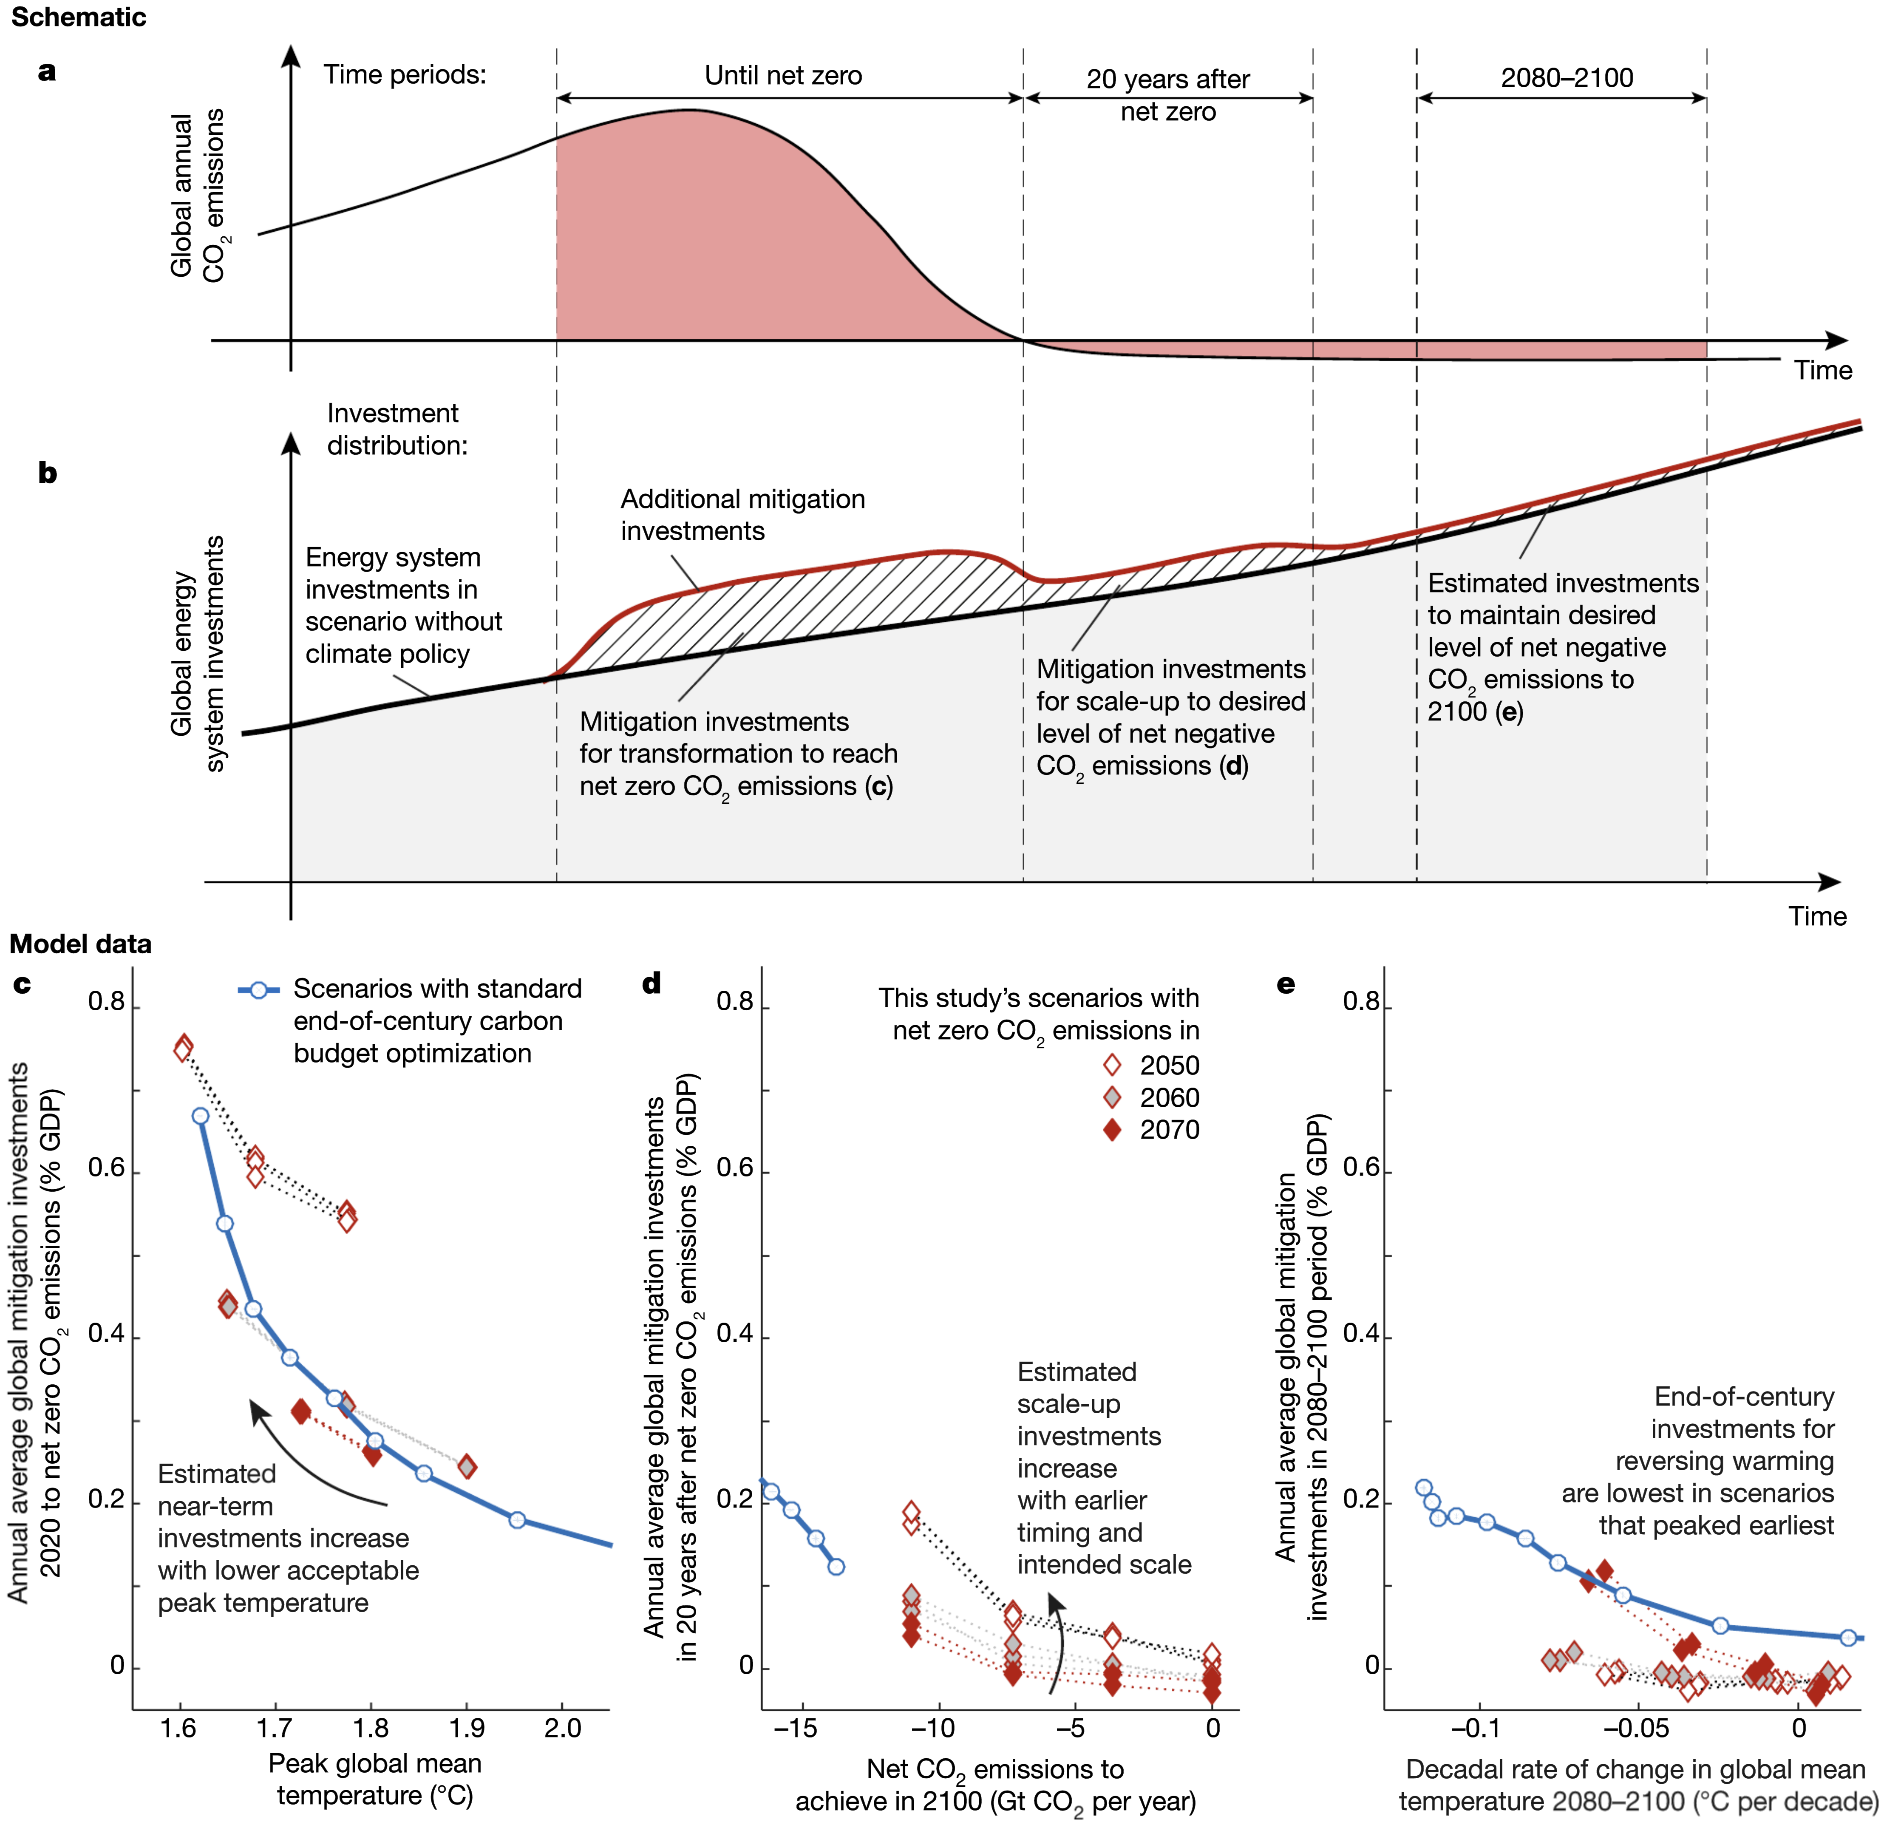
Source: Rogelj et al (2019)21 Fig. 4
Natural Climate Solutions
Natural Climate Solutions
Natural climate solutions (NCS): “20 conservation, restoration, and/or improved land management actions that increase carbon storage and/or avoid greenhouse gas emissions across global forests, wetlands, grasslands, and agricultural lands. We show that NCS can provide over one-third of the cost-effective climate mitigation needed between now and 2030 to stabilize warming to below 2 °C. Alongside aggressive fossil fuel emissions reductions, NCS offer a powerful set of options for nations to deliver on the Paris Climate Agreement while improving soil productivity, cleaning our air and water, and maintaining biodiversity.”Griscom et al (2017)17
“our existing knowledge reported here provides a solid basis for immediately prioritizing NCS as a cost-effective way to provide 11 PgCO2e y−1 of climate mitigation within the next decade—a terrestrial ecosystem opportunity not fully recognized by prior roadmaps for decarbonization. Delaying implementation of the 20 natural pathways presented here would increase the costs to society for both mitigation and adaptation, while degrading the capacity of natural systems to mitigate climate change and provide other ecosystem services. Regreening the planet through conservation, restoration, and improved land management is a necessary step for our transition to a carbon neutral global economy and a stable climate.”Griscom et al (2017)17
Climate mitigation potential of 20 natural pathways

Source: Griscom et al (2017)17 Fig. 1
Contribution of natural climate solutions (NCS) to stabilising warming to below 2°C

Source: Griscom et al (2017)17 Fig. 2
“The green area shows cost effective NCS (aggregate of 20 pathways), offering 37% of needed mitigation through 2030, 29% at year 2030, 20% through 2050, and 9% through 2100. This scenario assumes that NCS are ramped up linearly over the next decade to <2°C levels indicated in Fig. 1 and held at that level (=10.4 PgCO2 y−1, not including other greenhouse gases). It is assumed that fossil fuel emissions are held level over the next decade then decline linearly to reach 7% of current levels by 2050″.Source: Griscom et al (2017)17
Mitigation potential by greenhouse gas, biome, and flux type
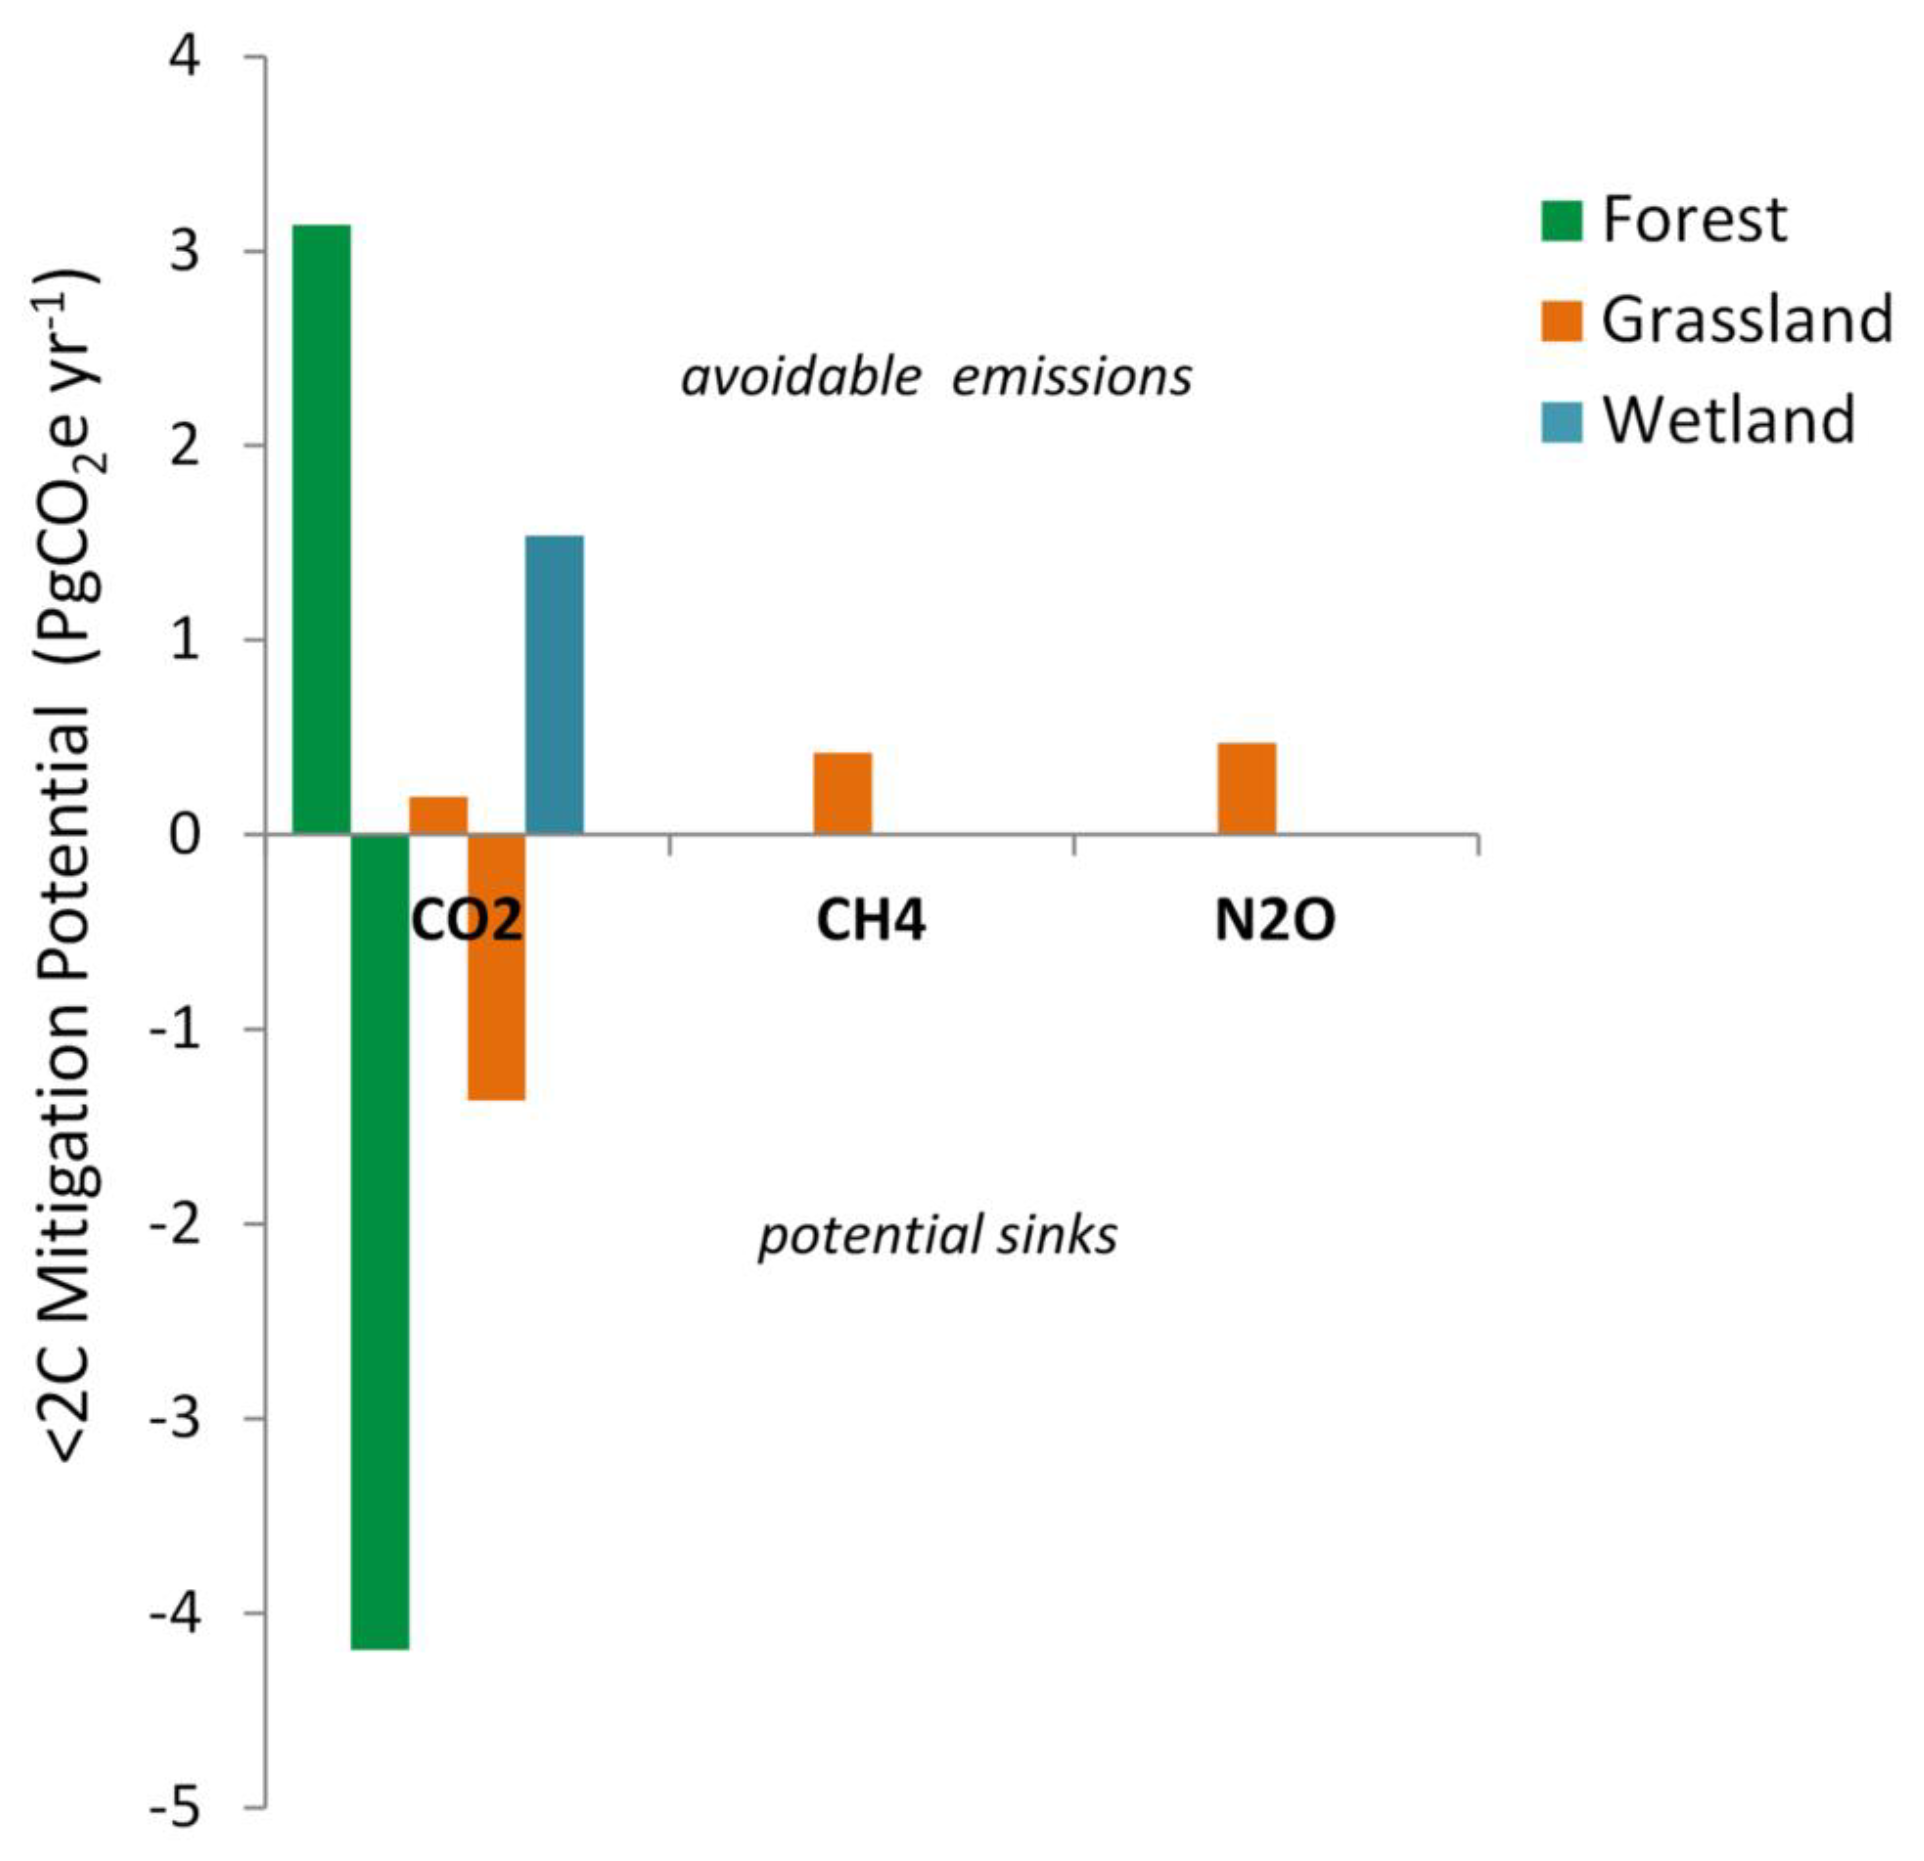
Source: Griscom et al (2017)18 (Supporting information) Fig. S4
The above article on Natural Climate Solutions is also discussed here:Analysis: How ‘natural climate solutions’ can reduce the need for BECCS

- Le Quéré et al (2018) Global Carbon Budget 2018
- ‘Global emissions projections and Paris 2015 target’, Climate Action Tracker, update downloaded 3rd March 2019
- ‘Global emissions projections to 2030 and emissions gaps to Paris target’, Climate Action Tracker, update downloaded 3rd March 2019
- IEA (2017) Perspectives for the energy transition – Investment needs for a low-carbon energy system
- Friedlingstein et al (2014) Persistent growth of CO2 emissions and implications for reaching climate targets
- Rogelj et al (2016) Differences between carbon budget estimates unravelled
- IPCC (2018) Special Report: Global Warming of 1.5°C
- ‘Global mitigation curves’, Robbie Andrew, accessed online 17th August 2018
- ‘Carbon removal extends our remaining carbon quotas’, Glen Peters, accessed online 18th August 2018
- Fuss et al (2014) Betting on negative emissions
- Anderson & Peters (2016) The trouble with negative emissions
- Smith et al (2016) Biophysical and economic limits to negative CO2 emissions
- Carbon Brief (2016) Timeline: How BECCS became climate change’s ‘saviour’ technology
- Minx et al (2018) Negative emissions – Part 1 – Research landscape and synthesis
- van Vuuren et al (2018) Alternative pathways to the 1.5°C target reduce the need for negative emission technologies
- ‘What genuine, no-bullshit ambition on climate change would look like’, David Roberts, Vox, updated 8th May 2018
- Griscom et al (2017) Natural climate solutions
- Griscom et al (2017) Natural climate solutions – Supporting Information Appendix
- CarbonBrief (2018) Analysis: How ‘natural climate solutions’ can reduce the need for BECCS
- How to avoid ‘unfair and risky’ climate change scenarios, Joeri Rogelj for CarbonBrief, 18 Sept. 2019
- Rogelj et al (2019) A new scenario logic for the Paris Agreement long-term temperature goal

