Key ideas
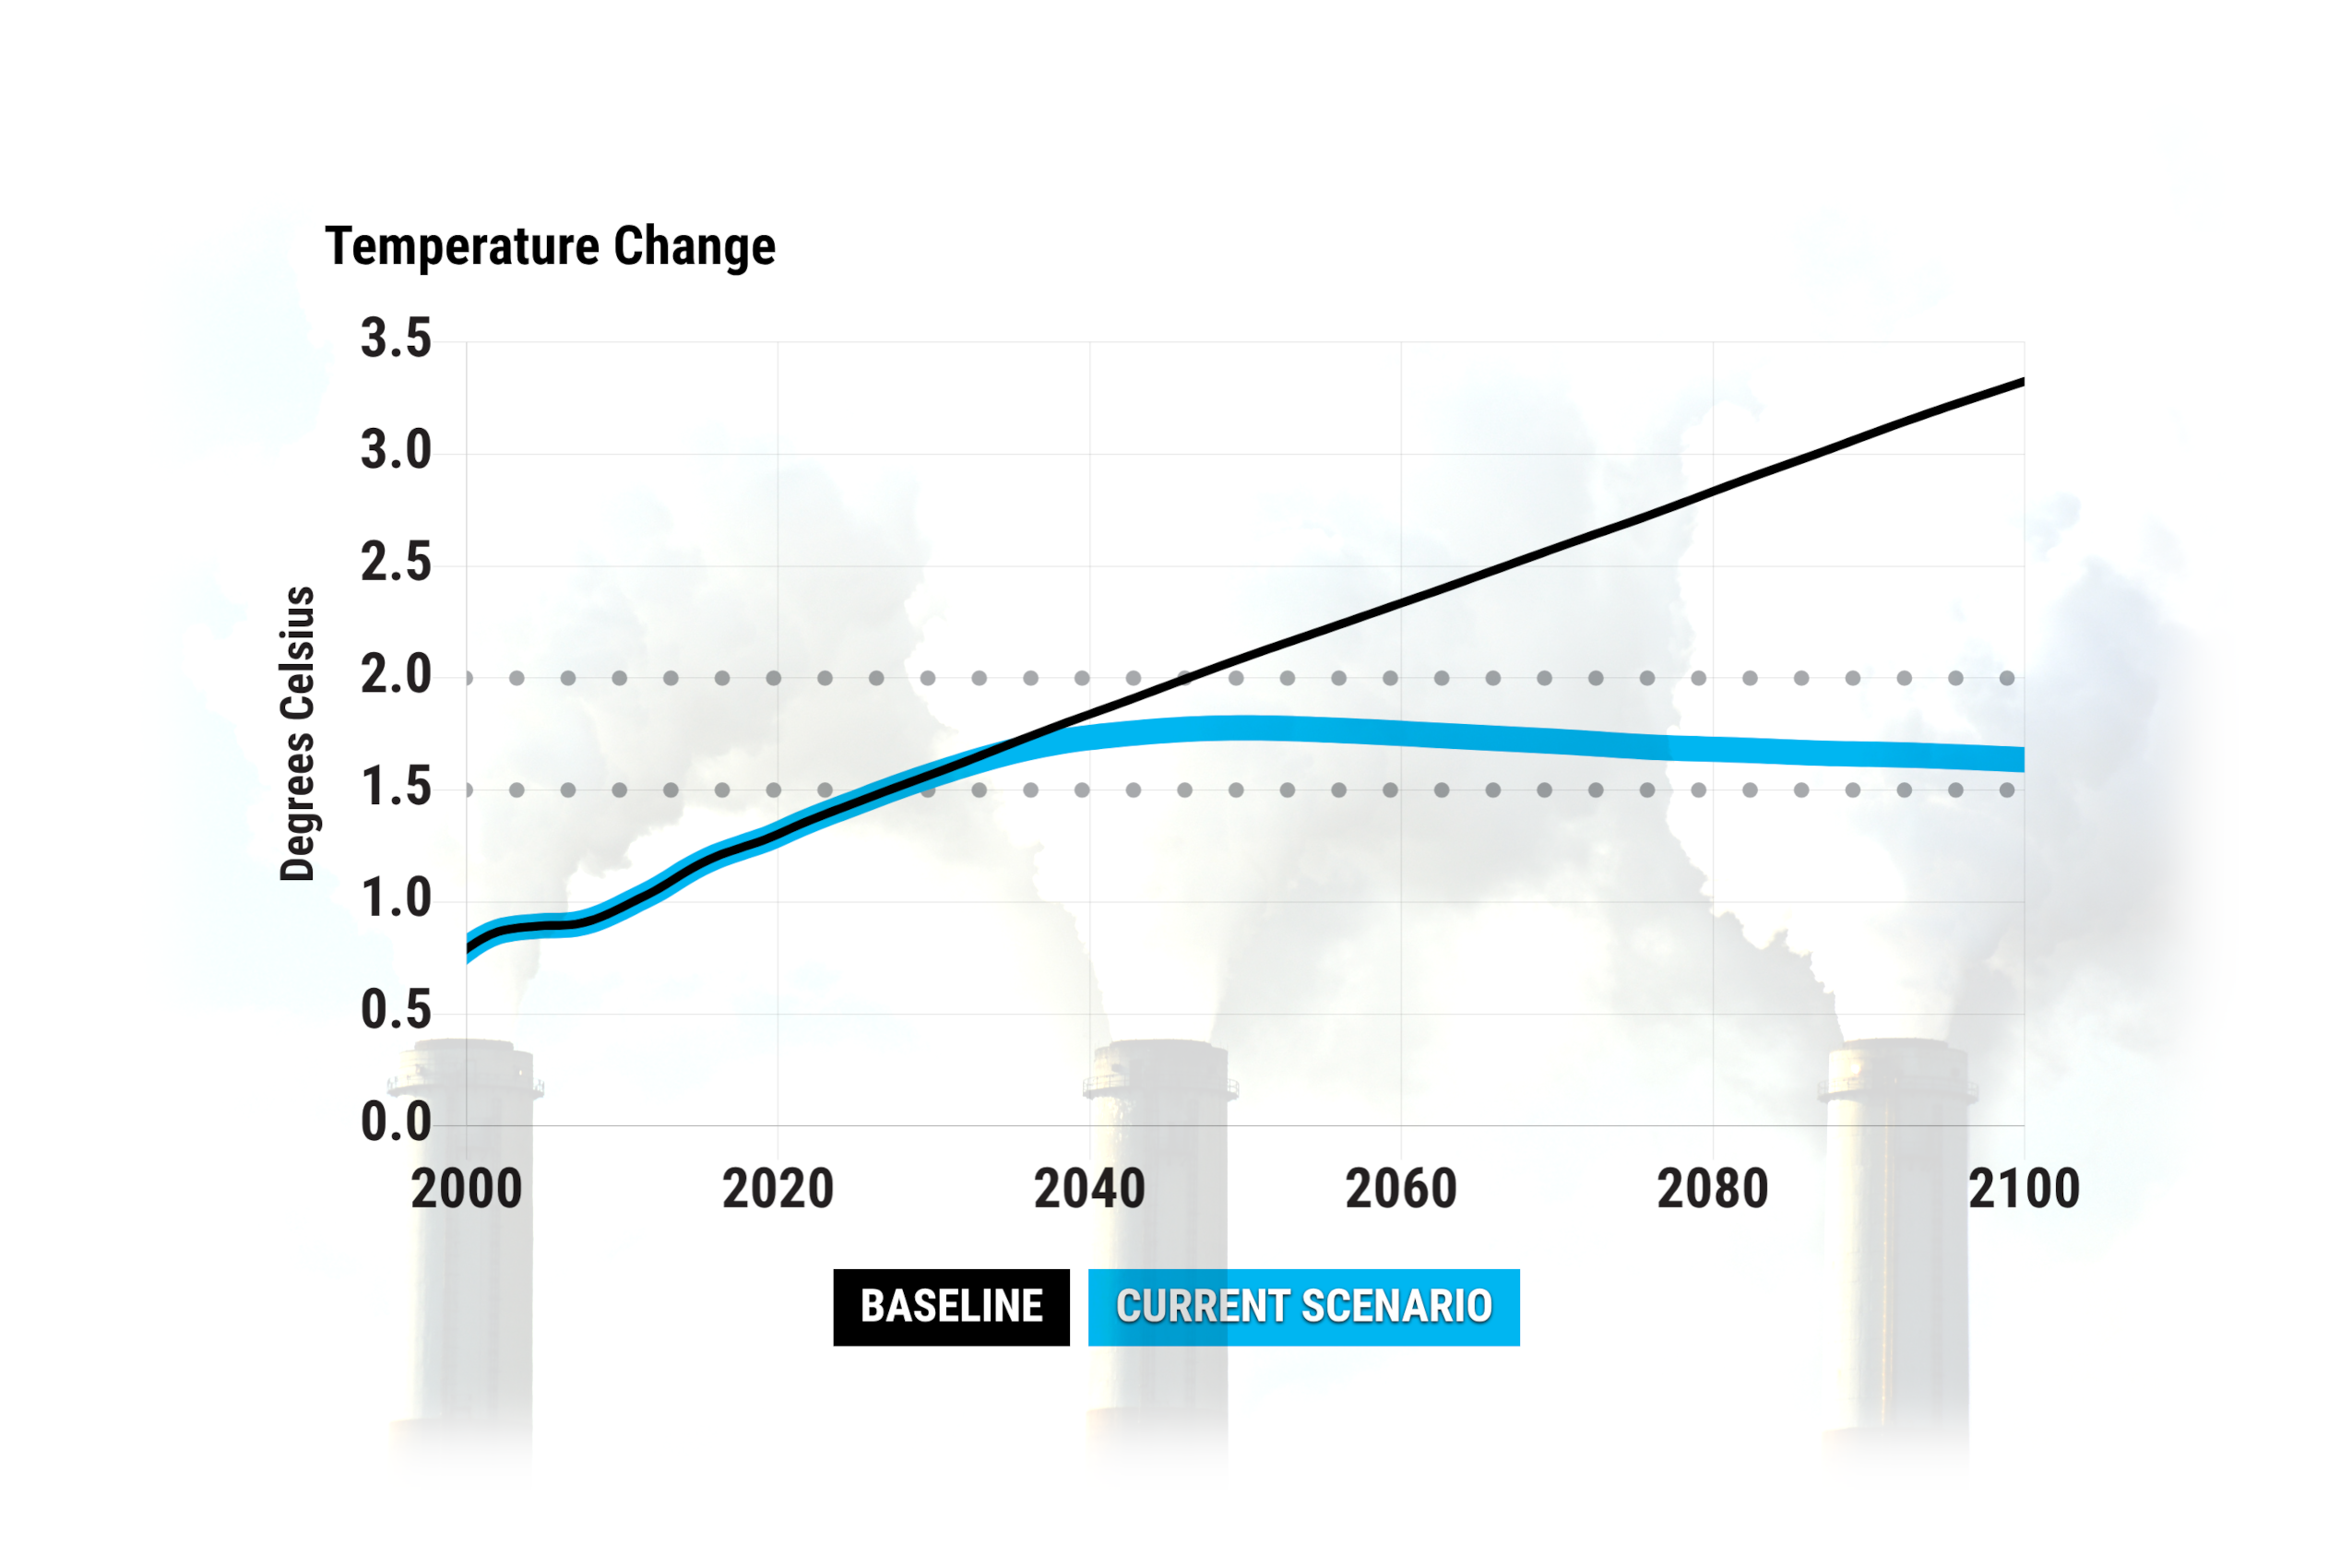
In theory we can stabilise and reduce the global mean temperature in the 21st century via rapid decarbonisation and wise policies, to avoid a dangerous escalation of human-caused climate change. Climate Interactive & MIT Sloan’s En-ROADS Climate Solutions Simulator gives a simplified picture of some key aspects of the global decarbonisation challenge.
On En-ROADS website at this link you can move the sliders in the control panel to guide the global surface air temperature from the 3.3 deg°C in 2100 default level to something safer and more liveable. While it looks straightforward, exploring different combinations of mitigation options in En-ROADS simulator shows that it’s surprisingly difficult to stabilise the global mean temperature this century, but it’s definitely doable.
This post compares two scenarios: a more ambitious Early Action scenario resulting in 1.5°C by 2100 and a more believable Delayed Action scenario, which results in 2.3°C by 2100. Neither of these are radical scenarios in the sense that they’re both set to the status quo levels for ongoing population growth and ongoing economic growth (unless you consider that to be radical).
For the Early Action scenario, using En-ROADS default assumptions, market forces alone were apparently not sufficient to reduce the global temperature to 1.5°C by 2100. In addition to a range of the other measures, reaching 1.5°C by 2100 seemed to require the “reduction in utilization” slider in the detailed settings menus for coal, oil, and natural gas. A scenario like this can be useful to explore ideas, without being politically feasible.
The Delayed Action scenario fails to effectively address the core problem for a couple of decades, and then belatedly introduces a high carbon price and a range of measures, steering clear of the “reduction in utilization” setting for fossil fuels. These measures are expensive, some use truly vast areas of land to capture CO2, and they don’t sufficiently counteract the overwhelming cumulative fossil fuel emissions, to reduce the atmospheric CO2 concentration fast enough to reduce the global surface air temperature. The Delayed Action scenario (2.3°C by 2100) fails to stabilise the global mean temperature by 2100, let alone meet the Paris Agreement target:
“Holding the increase in the global average temperature to well below 2°C above pre-industrial levels and pursuing efforts to limit the temperature increase to 1.5°C above pre-industrial levels”
Source: UN (2015) Paris Agreement, pg. 3
Explanations of the scientific basis of the simulations with references are available on En-ROADS Climate Solutions Simulator site and in the settings menus.
Note: this is an early version of this post. The two scenarios and the outcomes haven’t been properly explained yet.
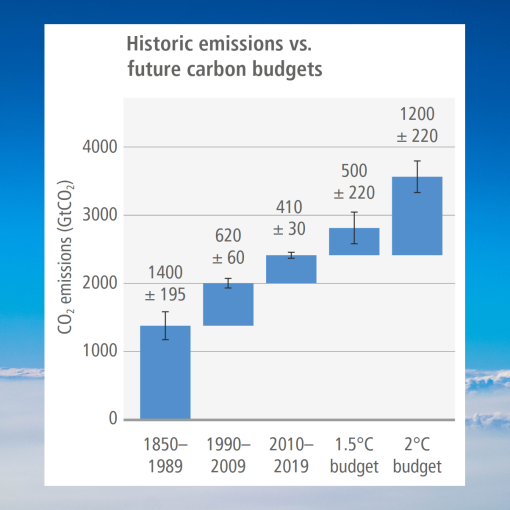
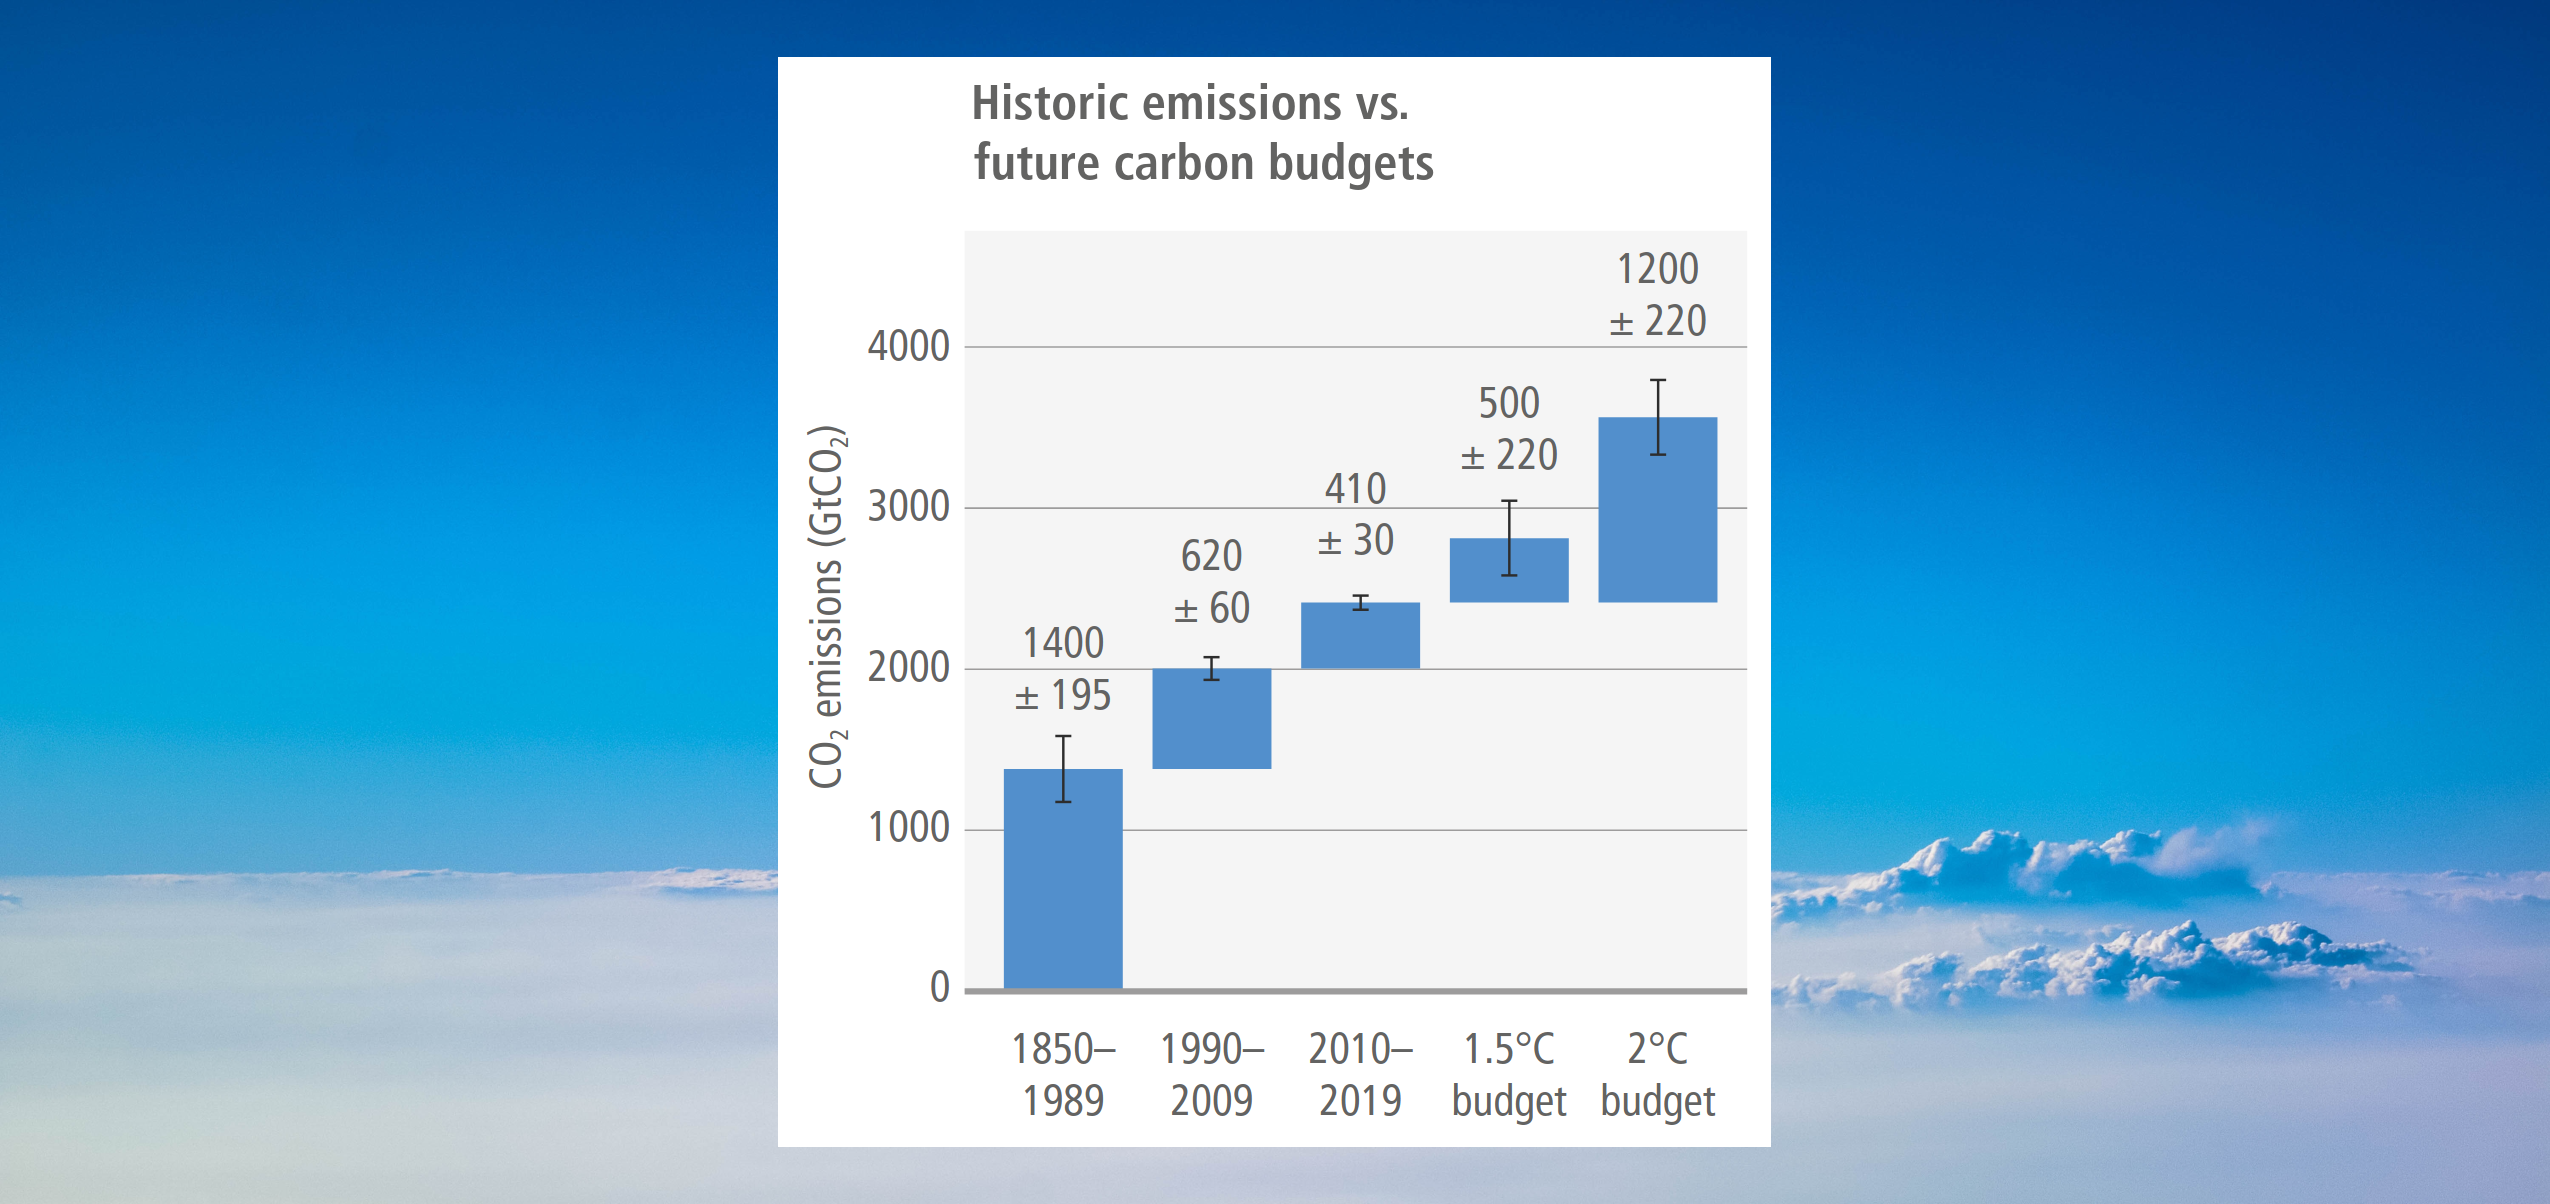
“From a physical science perspective, limiting human induced global warming to a specific level requires limiting cumulative CO2 emissions, reaching at least net zero CO2 emissions, along with strong reductions in other greenhouse gas emissions.”
Source: IPCC (2021) AR6 WGI Summary for Policymakers, D.1, pg. 27
The En-ROADS Climate Solutions Simulator makes it look easy… at first.
Climate Interactive & MIT Sloan’s En-ROADS Climate Solutions Simulator enables you to compare a wide range of potential climate solutions. It’s free and easy to use and was used to produce the En-ROADS plots below (and the early action and delayed action labels were added with free GIMP software).
Table of Contents
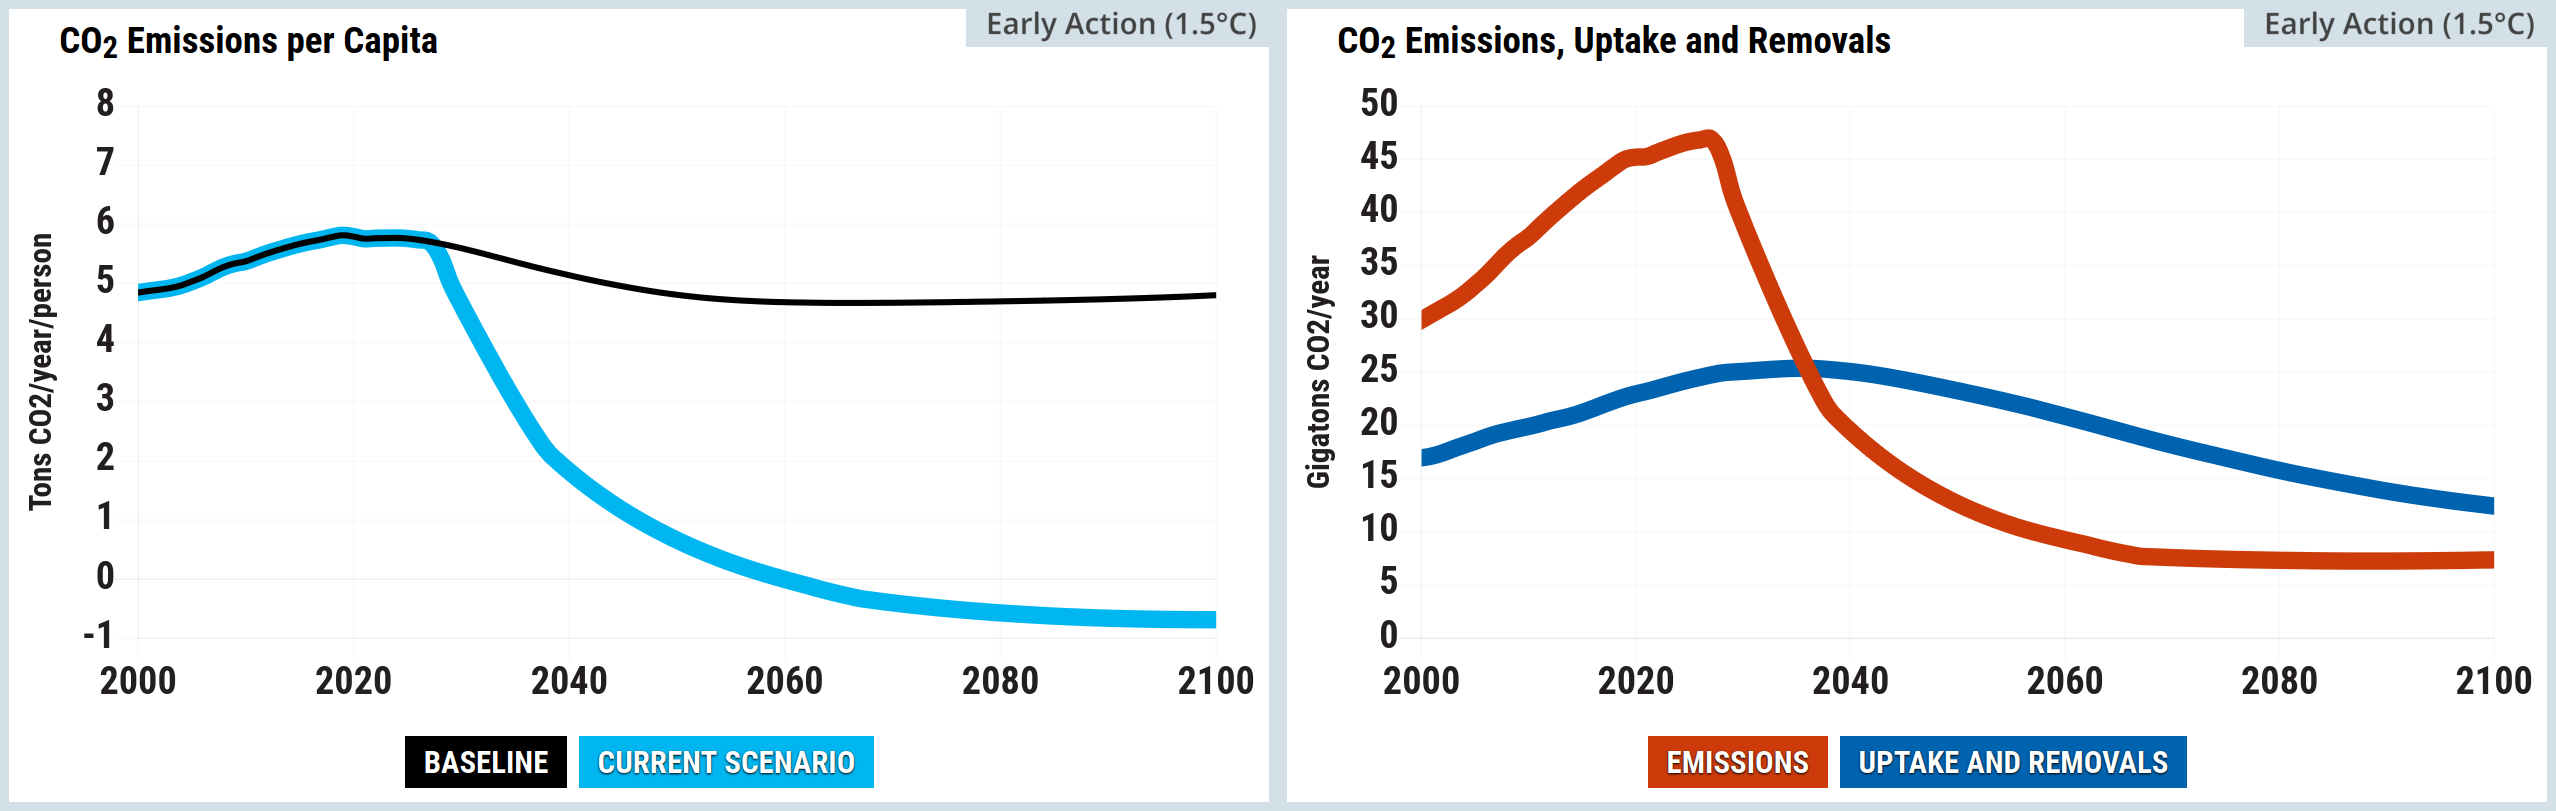
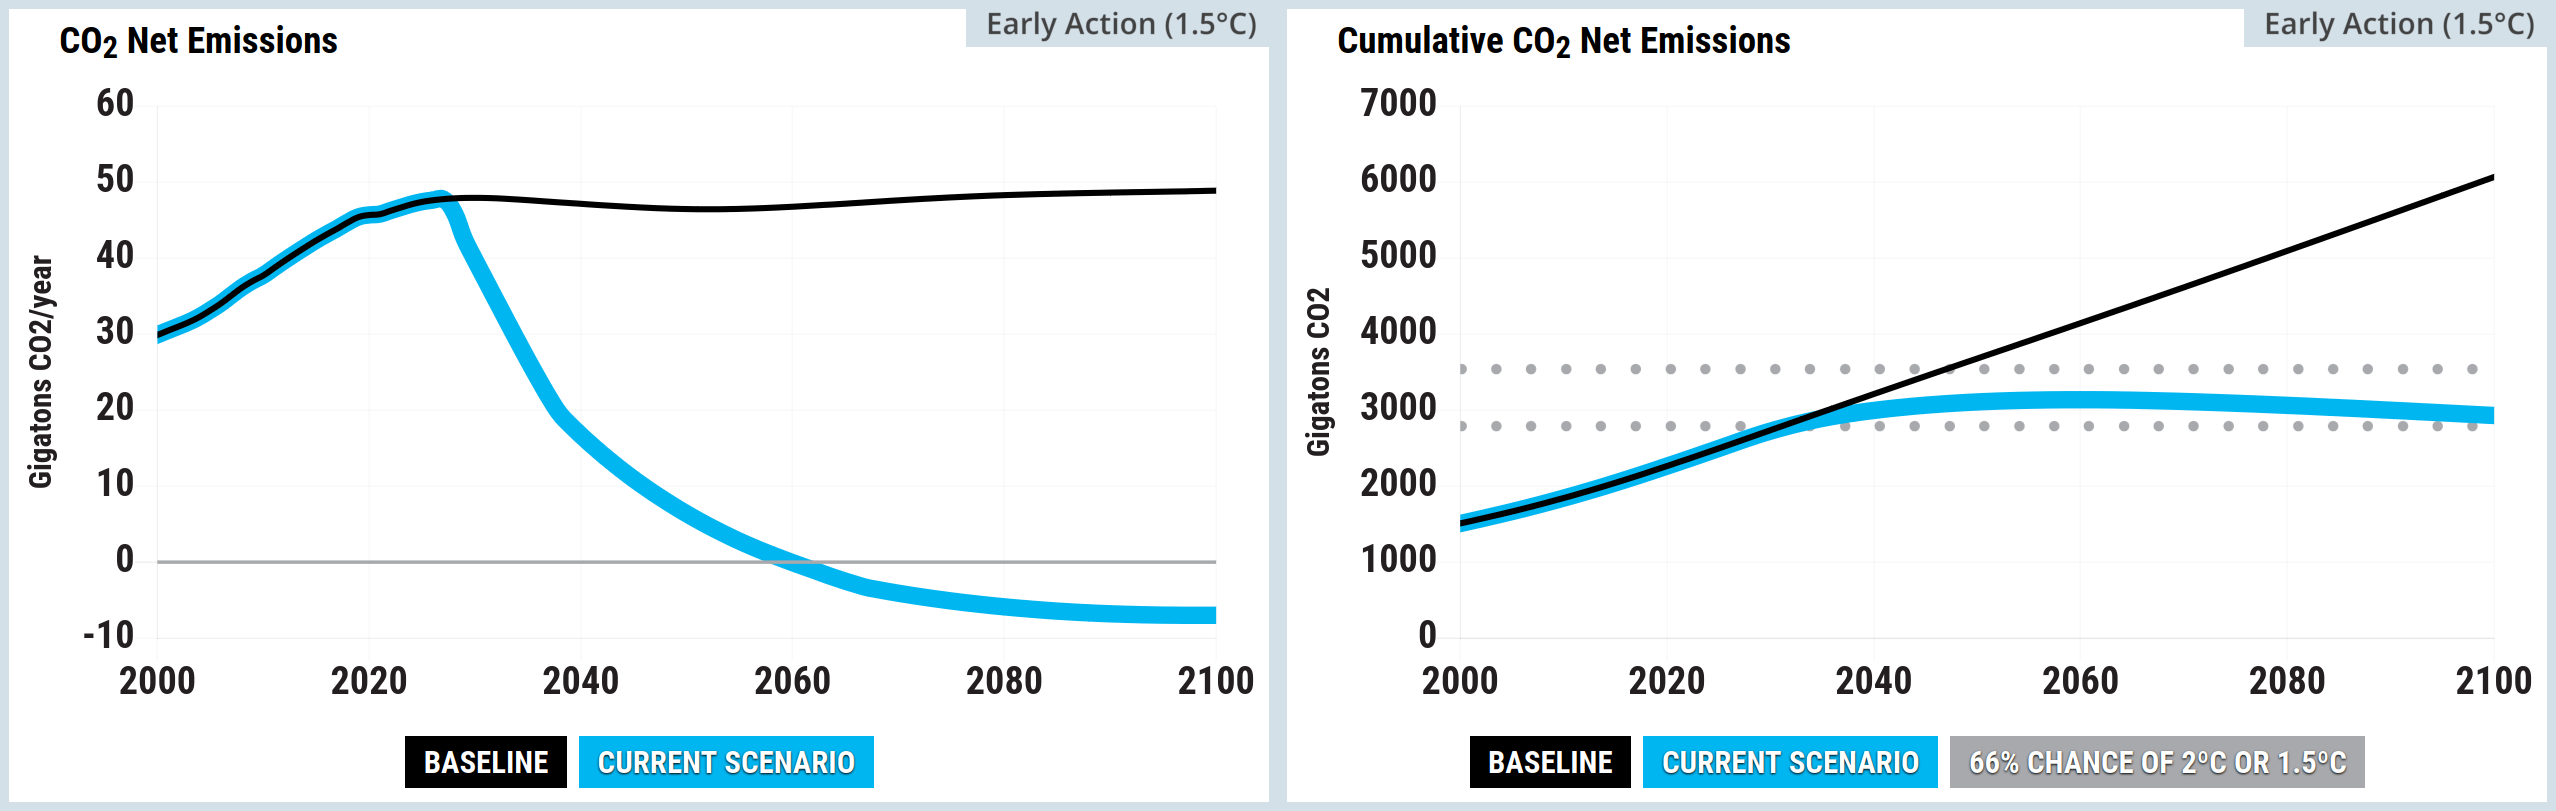
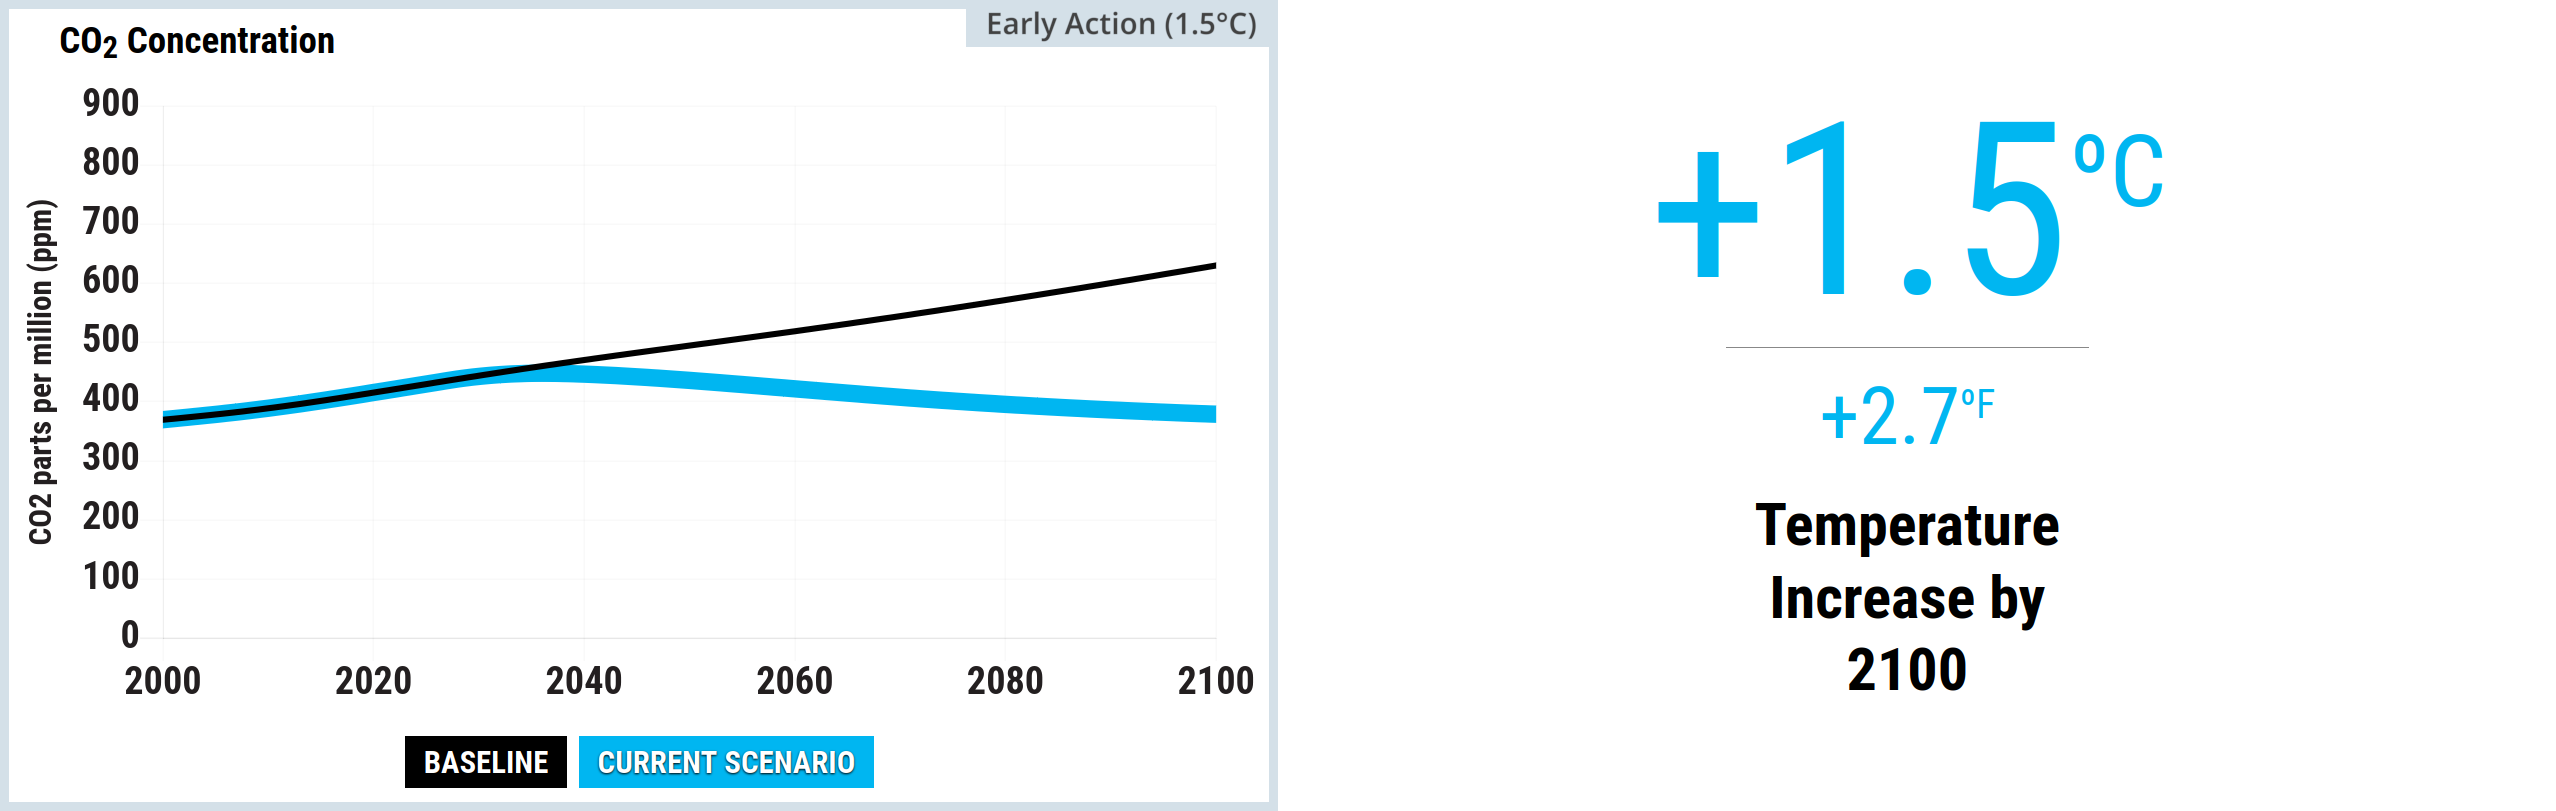
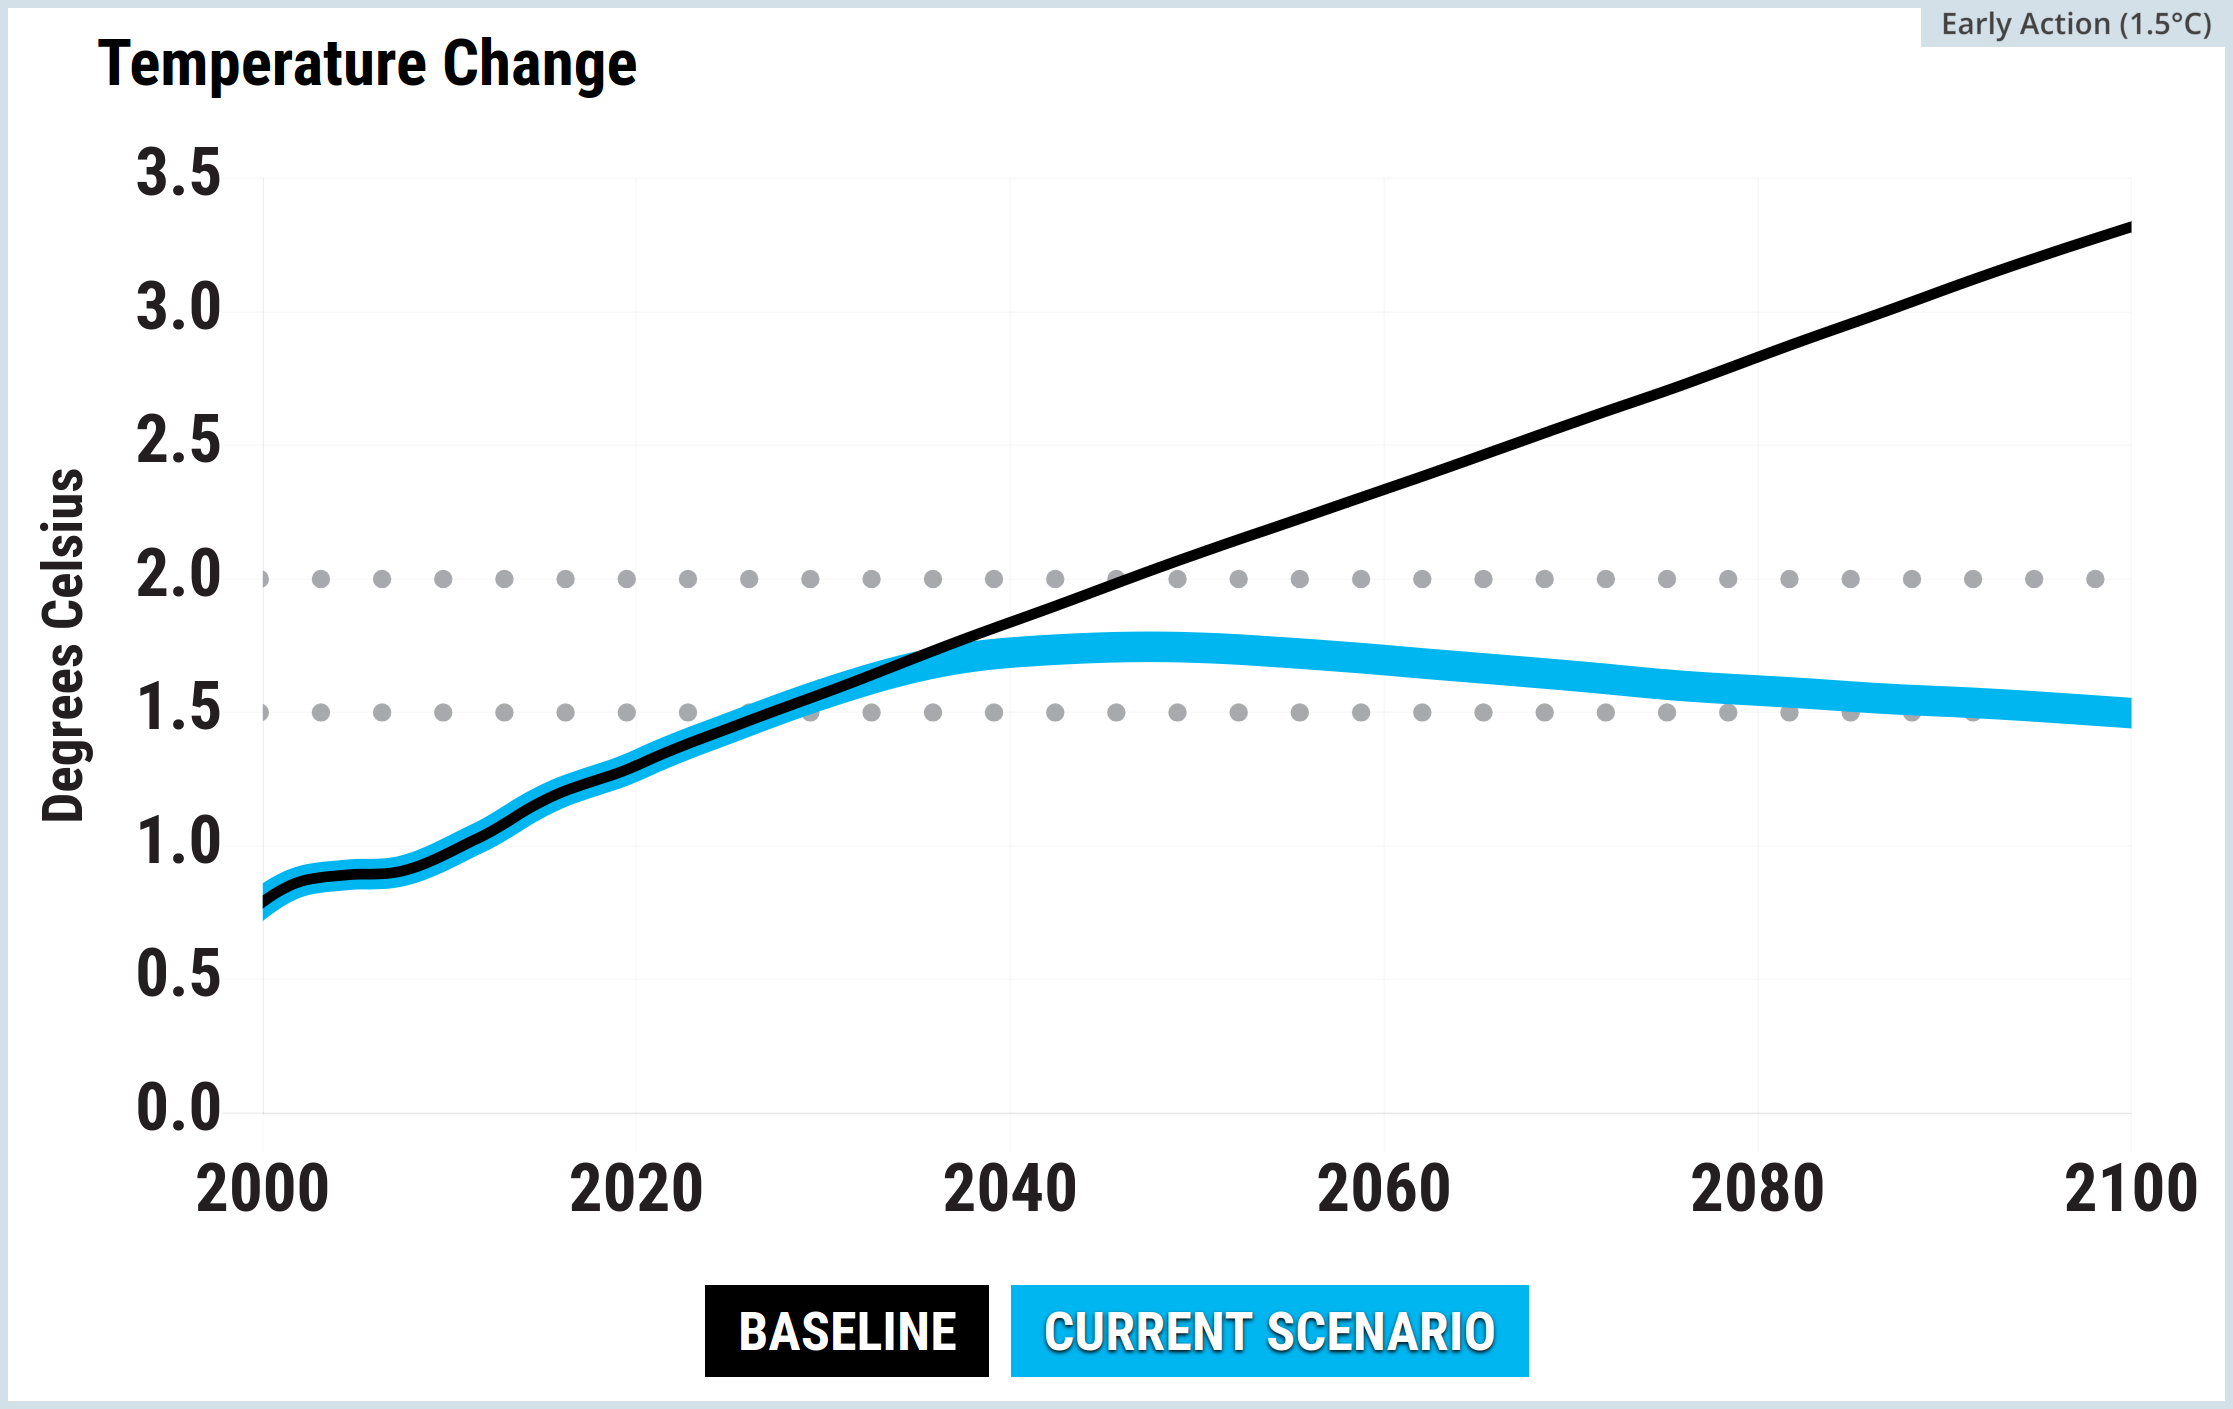
An early action scenario: 1.5°C by 2100
This section explores a single En-ROADS scenario 1.5°C by 2100. You can modify the scenario by moving the sliders on the En-ROADS Simulator settings at the link
- This is just one scenario out of a huge number of possibilities
- All of the En-ROADS plots and images below labelled “Early Action (1.5°C)” use the same settings
- Detailed settings are accessed on their website by clicking the vertical ellipsis symbol in En-ROADS settings: ⋮
- Some detailed settings were modified, and these are summarised in the Actions and Outcomes screenshot at the end of this section
- The default assumptions were left unchanged
- Version 26.8.0 of Climate Interactive & MIT Sloan (2026) En-ROADS Simulator was used
For this scenario:
- CH4 concentration peaks in 2030
- Atmospheric GHG concentration peaks in 2036 and atmospheric CO2 concentration also peaks in 2036
- Net GHG emissions (anthropogenic) reach zero in 2083 and net CO2 emissions (anthropogenic) reach zero in 2060
- The global surface air temperature (GSAT) peaks in 2047 at 1.75°C, reducing to 1.50°C by 2100
- The temperature peak (in 2047) lags the CO2 concentration peak (in 2036) by eleven years
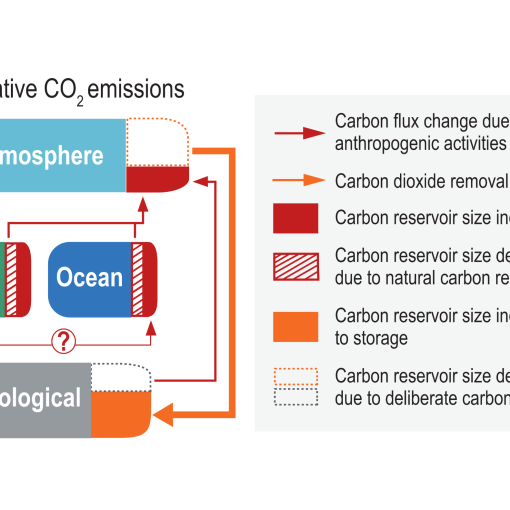
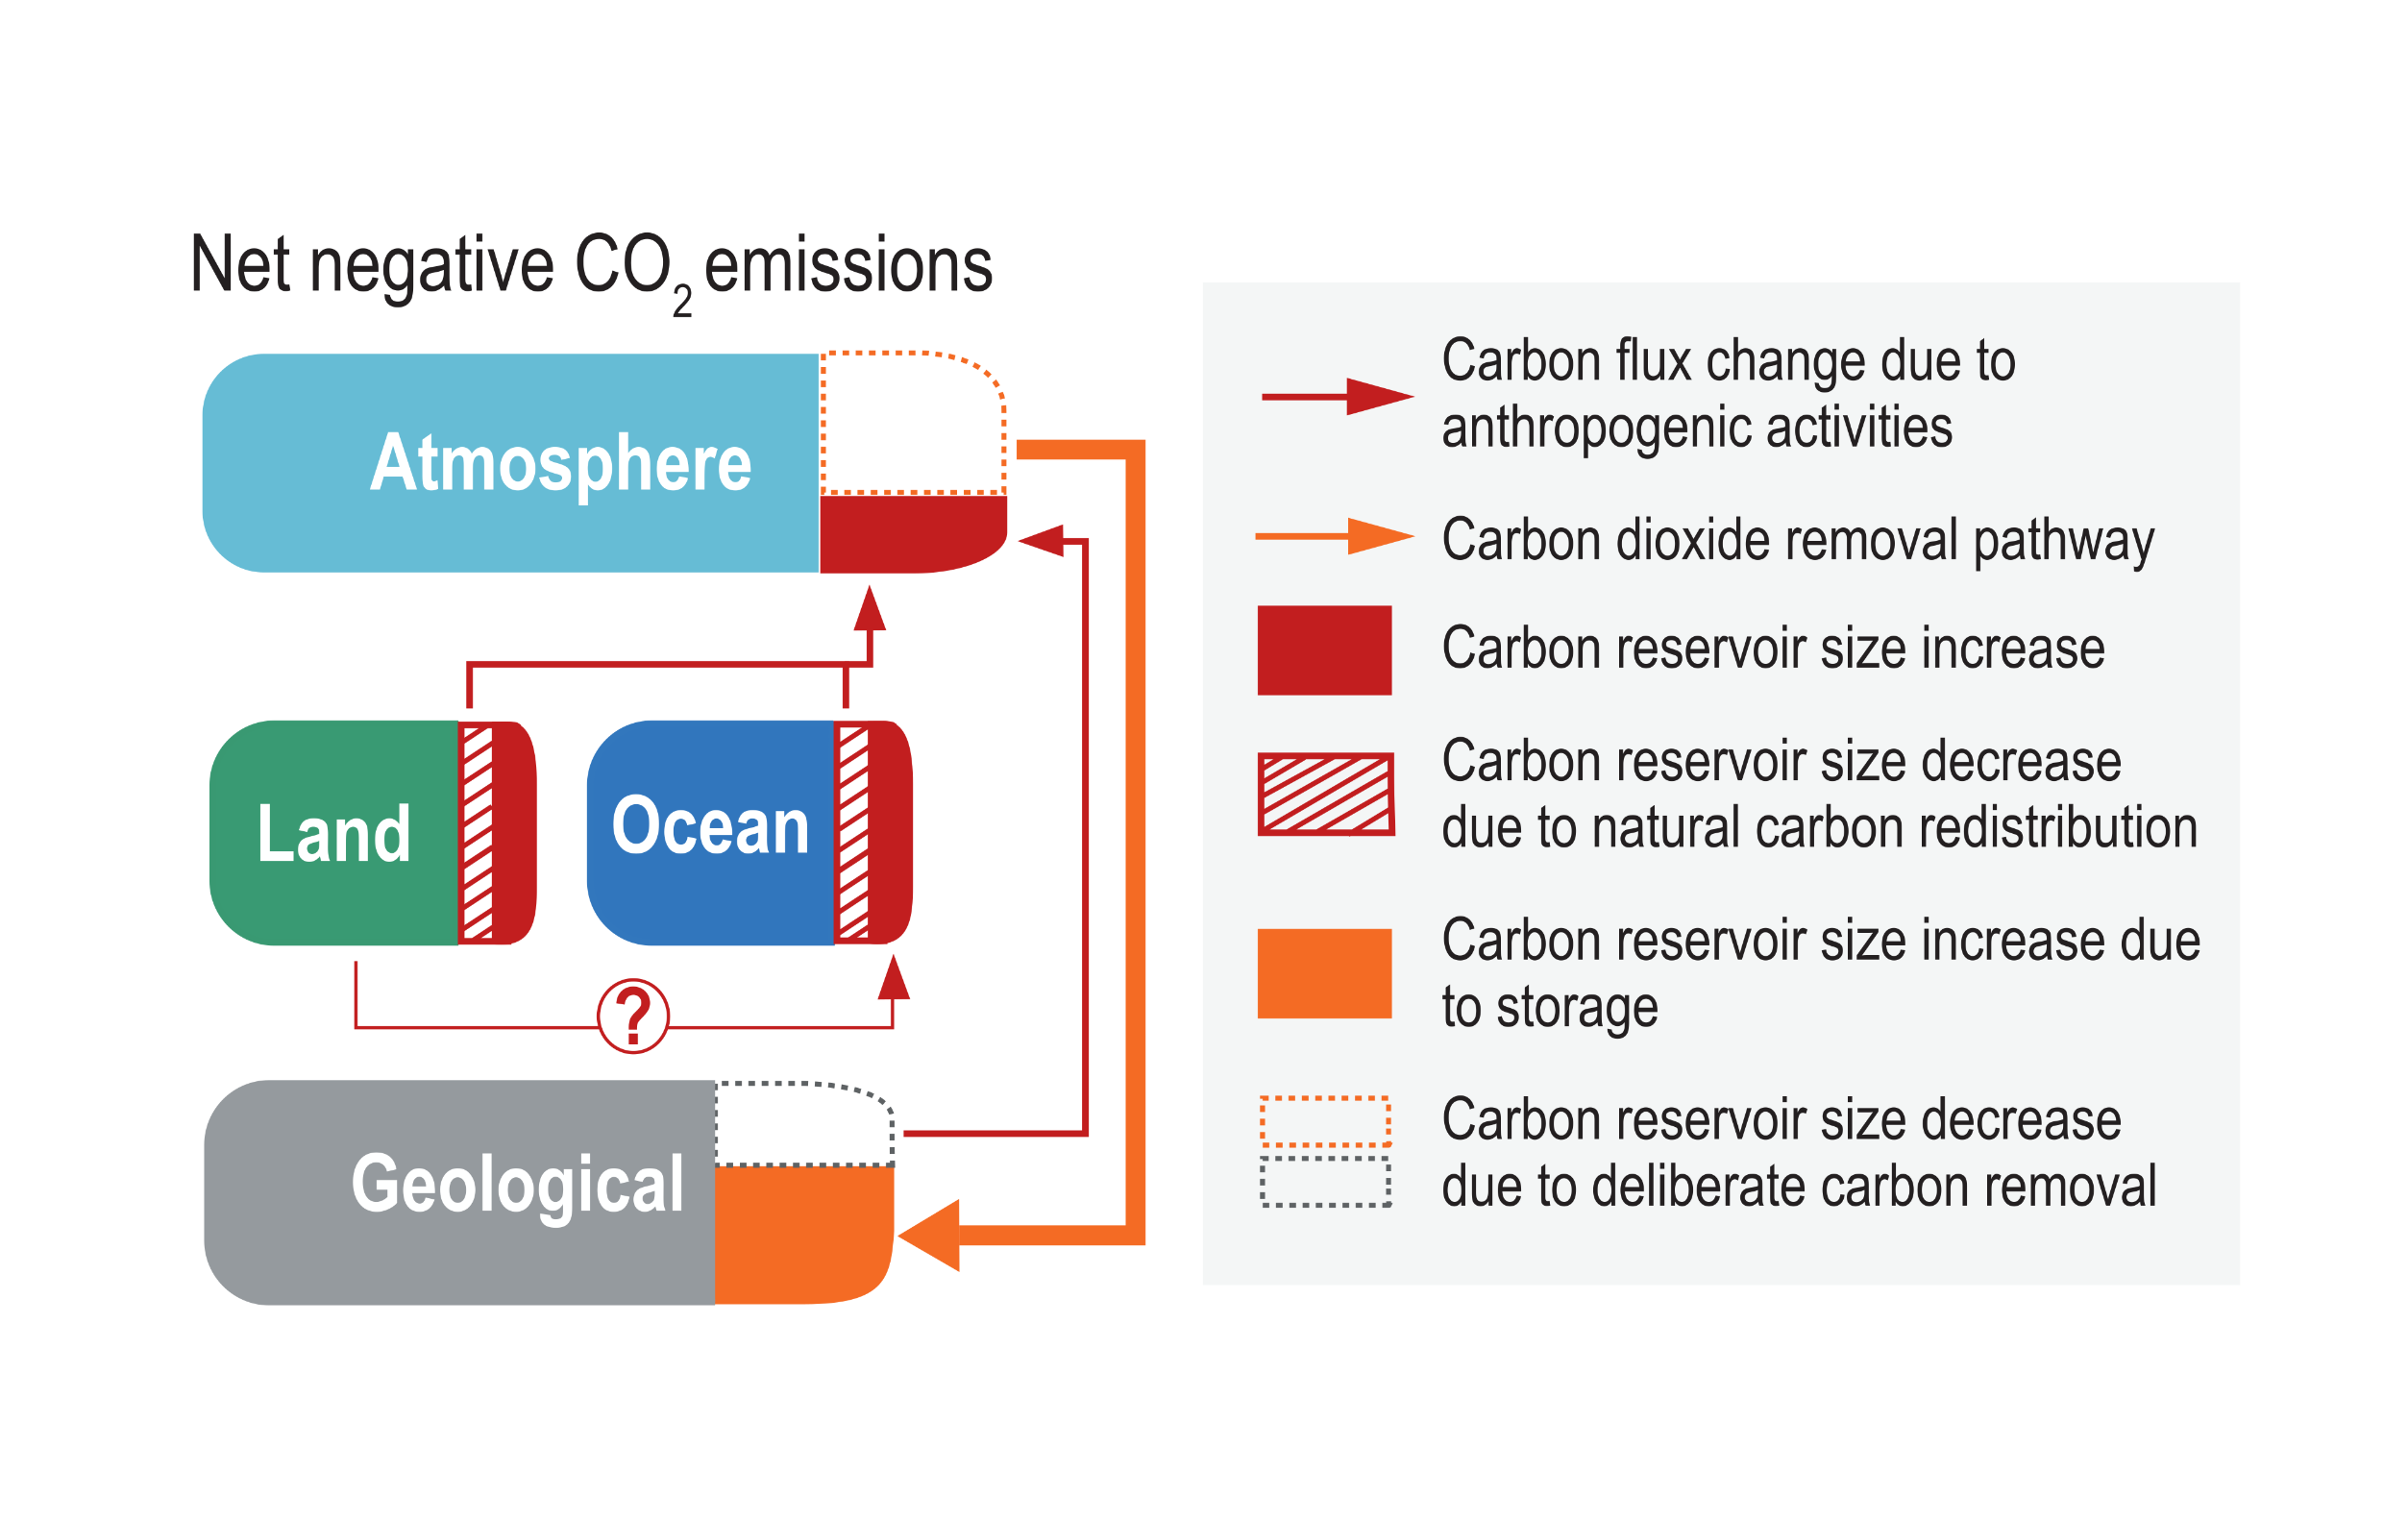
Net-zero CO2 emissions: “Condition in which anthropogenic carbon dioxide (CO2) emissions are balanced by anthropogenic CO2 removals over a specified period.”
Source: IPCC (2022) AR6 WGIII Annex I, Glossary, pg. 1809
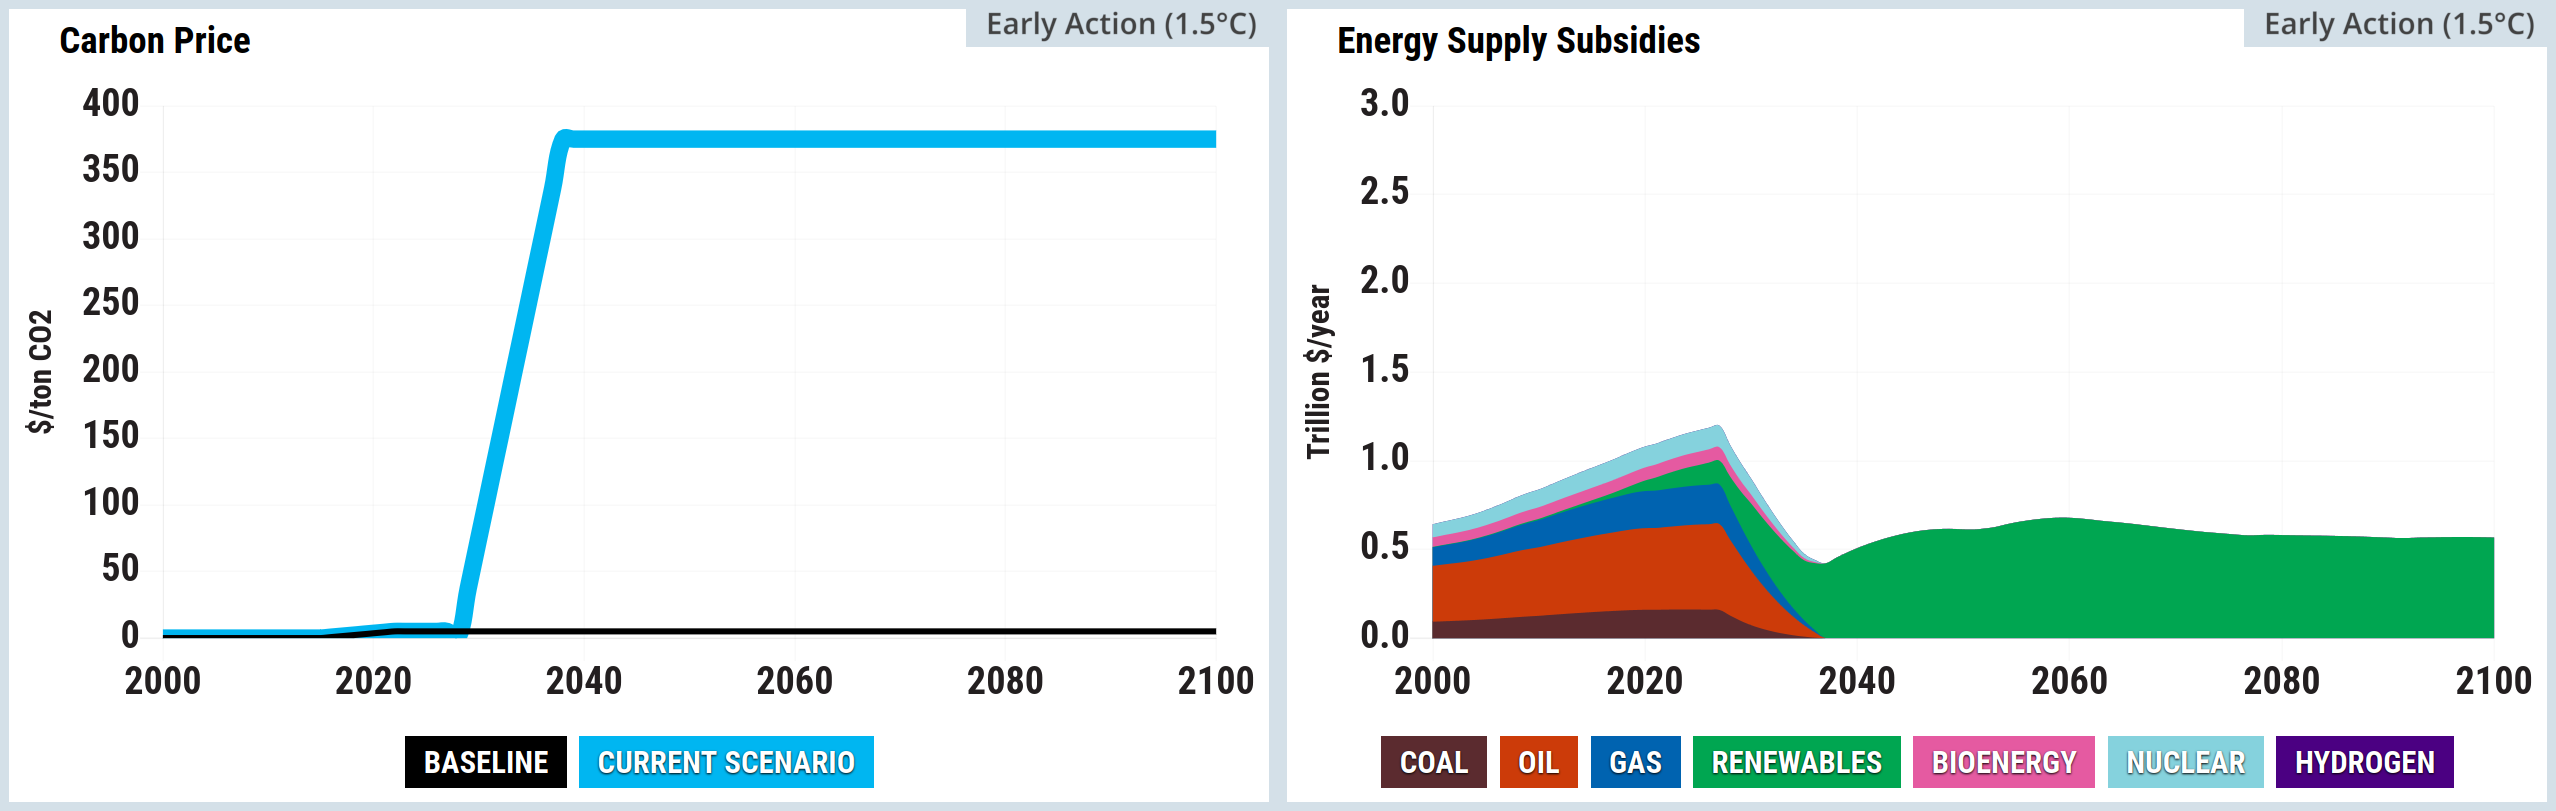
Source: Climate Interactive & MIT Sloan (2026) En-ROADS Simulator (Version 26.8.0)
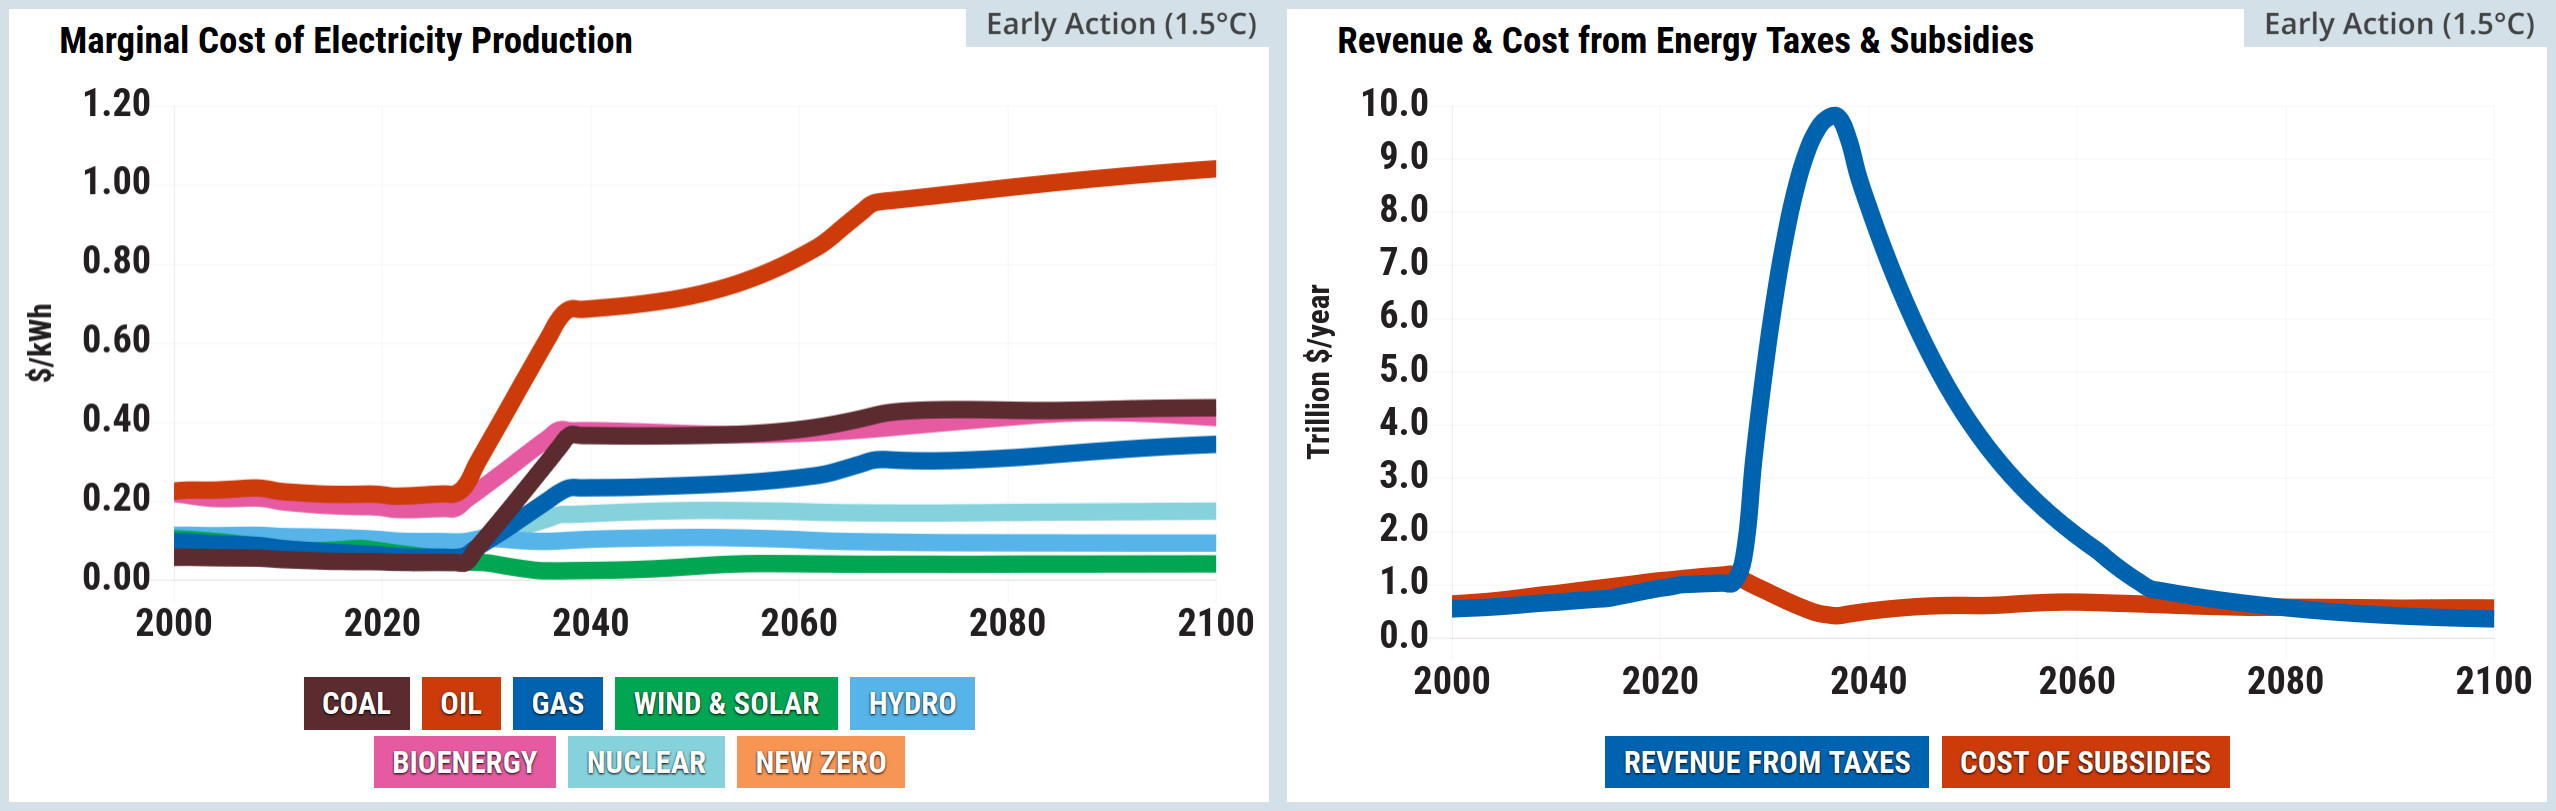
Source: Climate Interactive & MIT Sloan (2026) En-ROADS Simulator (Version 26.8.0)
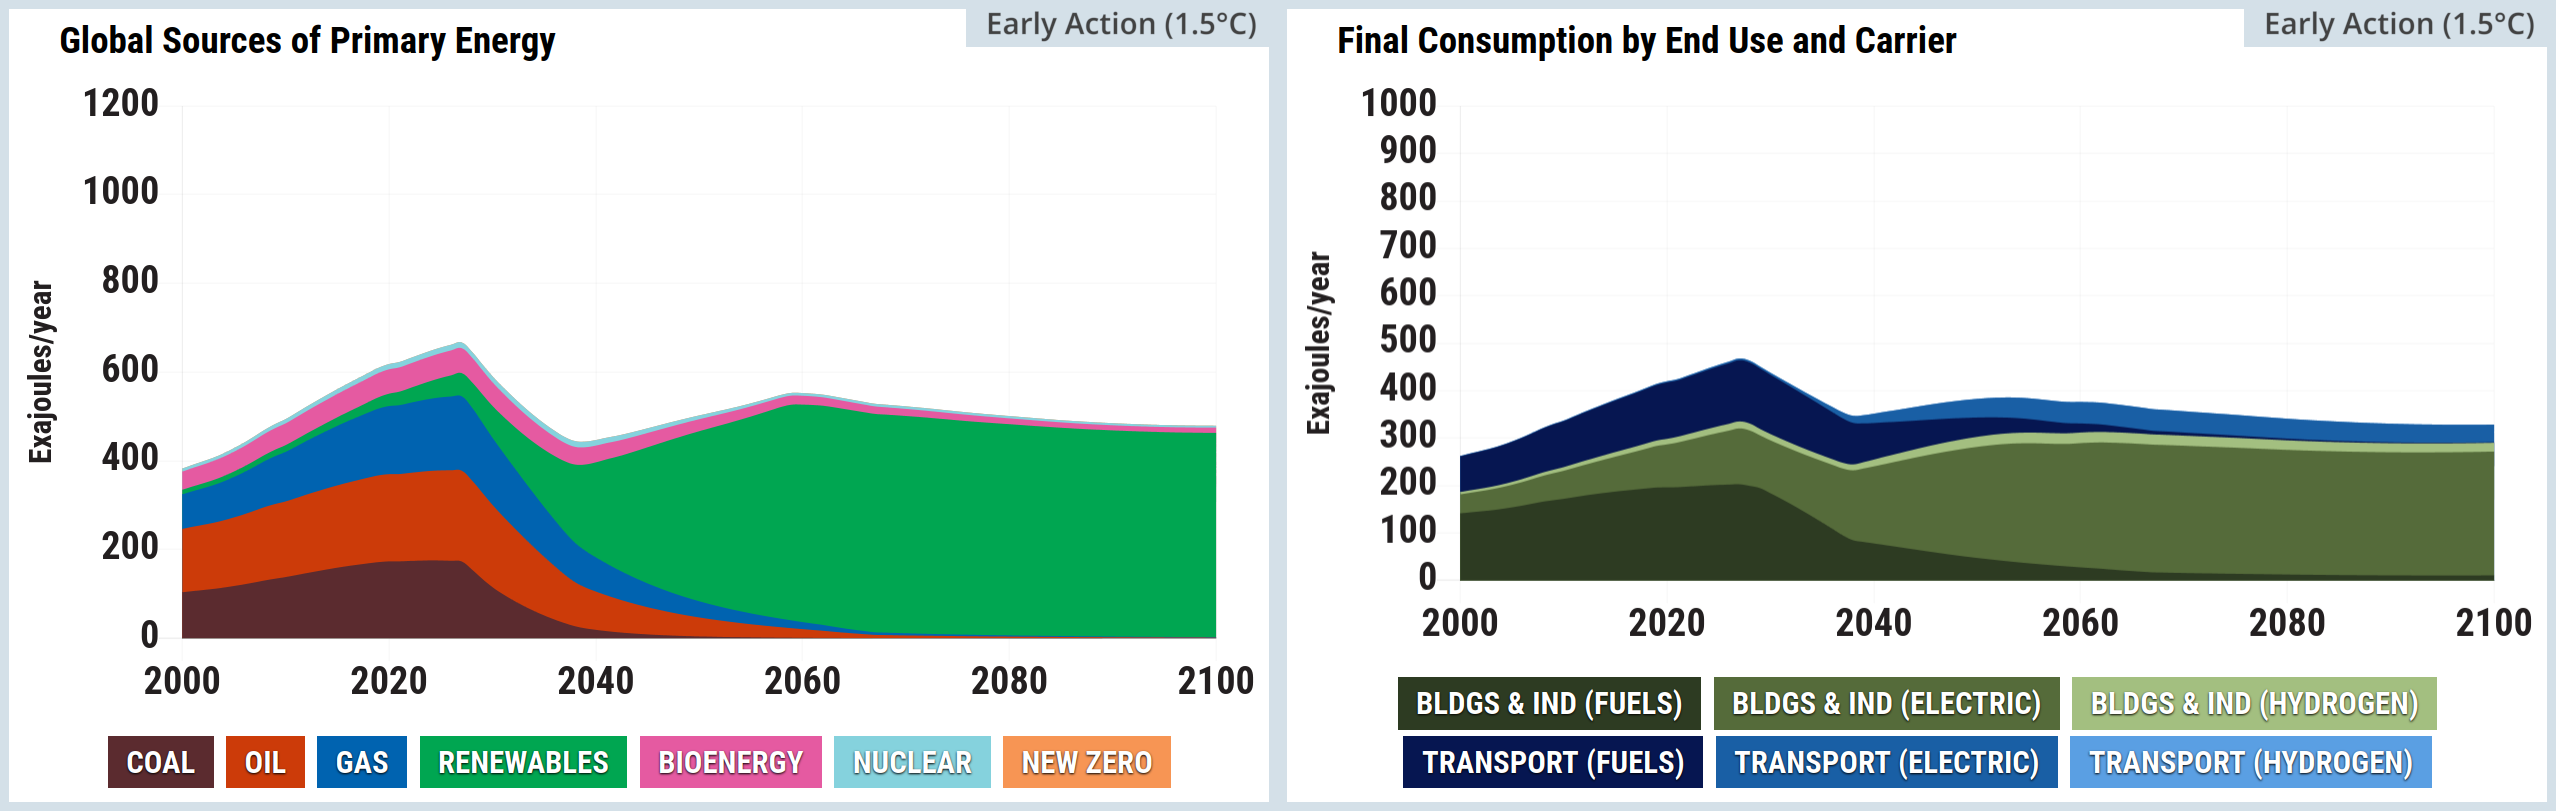
Source: Climate Interactive & MIT Sloan (2026) En-ROADS Simulator (Version 26.8.0)
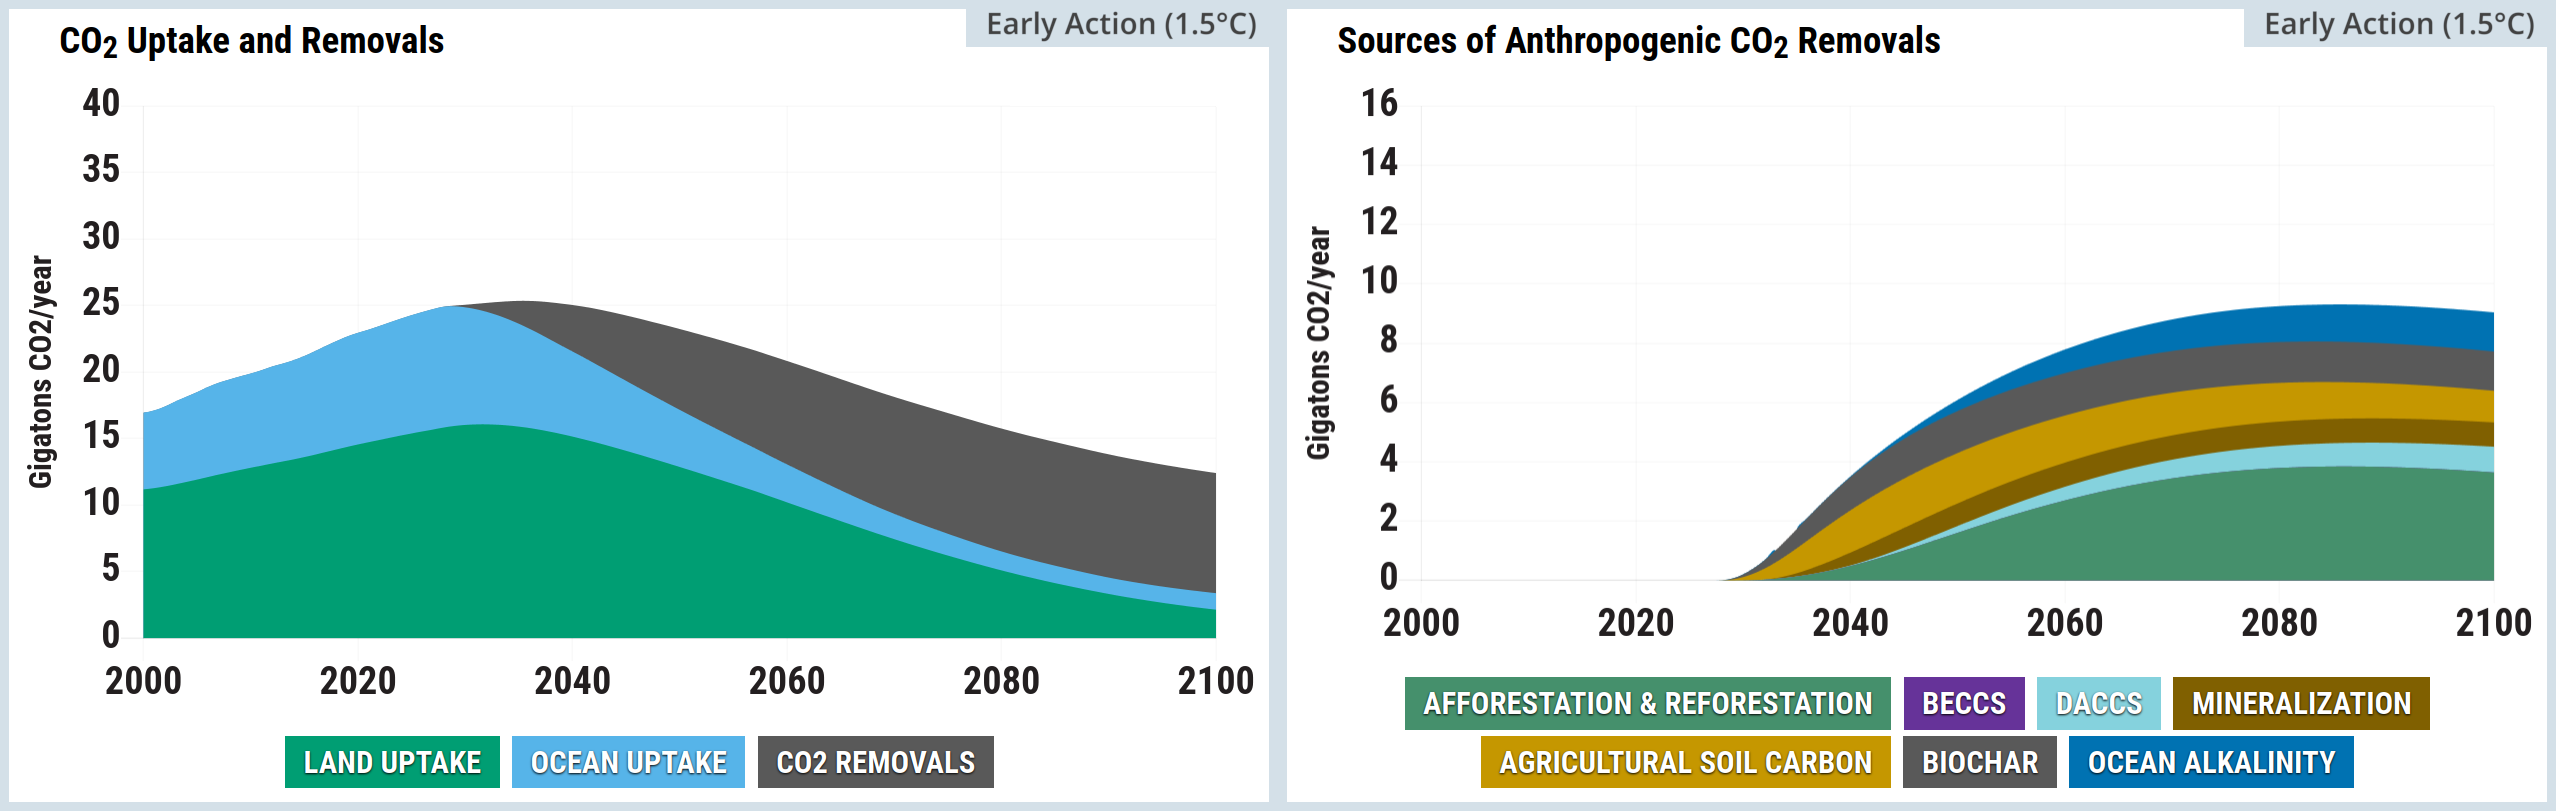
Source: Climate Interactive & MIT Sloan (2026) En-ROADS Simulator (Version 26.8.0)
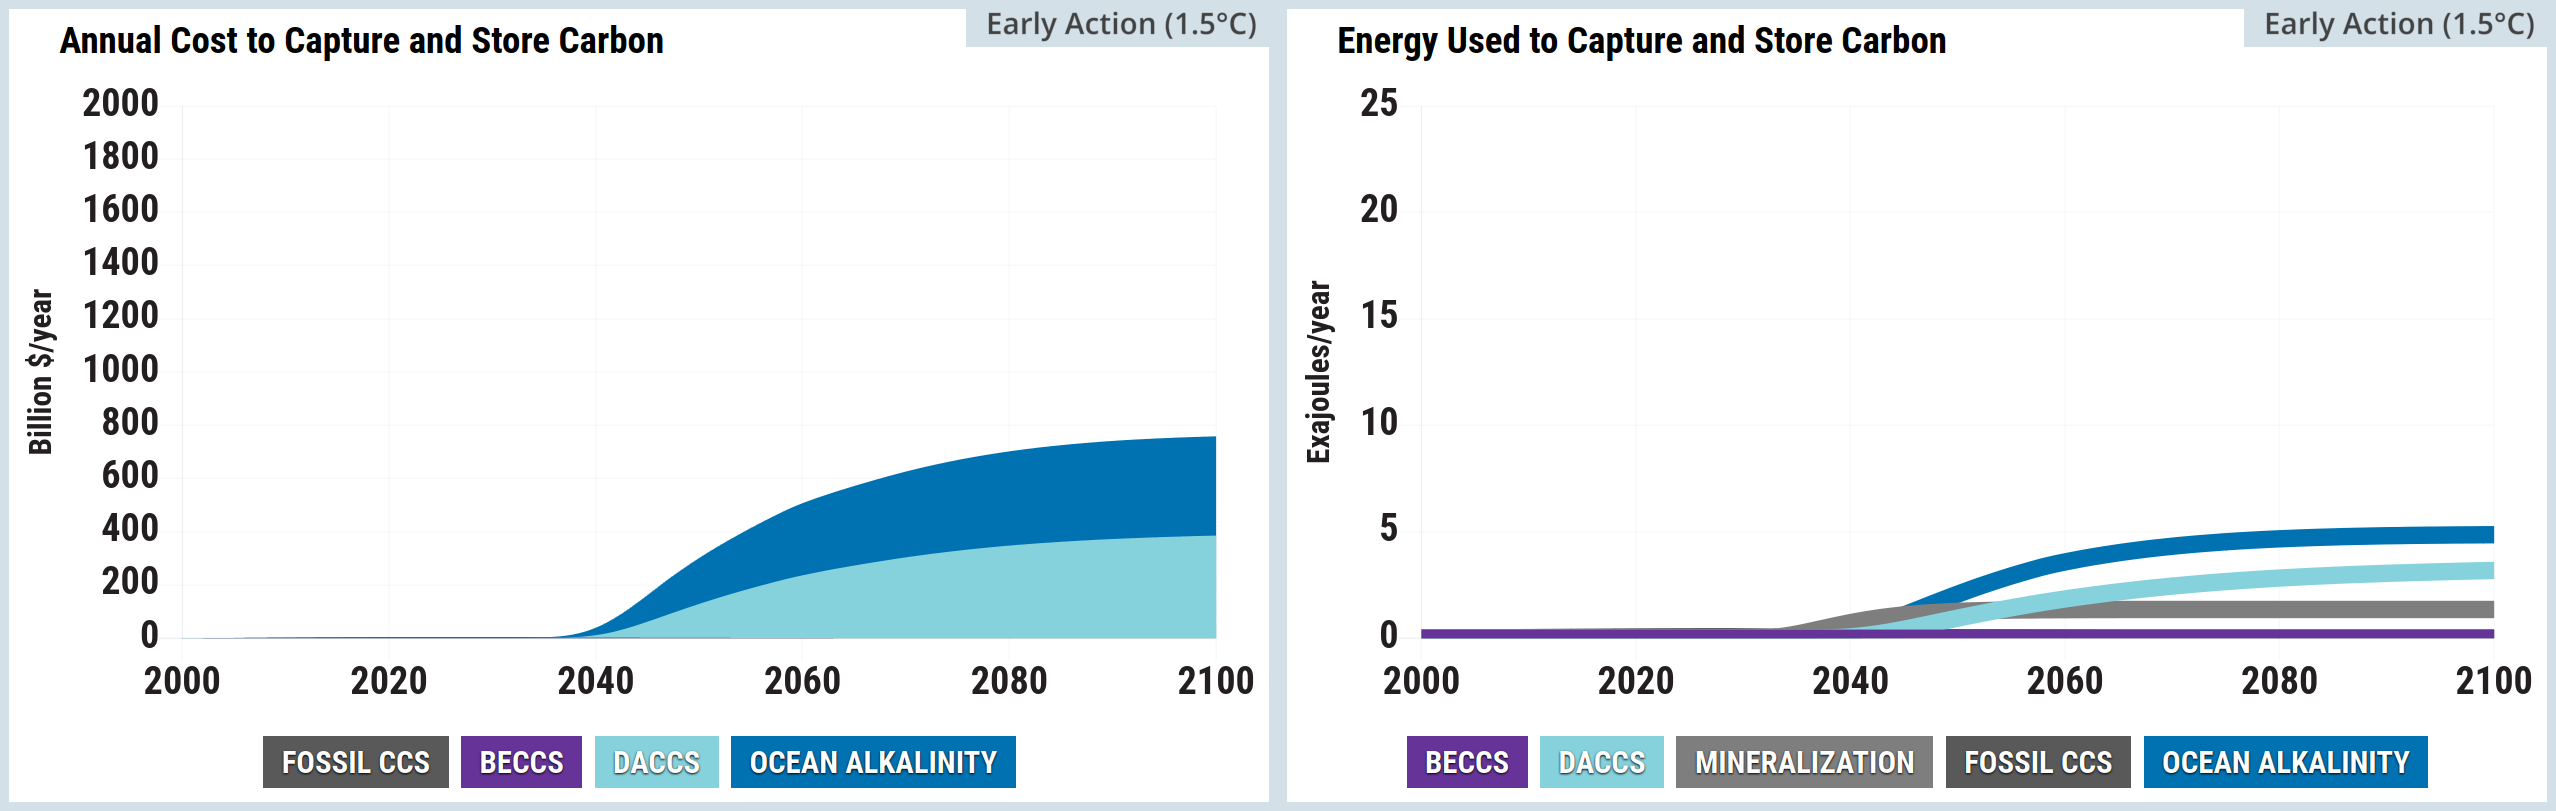
Source: Climate Interactive & MIT Sloan (2026) En-ROADS Simulator (Version 26.8.0)
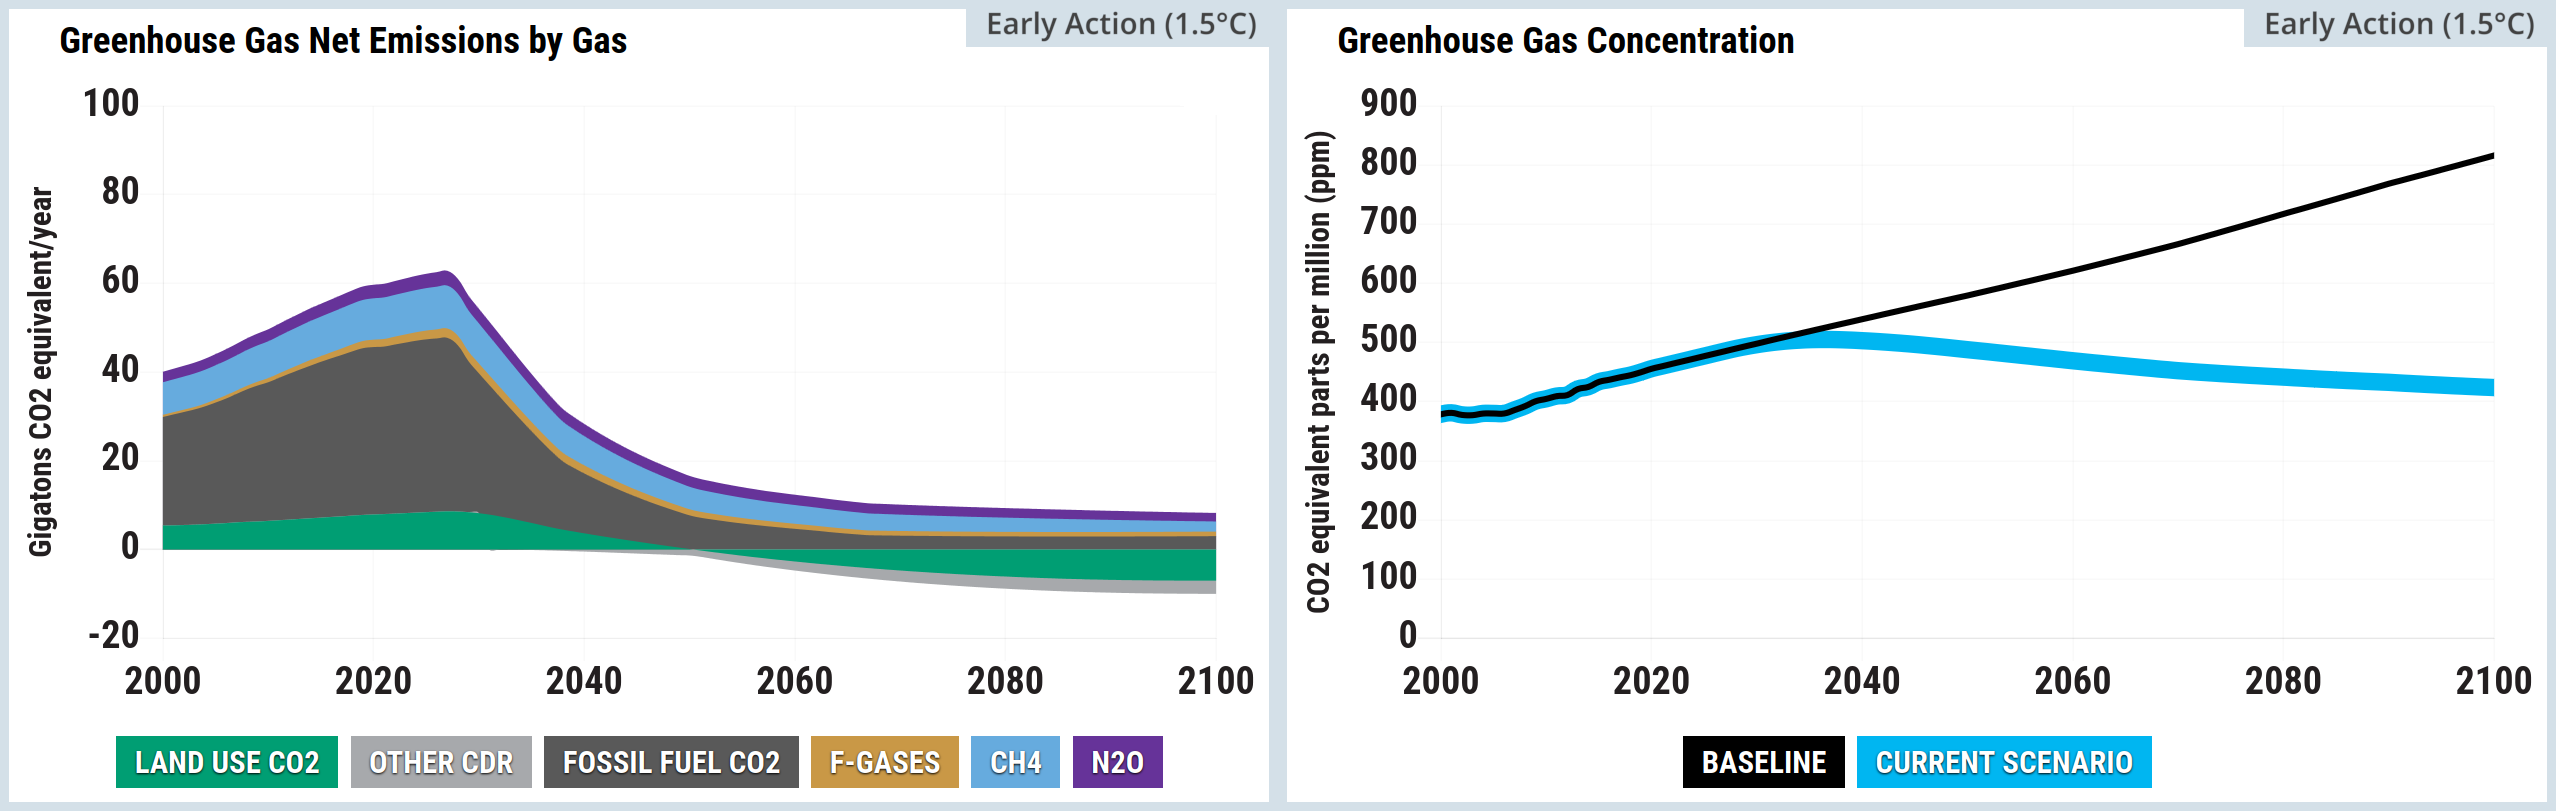
Source: Climate Interactive & MIT Sloan (2026) En-ROADS Simulator (Version 26.8.0)
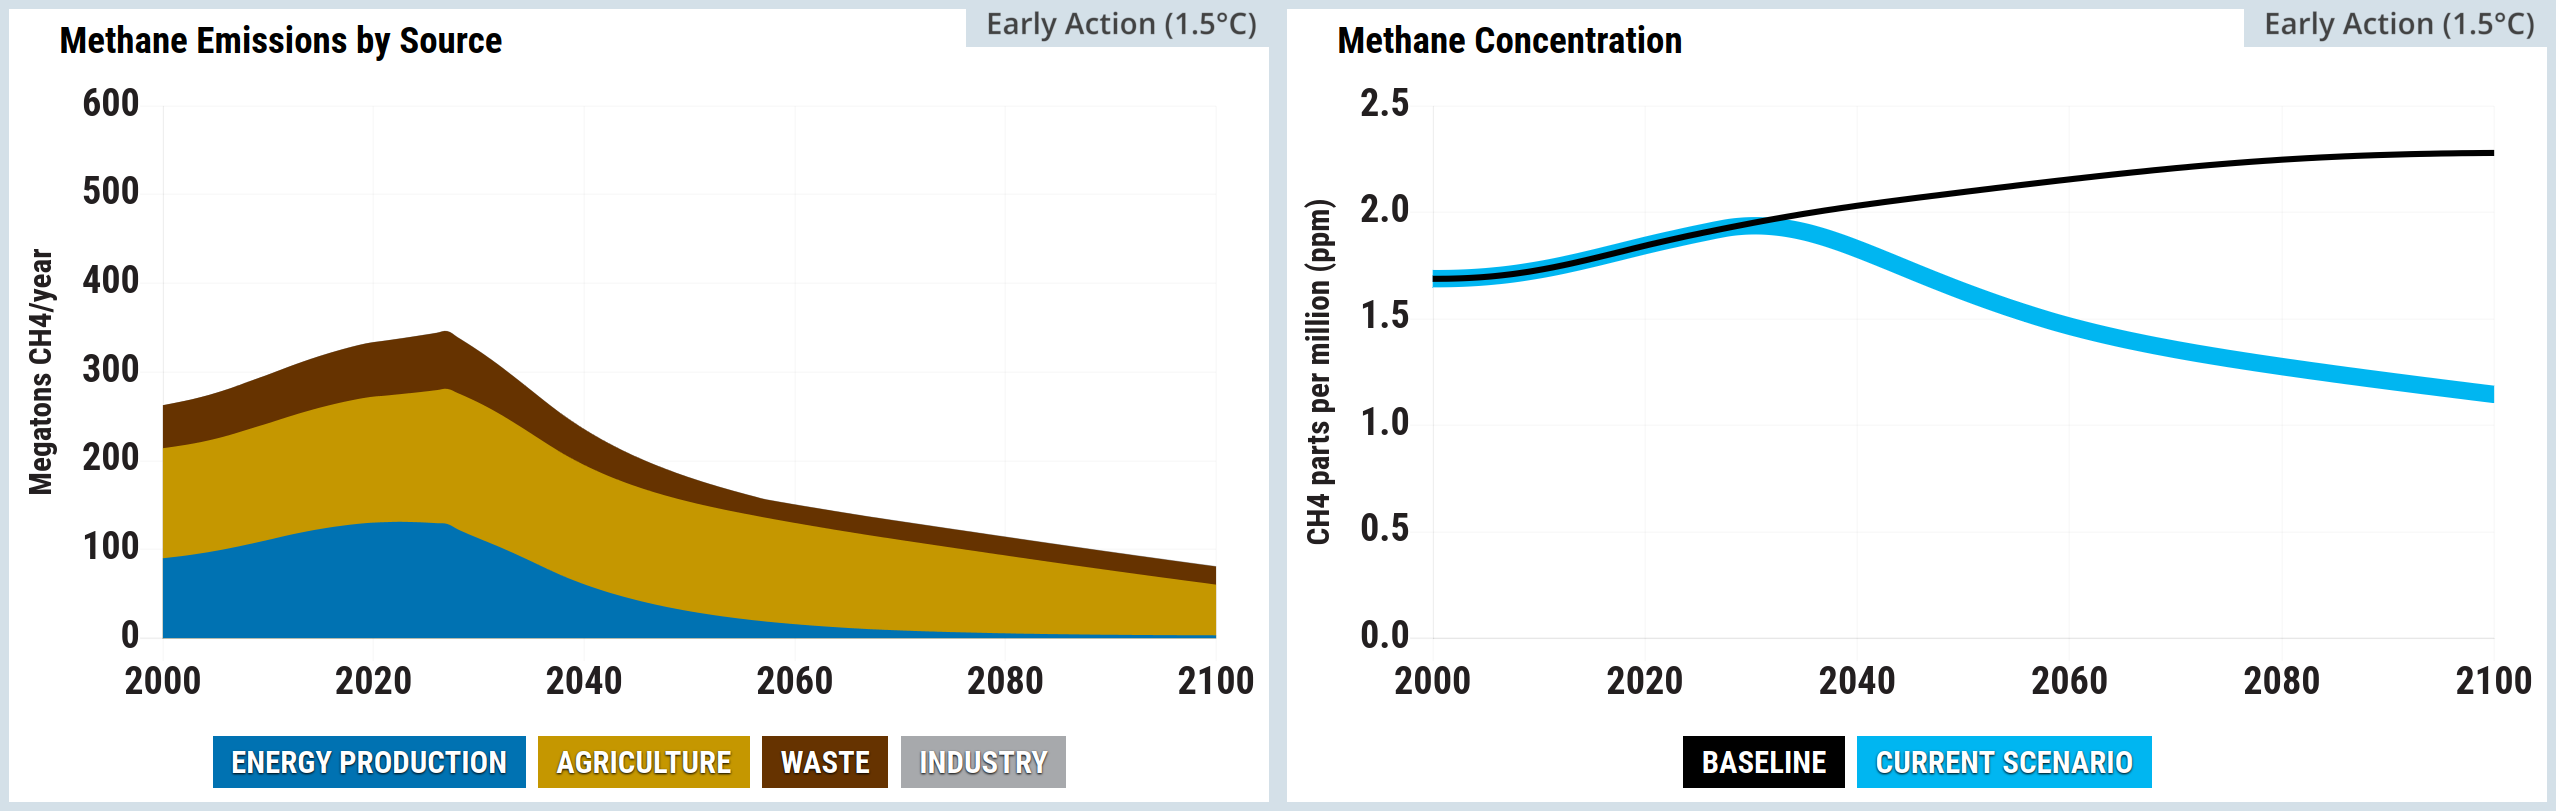
Source: Climate Interactive & MIT Sloan (2026) En-ROADS Simulator (Version 26.8.0)
Source: Climate Interactive & MIT Sloan (2026) En-ROADS Simulator (Version 26.8.0)
Source: Climate Interactive & MIT Sloan (2026) En-ROADS Simulator (Version 26.8.0)
Source: Climate Interactive & MIT Sloan (2026) En-ROADS Simulator (Version 26.8.0)
Source: Climate Interactive & MIT Sloan (2026) En-ROADS Simulator (Version 26.8.0)
Kaya graphs
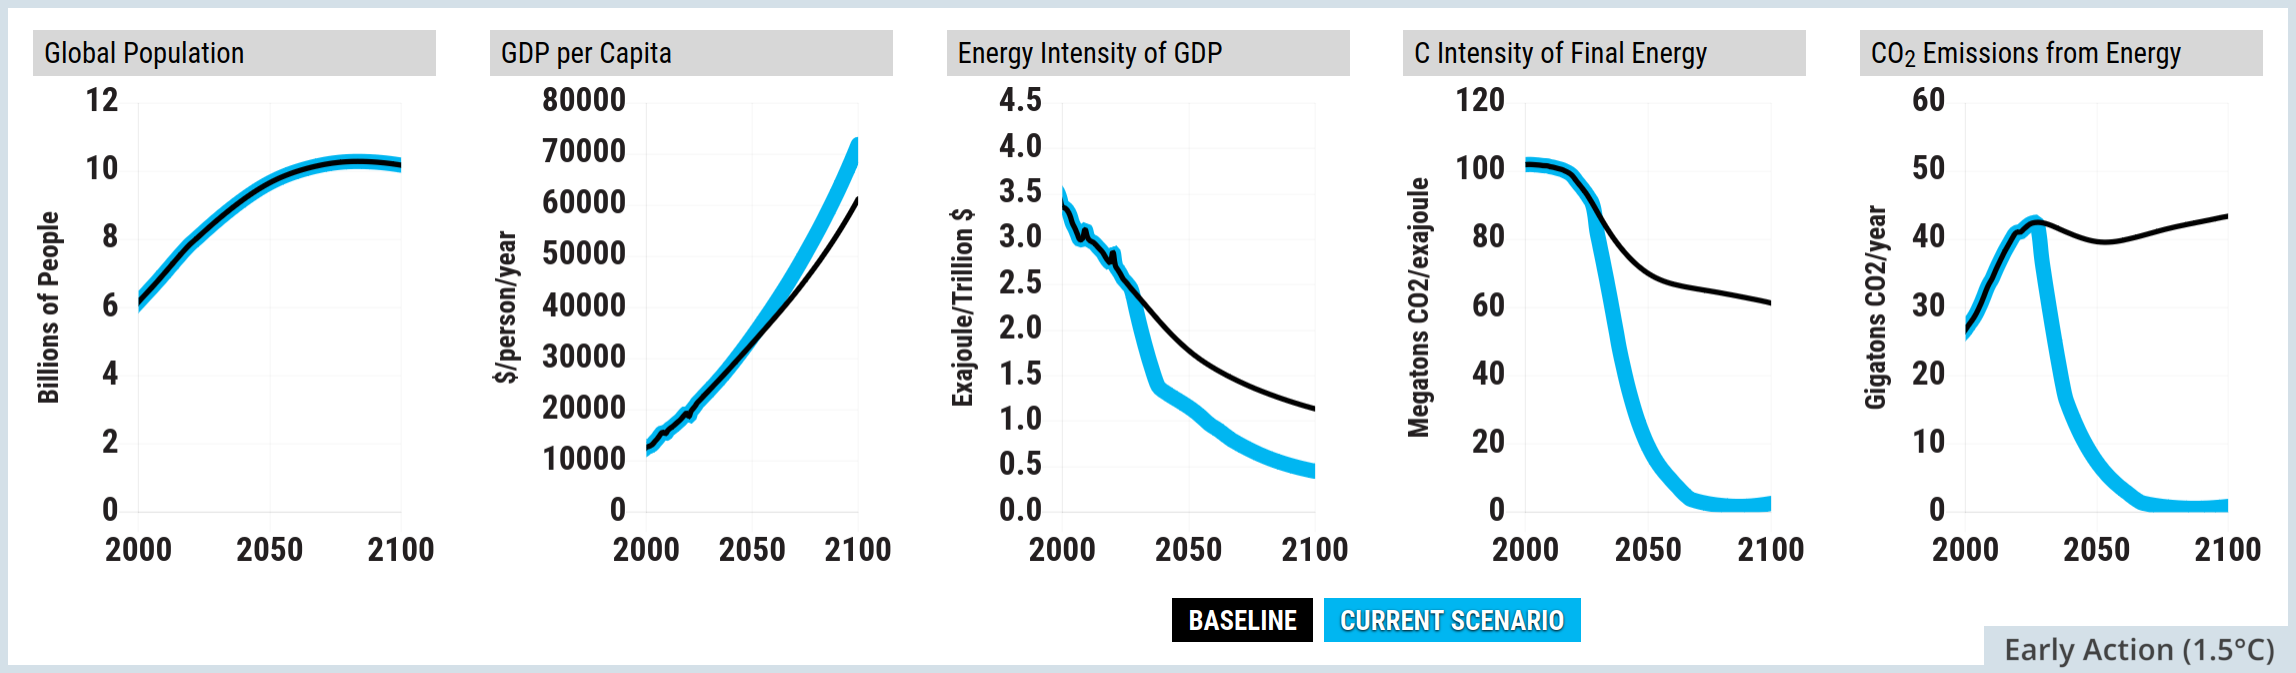
Source: Climate Interactive & MIT Sloan (2026) En-ROADS Simulator (Version 26.8.0)
En-ROADS settings for the 1.5°C by 2100 scenario
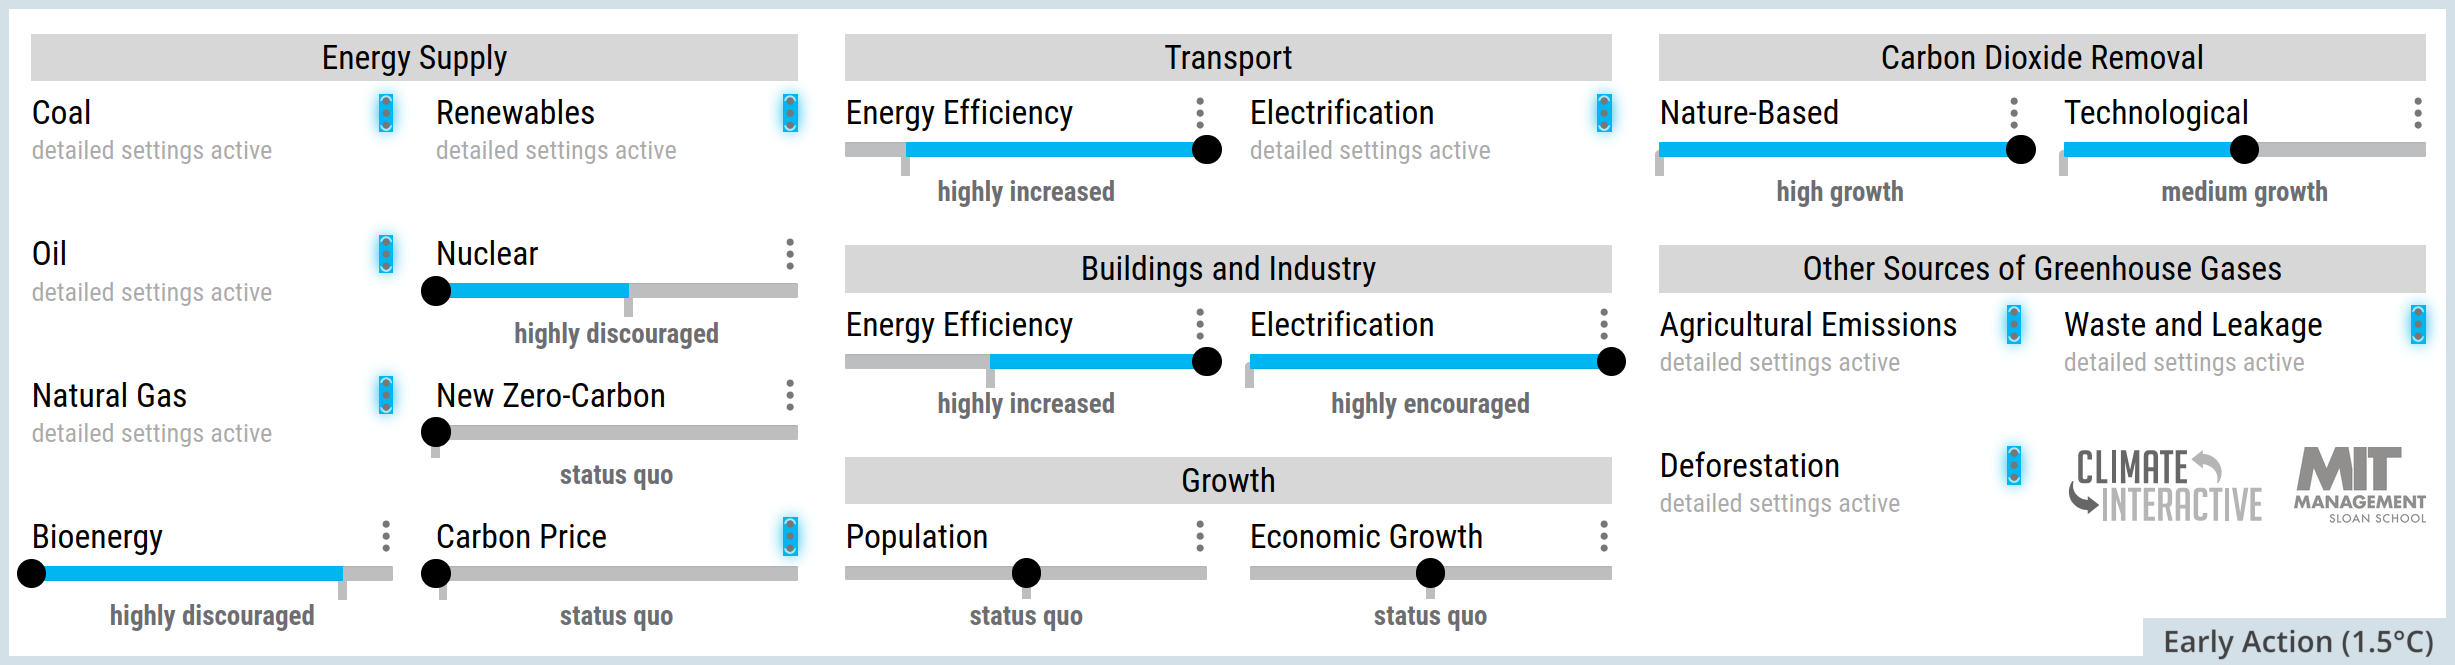
Source: Climate Interactive & MIT Sloan (2026) En-ROADS Simulator (Version 26.8.0)
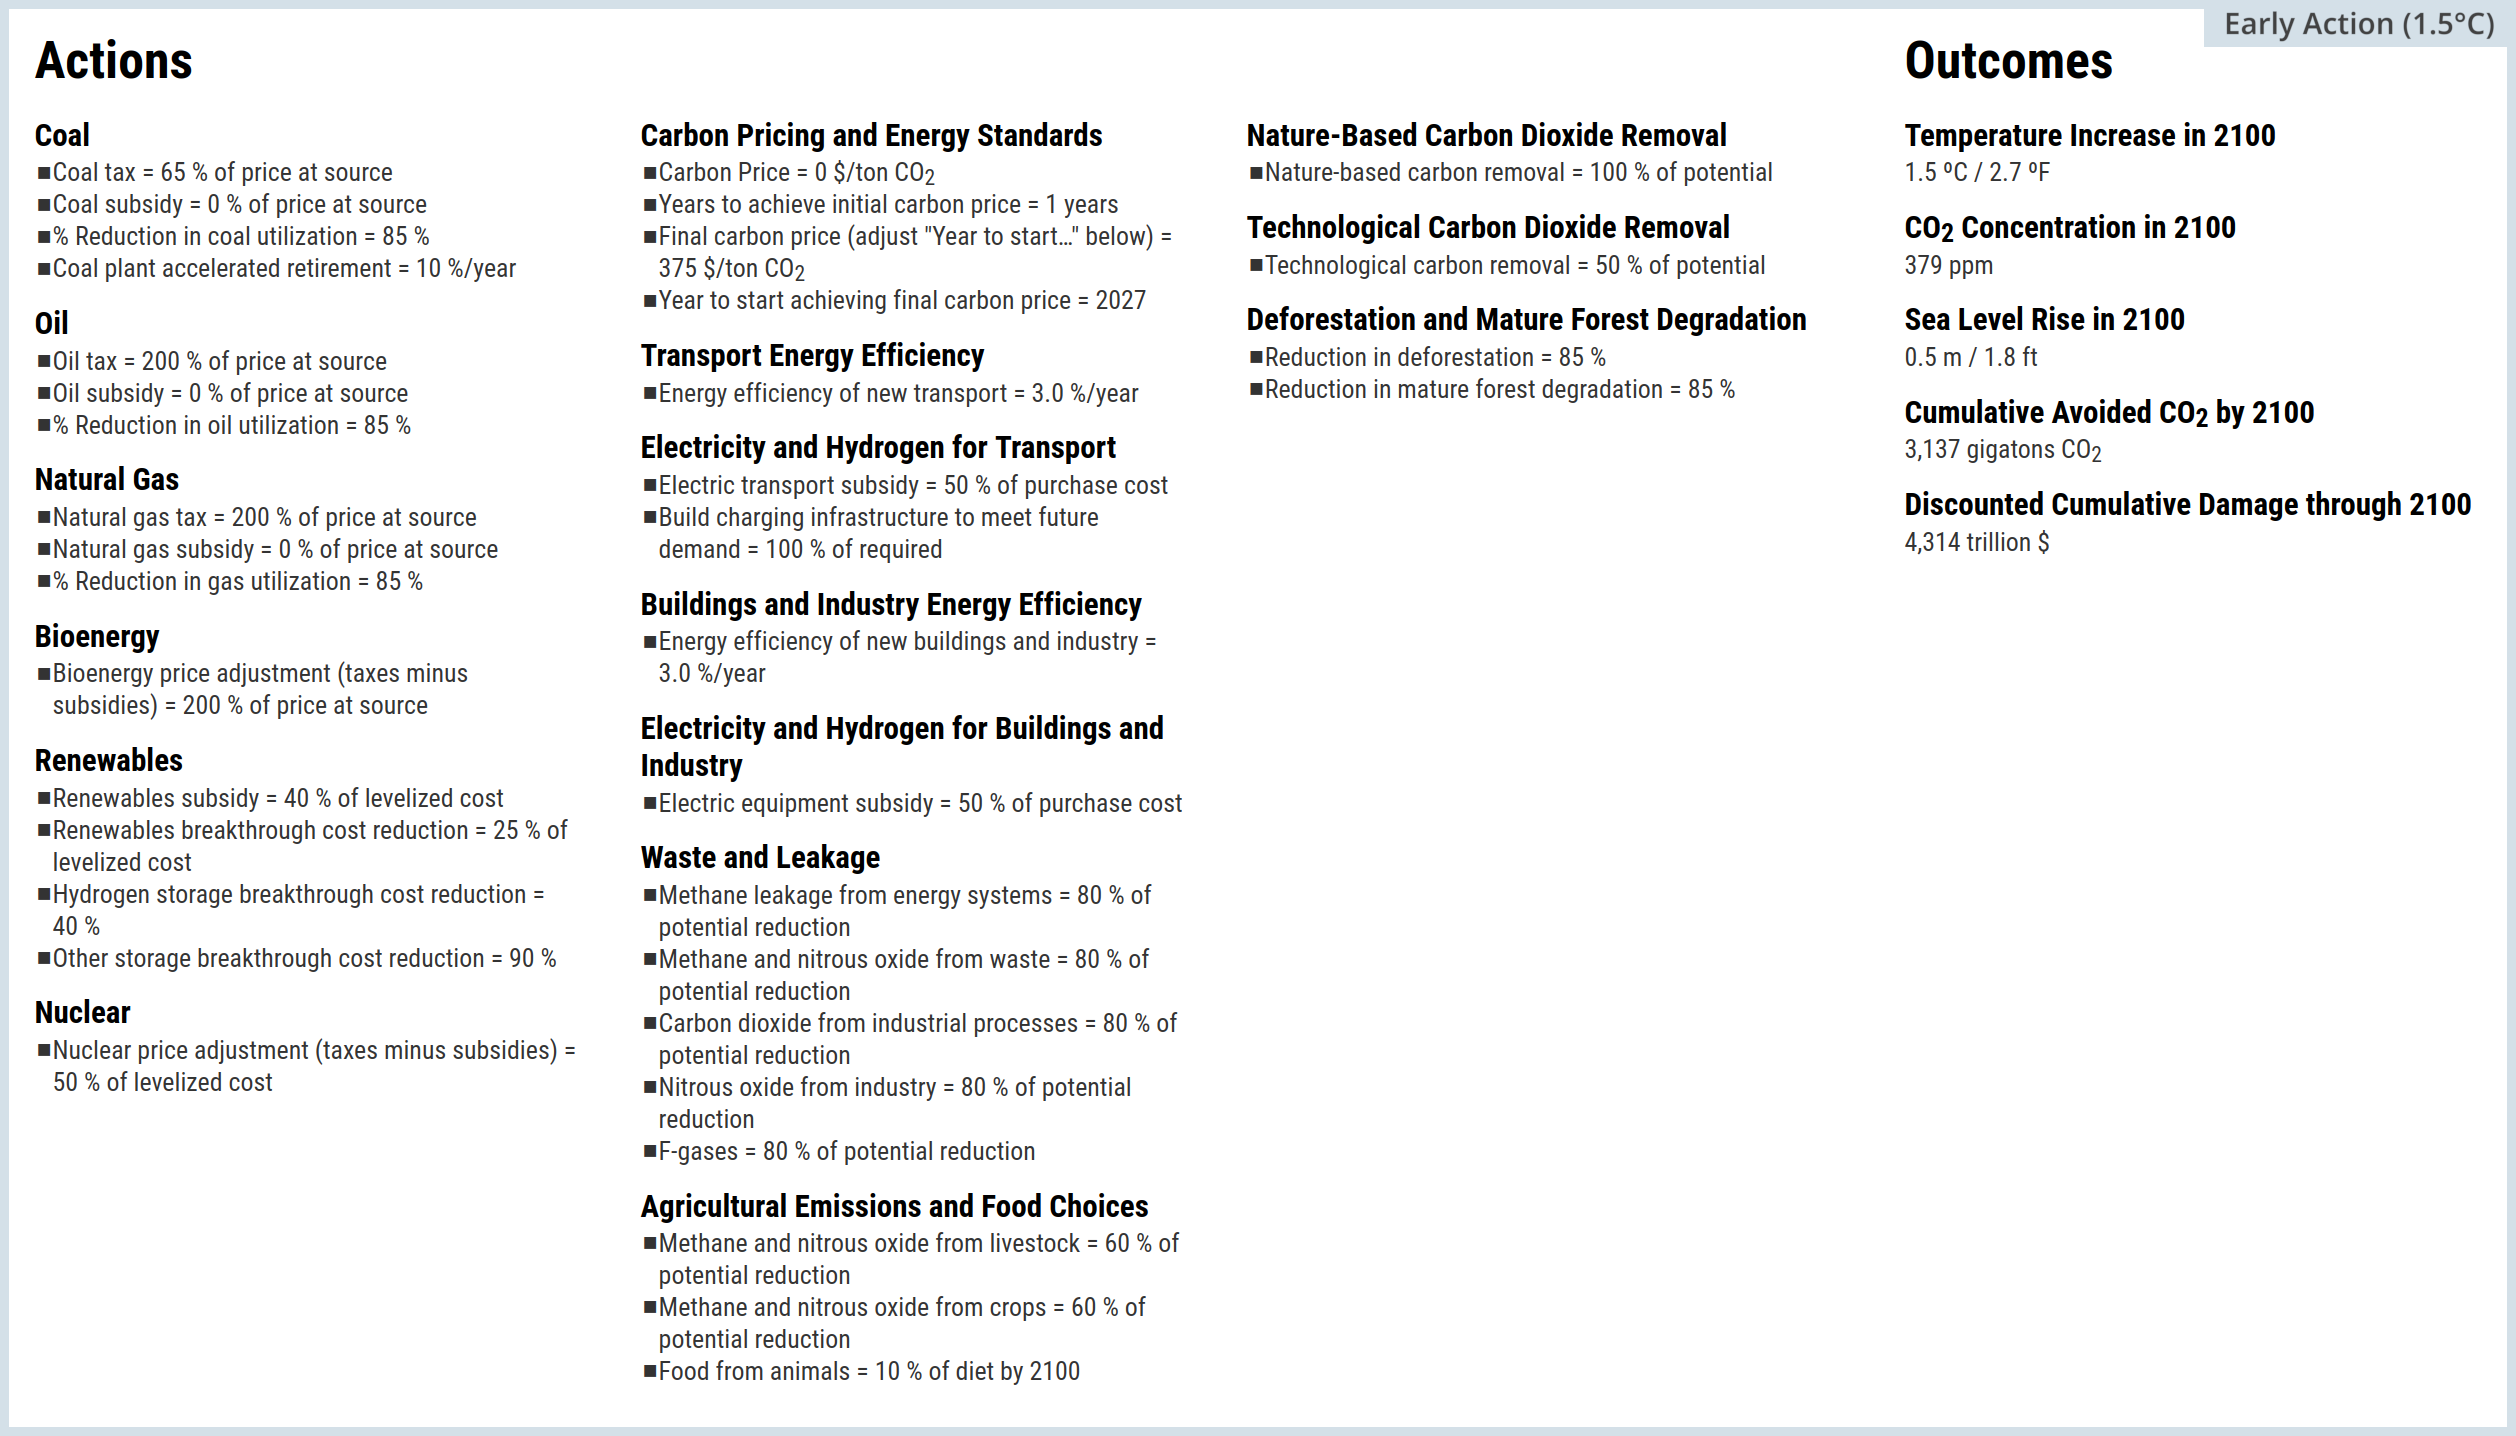
Source: Climate Interactive & MIT Sloan (2026) En-ROADS Simulator (Version 26.8.0)
A delayed action scenario: 2.3°C by 2100
This section explores a single En-ROADS scenario 2.3°C by 2100. You can modify the scenario by moving the sliders on the En-ROADS Simulator settings at the link
- This is just one scenario out of a huge number of possibilities
- All of the En-ROADS plots and images below labelled “Delayed Action (2.3°C)” use the same settings
- Detailed settings are accessed on their website by clicking the vertical ellipsis symbol in En-ROADS settings: ⋮
- Some detailed settings were modified, and these are summarised in the Actions and Outcomes screenshot at the end of this section
- The default assumptions were left unchanged
- Version 26.8.0 of Climate Interactive & MIT Sloan (2026) En-ROADS Simulator was used
For this scenario:
- CH4 concentration peaks in 2047
- Atmospheric GHG concentration peaks in 2055 and atmospheric CO2 concentration peaks in 2057
- Net GHG emissions (anthropogenic) are still well above zero in 2100, as are net CO2 emissions (anthropogenic)
- The global surface air temperature (GSAT) is 2.31°C in 2100 and increasing
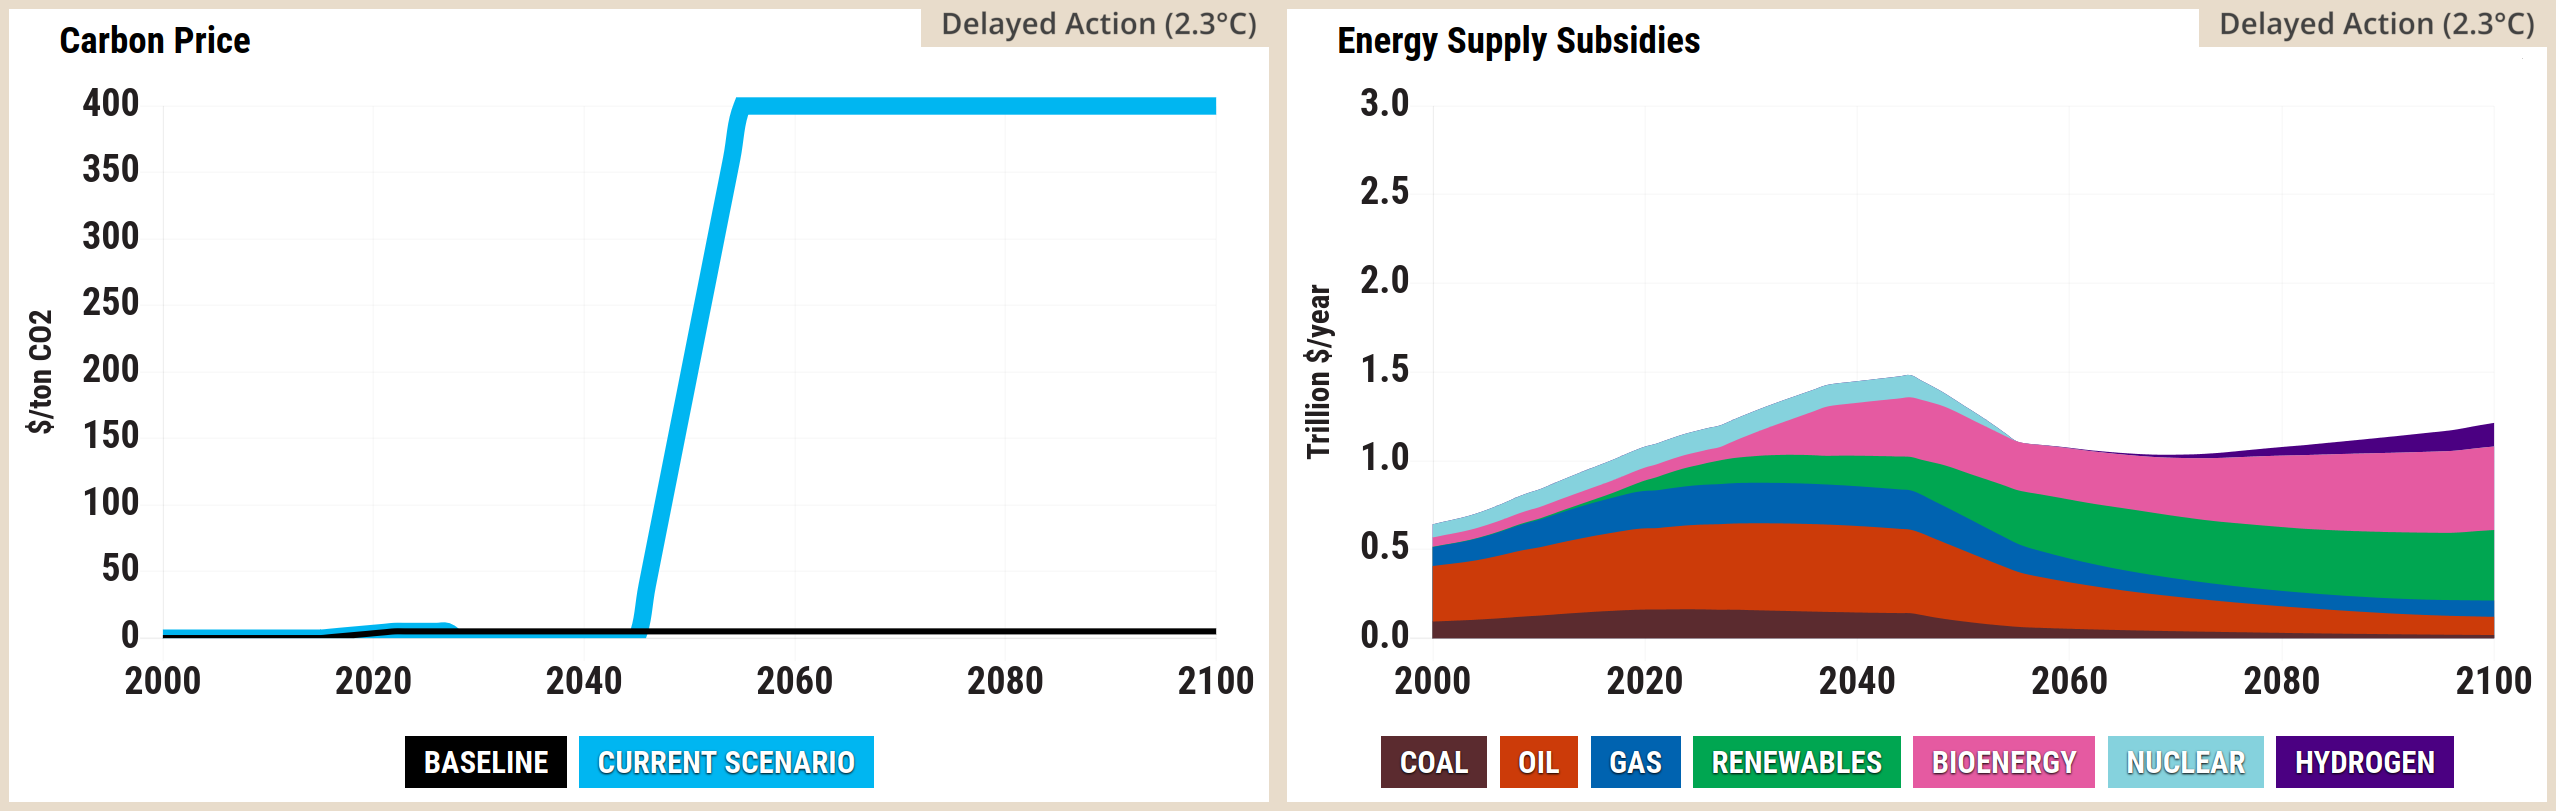
Source: Climate Interactive & MIT Sloan (2026) En-ROADS Simulator (Version 26.8.0)
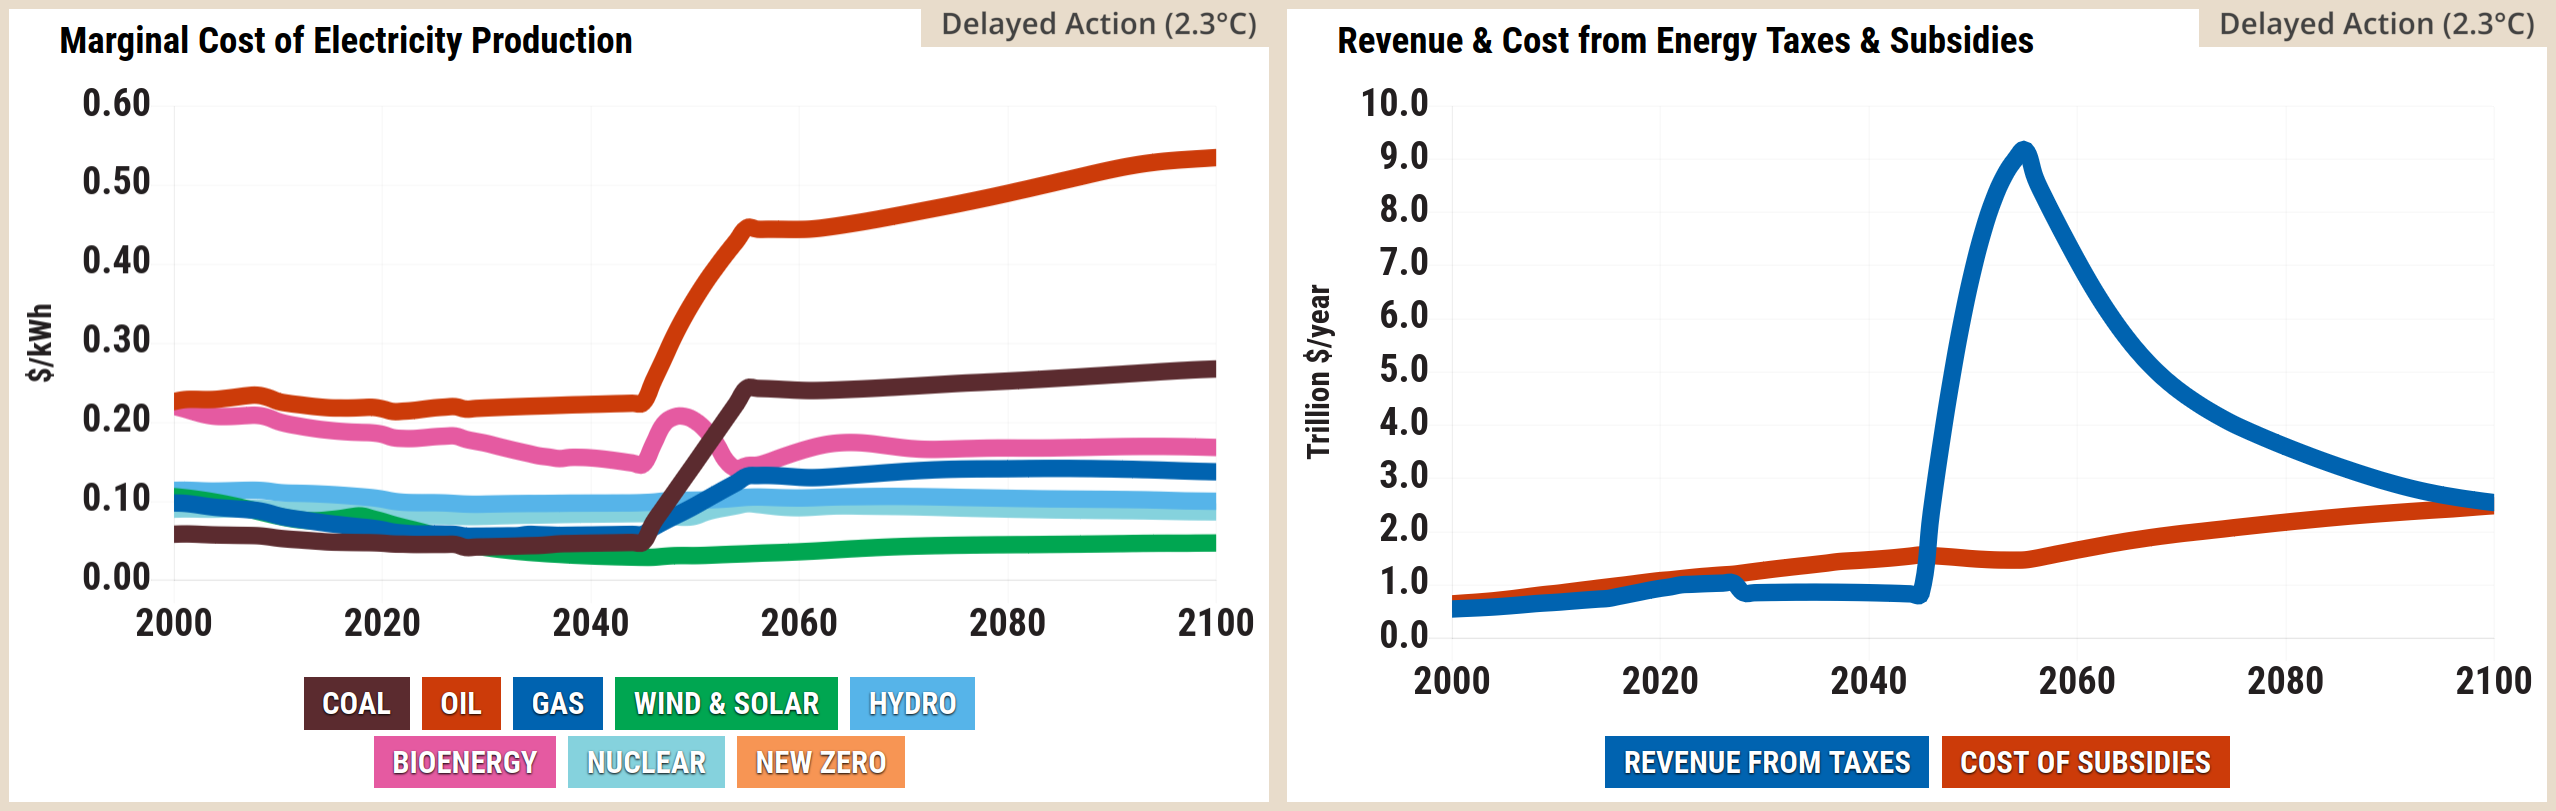
Source: Climate Interactive & MIT Sloan (2026) En-ROADS Simulator (Version 26.8.0)
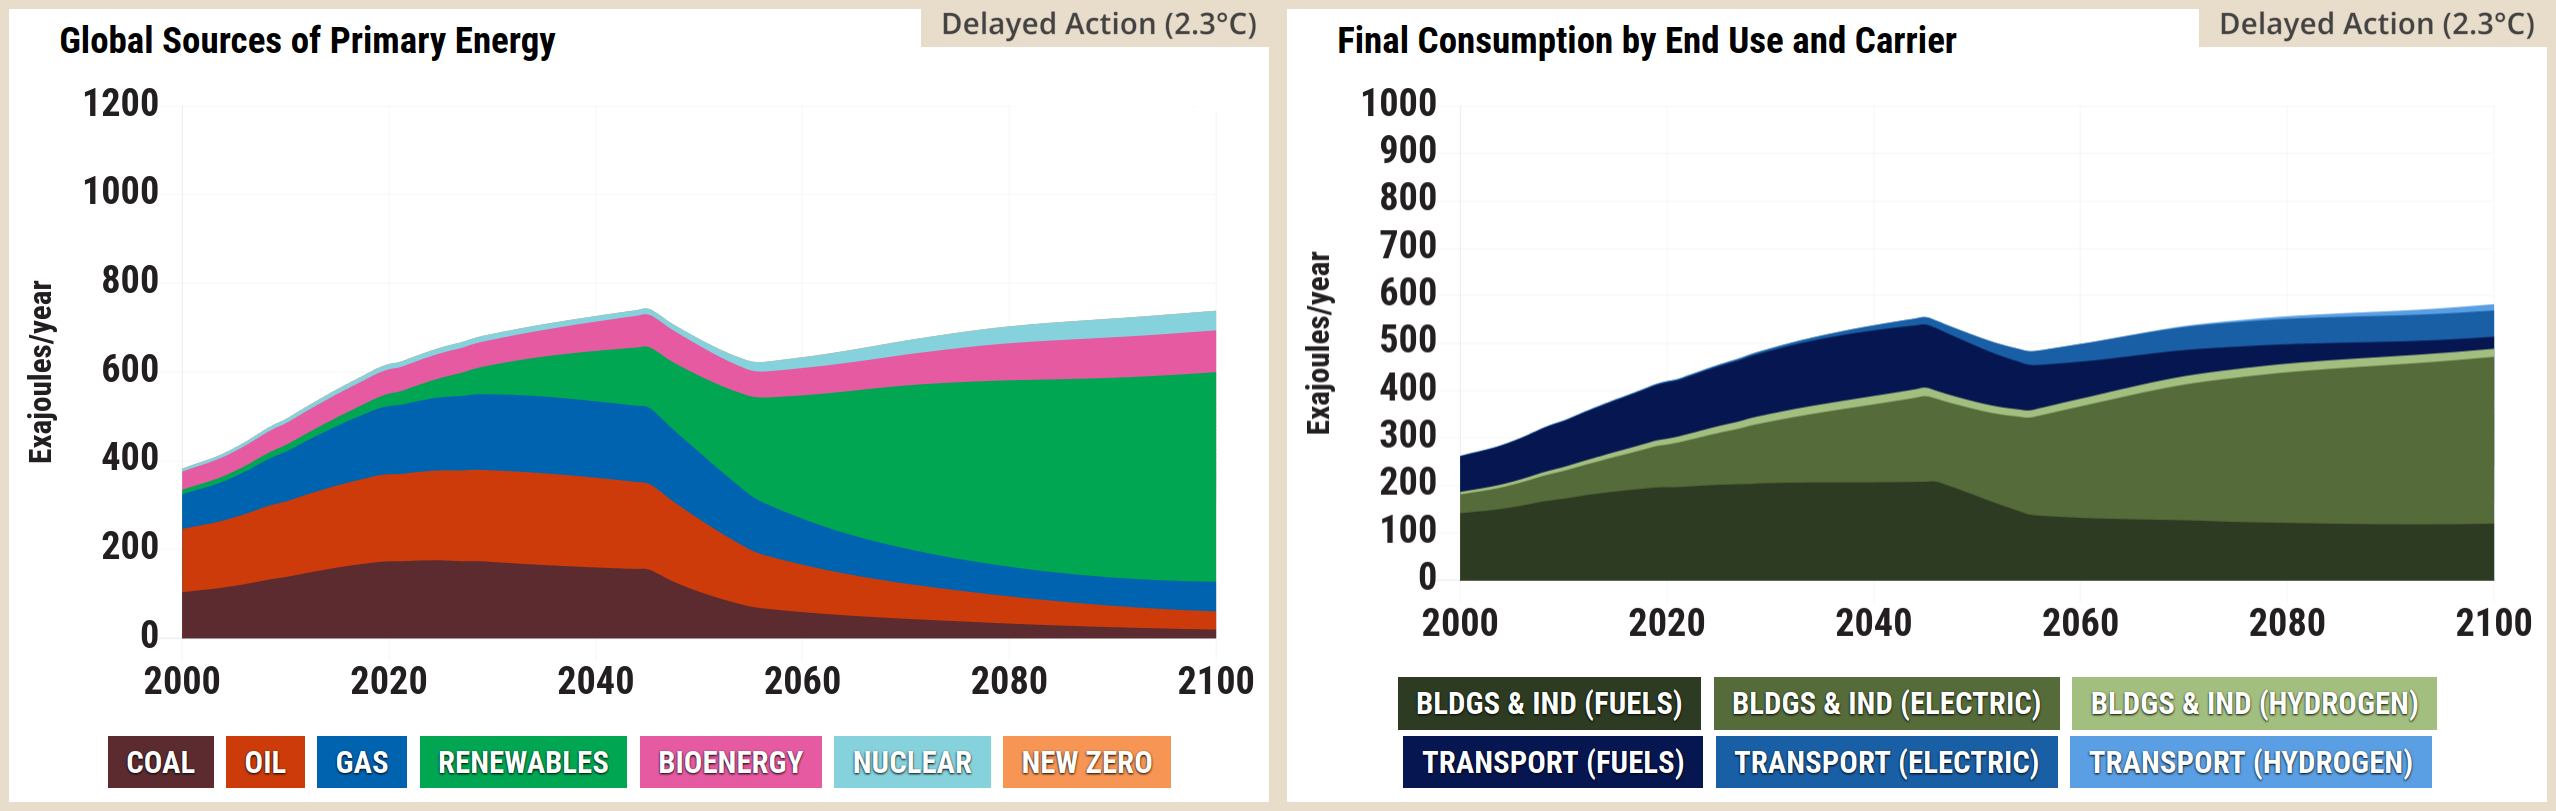
Source: Climate Interactive & MIT Sloan (2026) En-ROADS Simulator (Version 26.8.0)
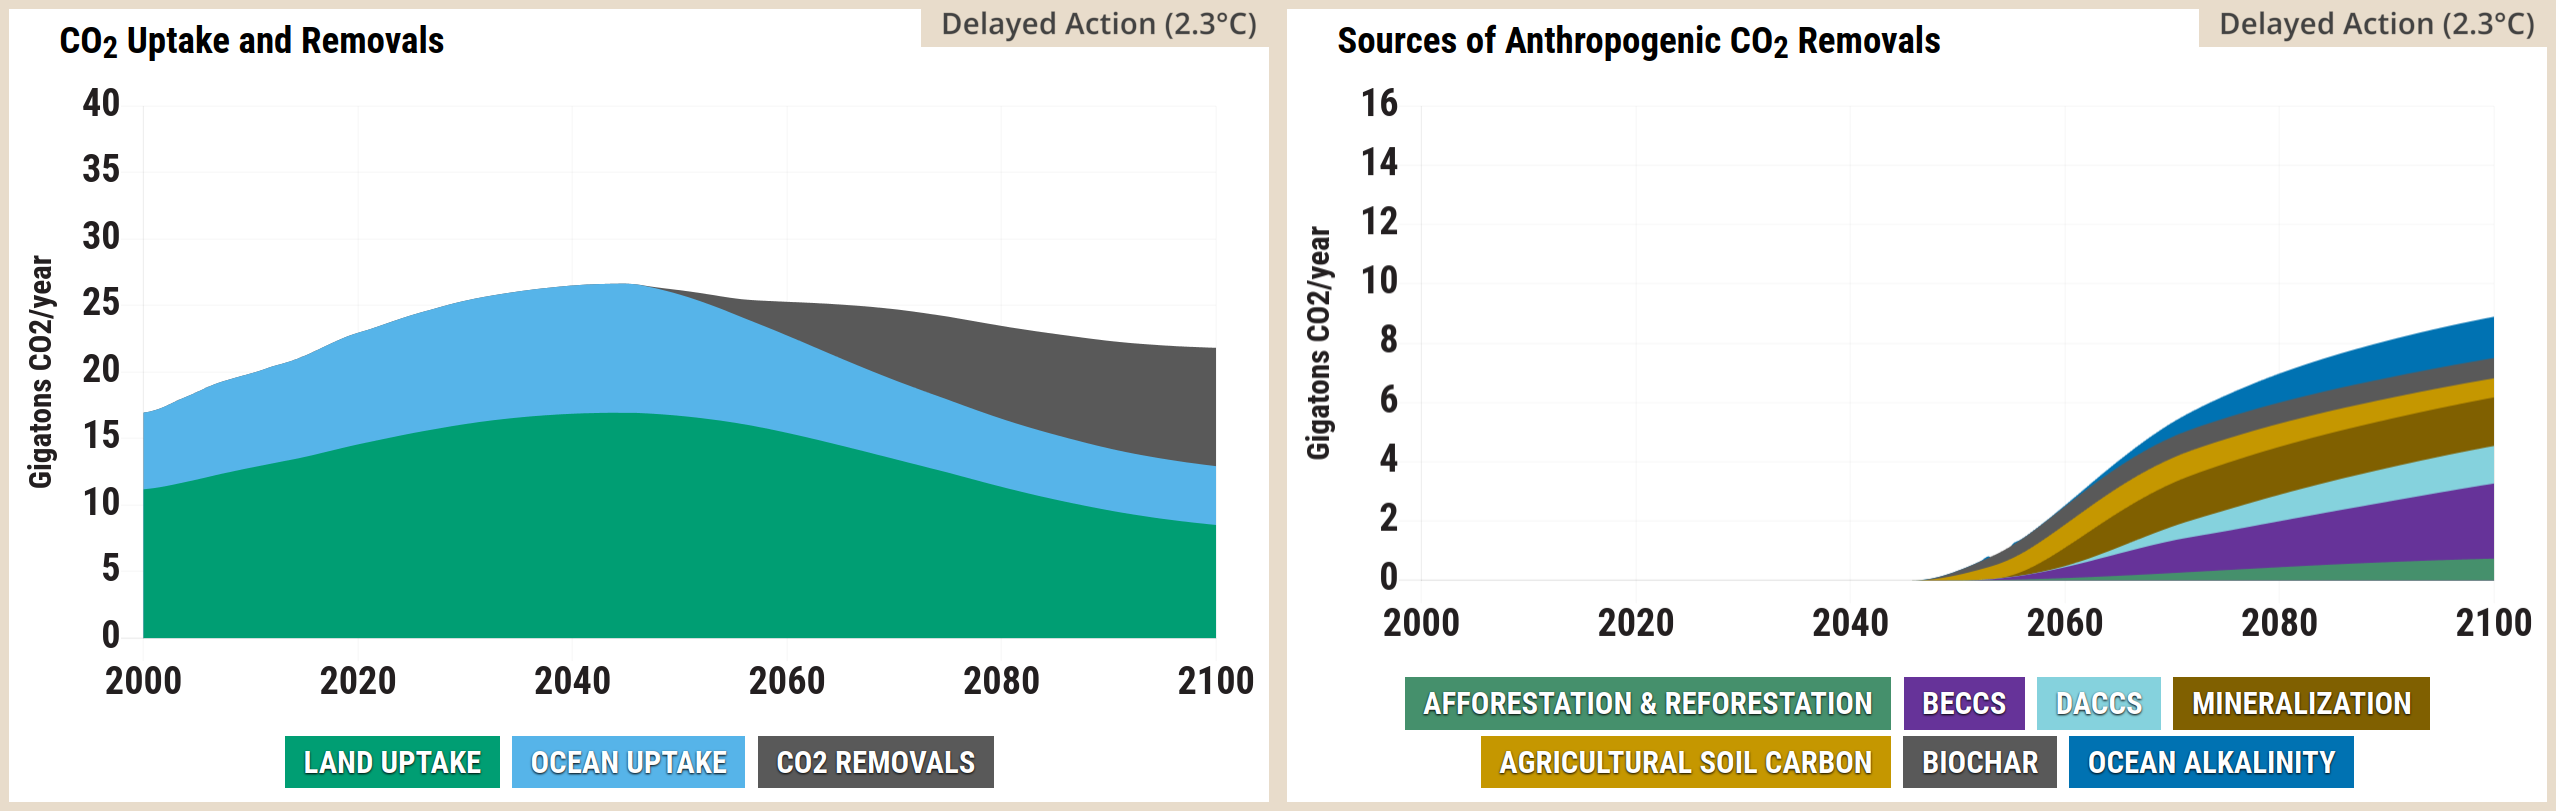
Source: Climate Interactive & MIT Sloan (2026) En-ROADS Simulator (Version 26.8.0)
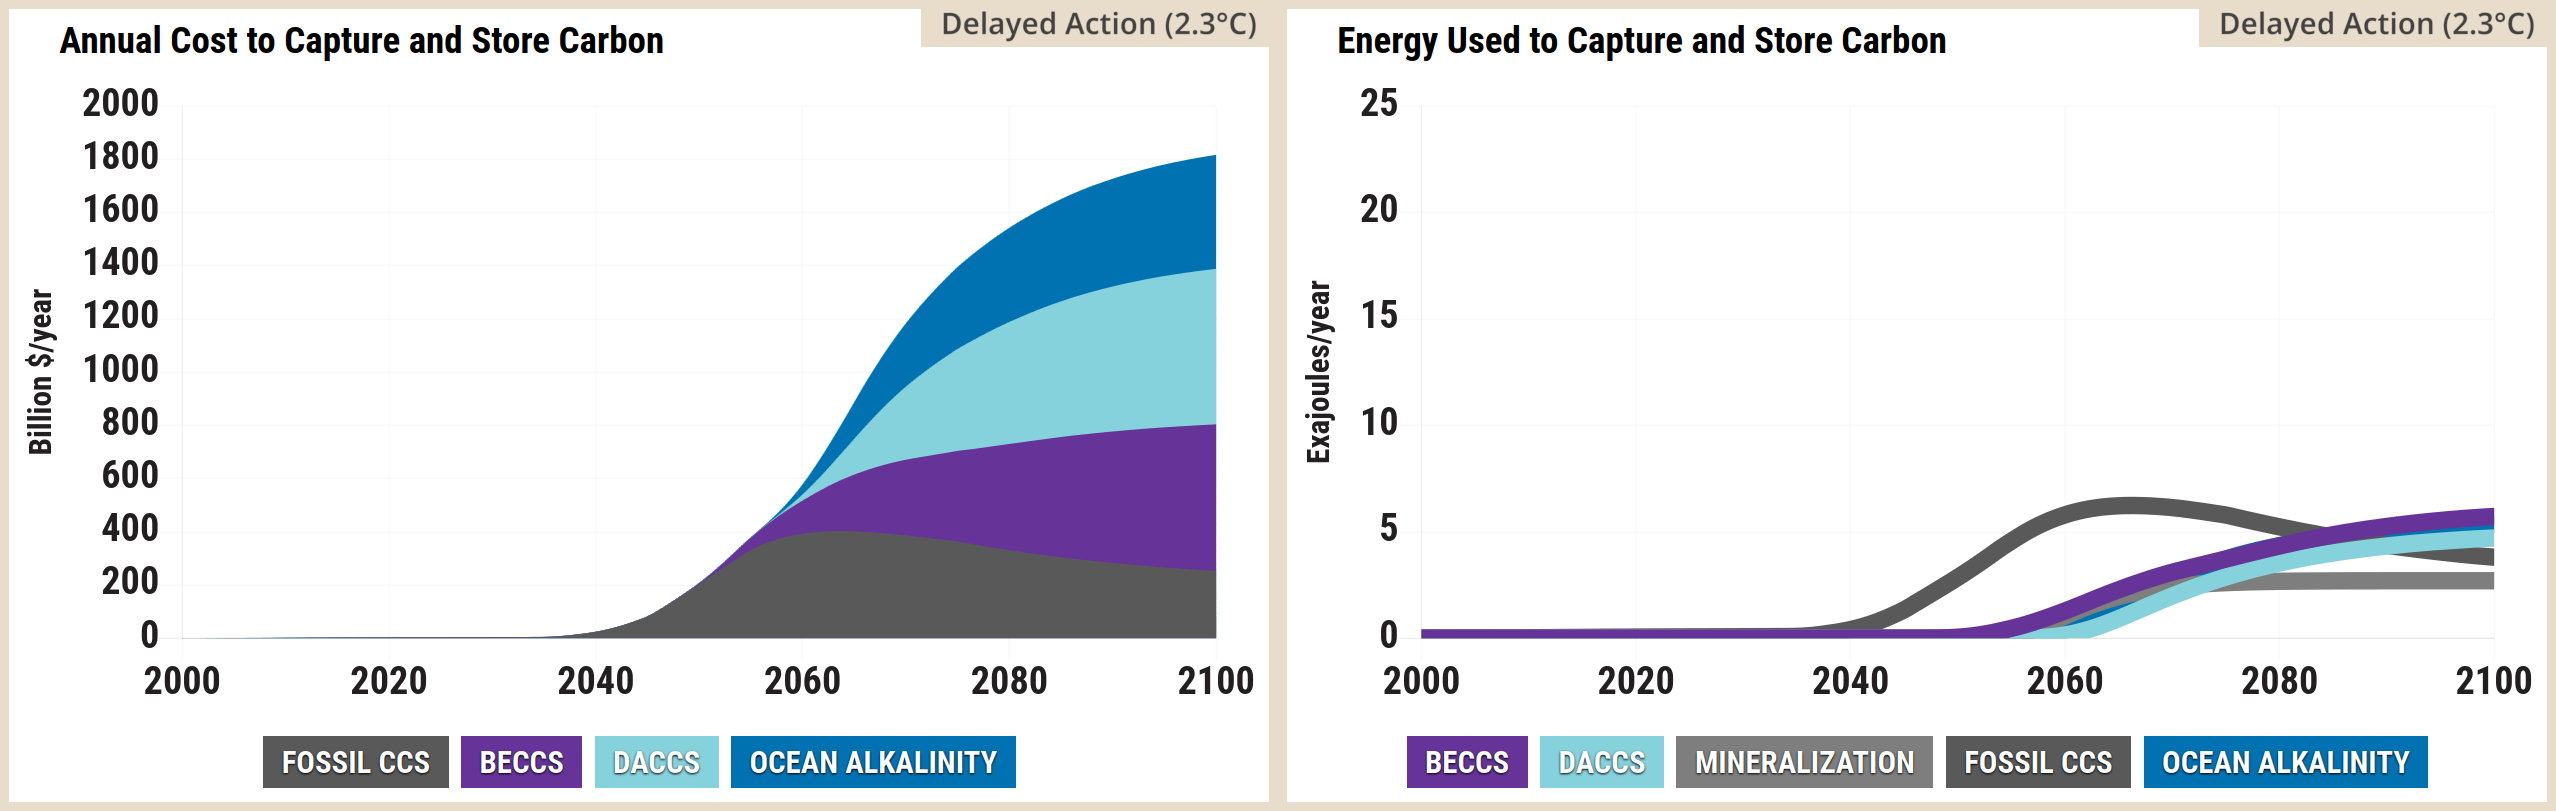
Source: Climate Interactive & MIT Sloan (2026) En-ROADS Simulator (Version 26.8.0)
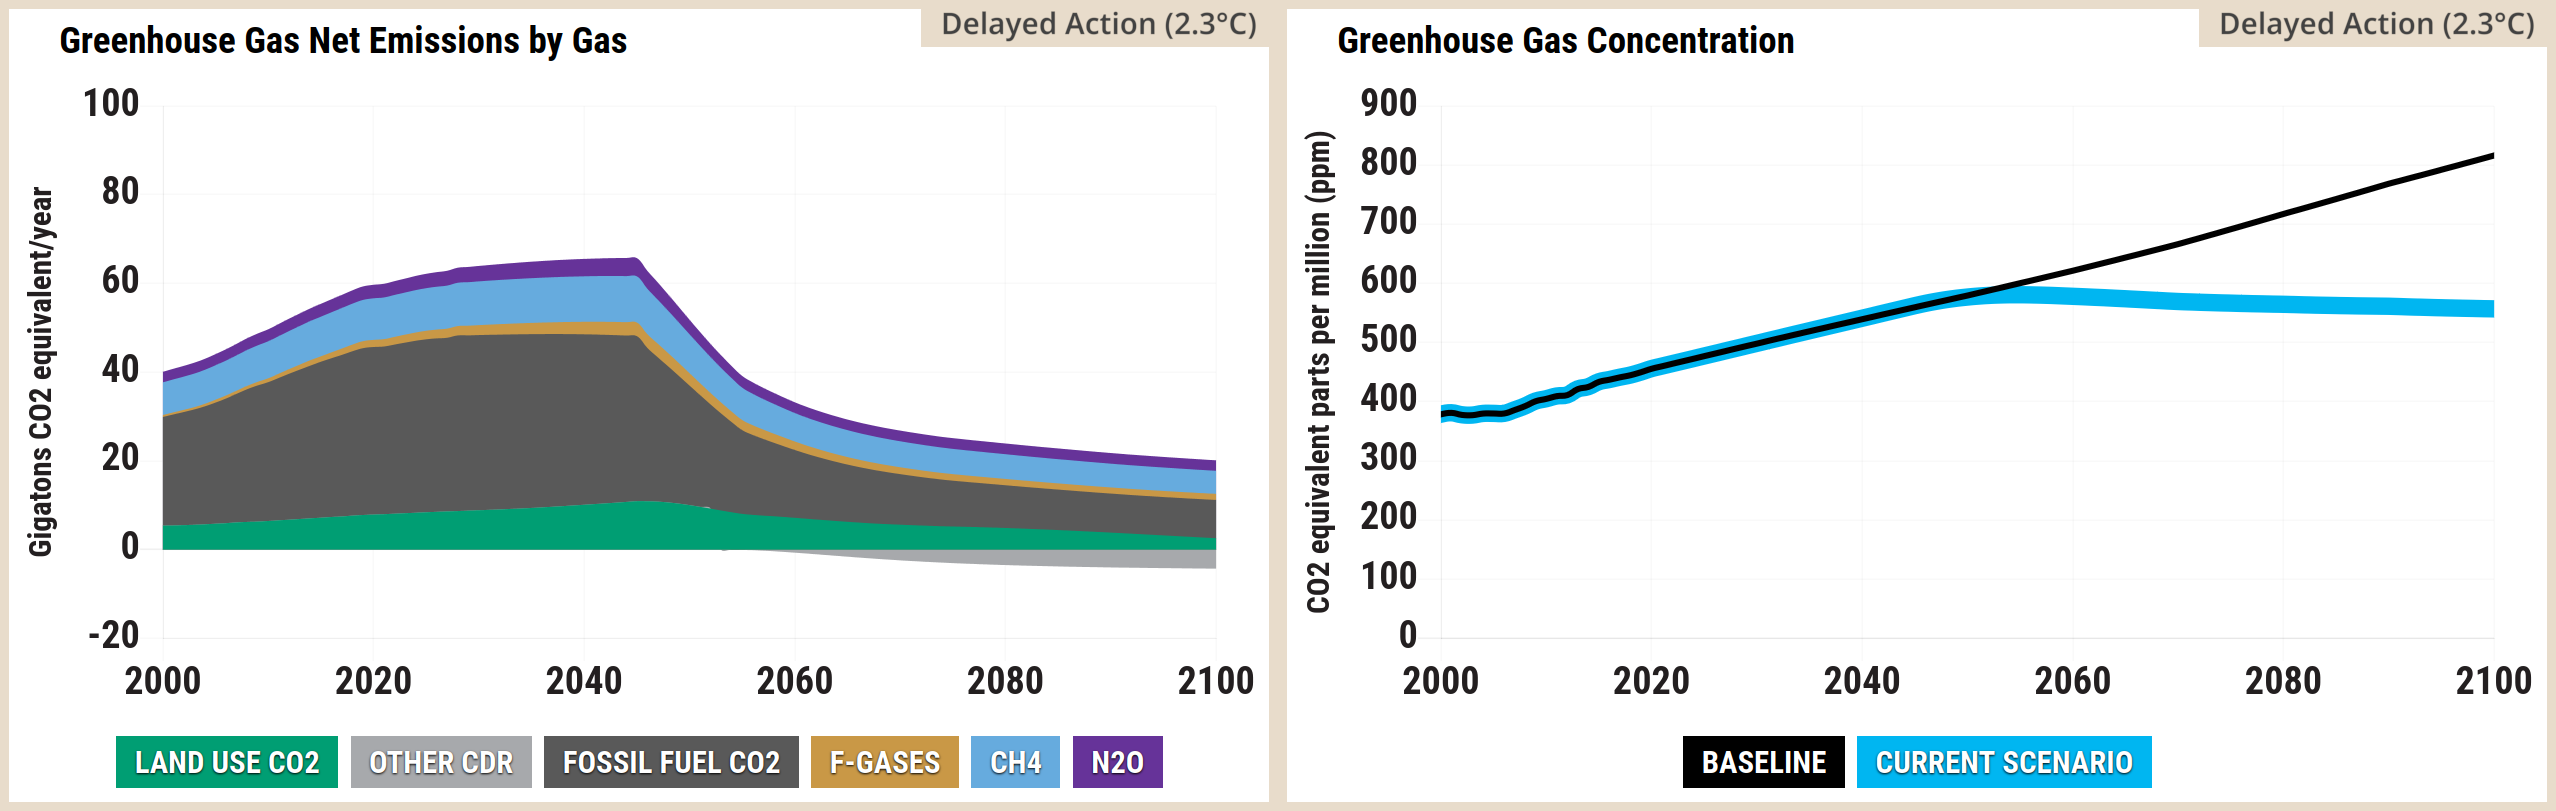
Source: Climate Interactive & MIT Sloan (2026) En-ROADS Simulator (Version 26.8.0)
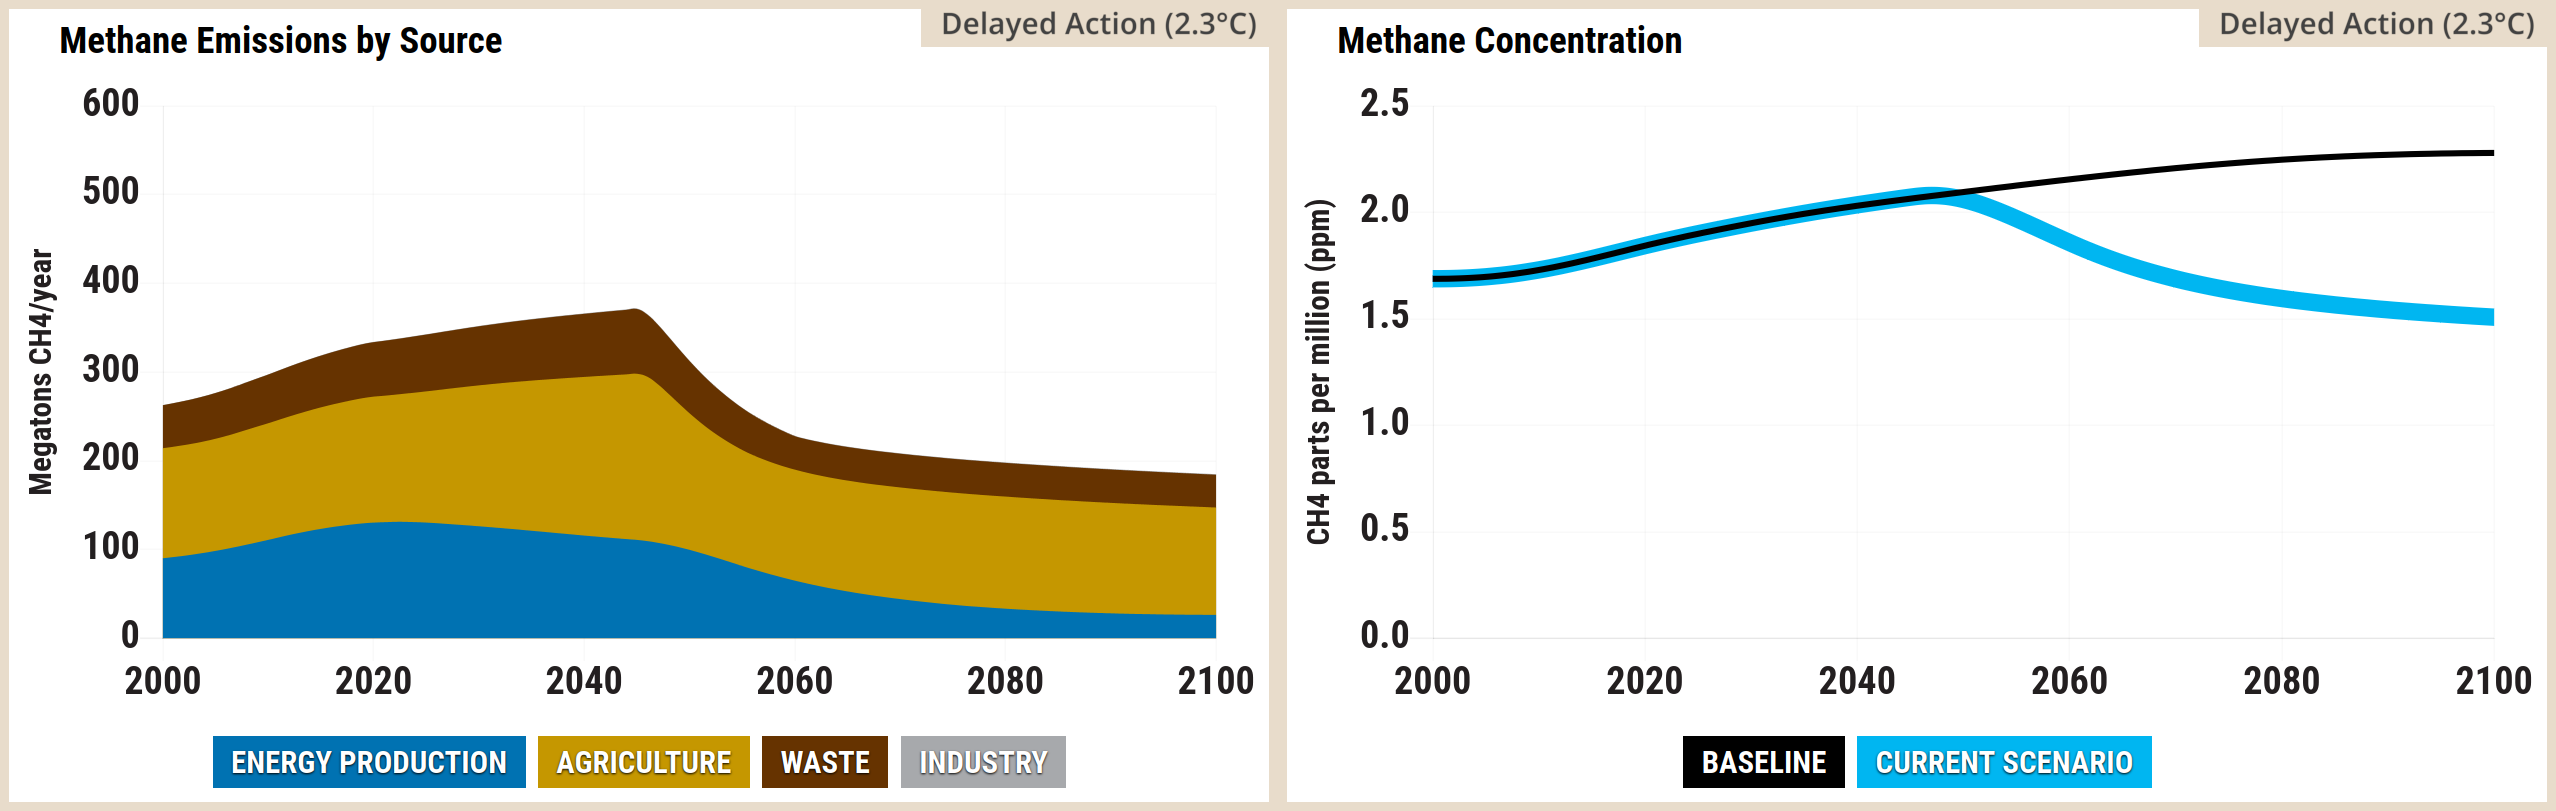
Source: Climate Interactive & MIT Sloan (2026) En-ROADS Simulator (Version 26.8.0)
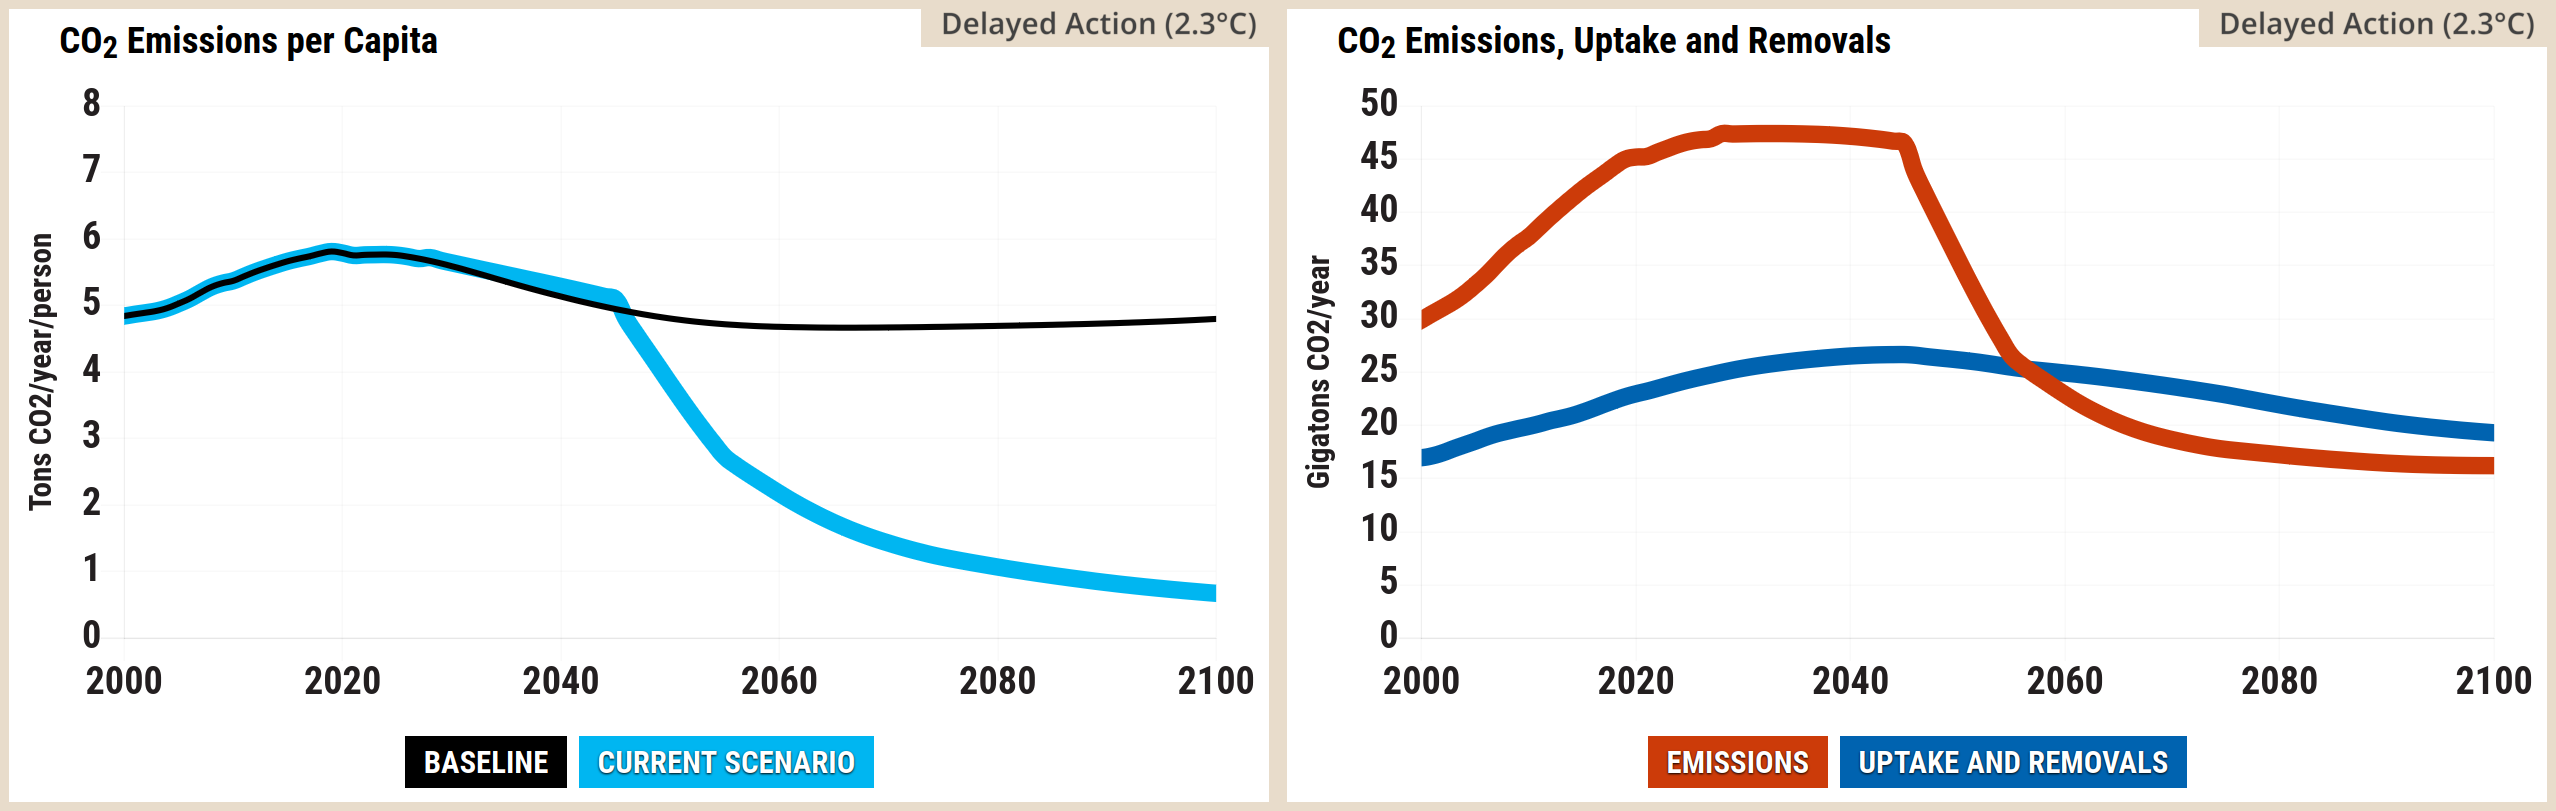
Source: Climate Interactive & MIT Sloan (2026) En-ROADS Simulator (Version 26.8.0)
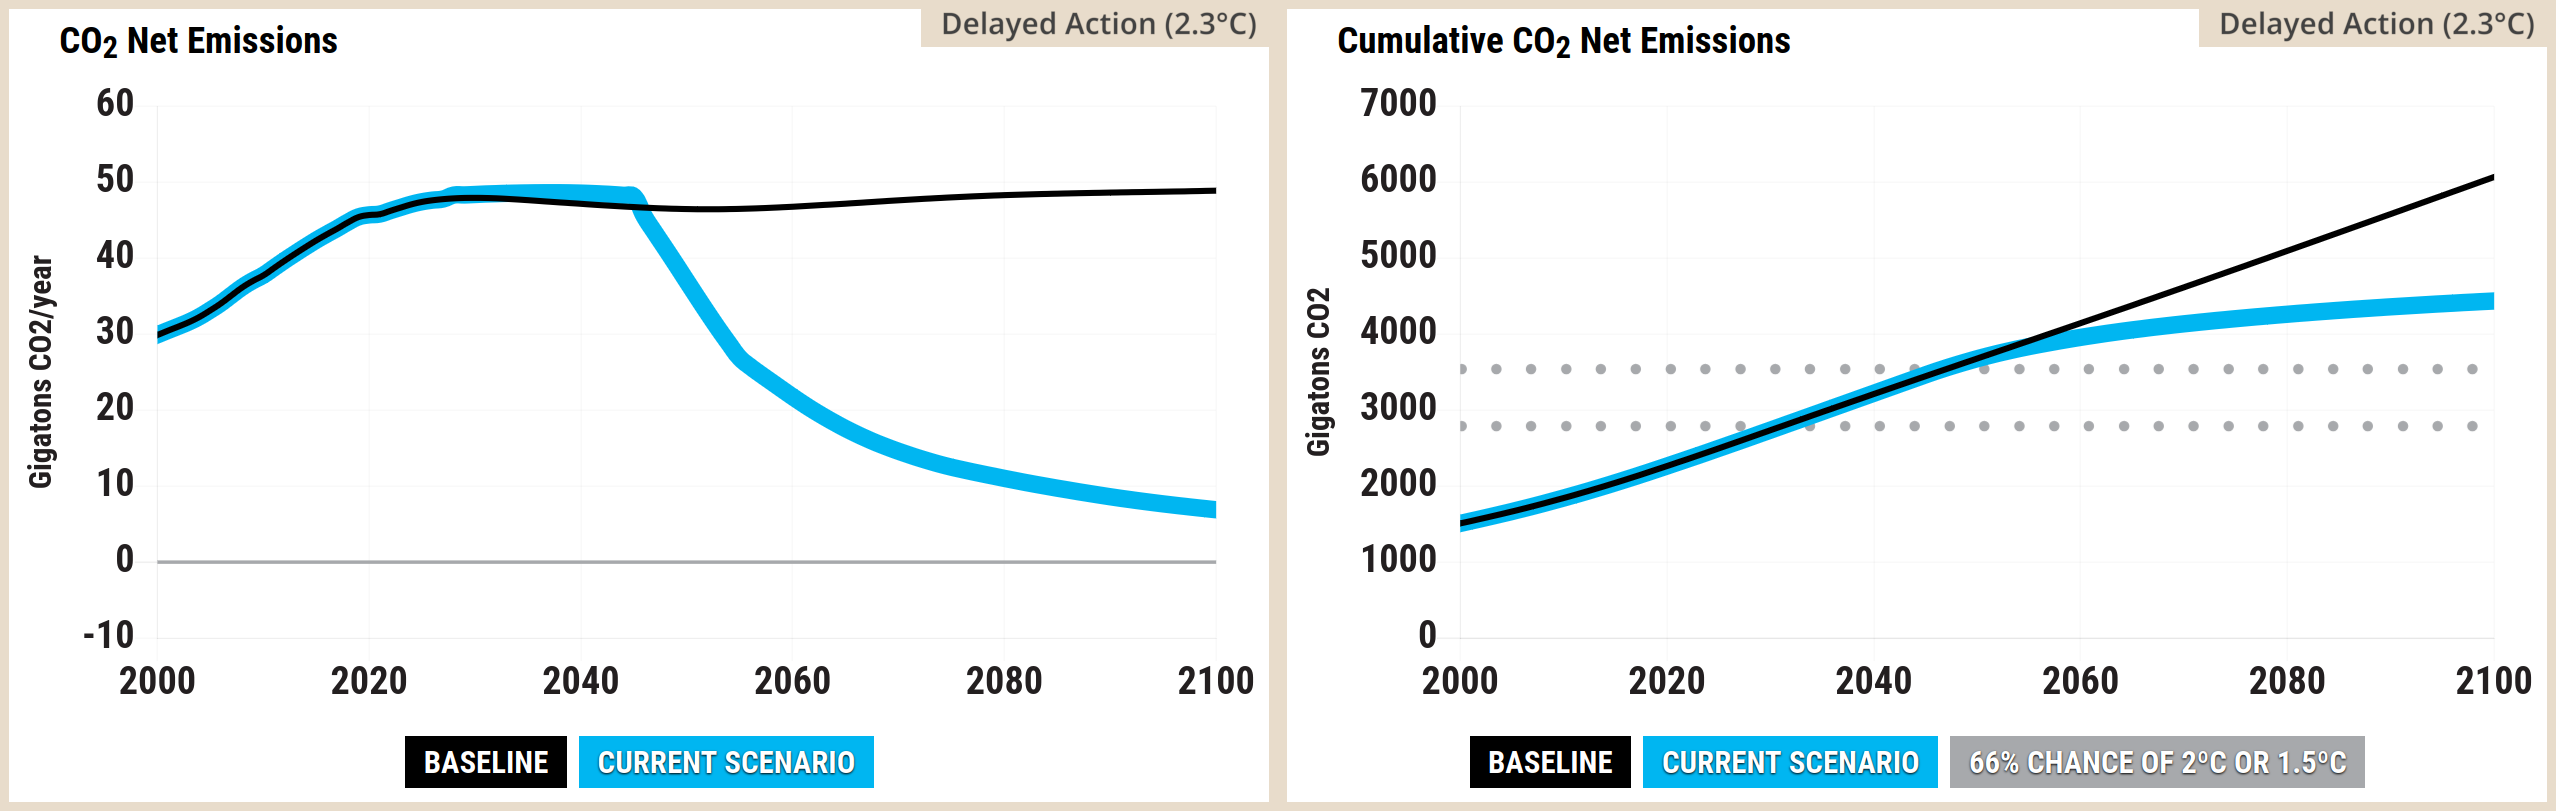
Source: Climate Interactive & MIT Sloan (2026) En-ROADS Simulator (Version 26.8.0)
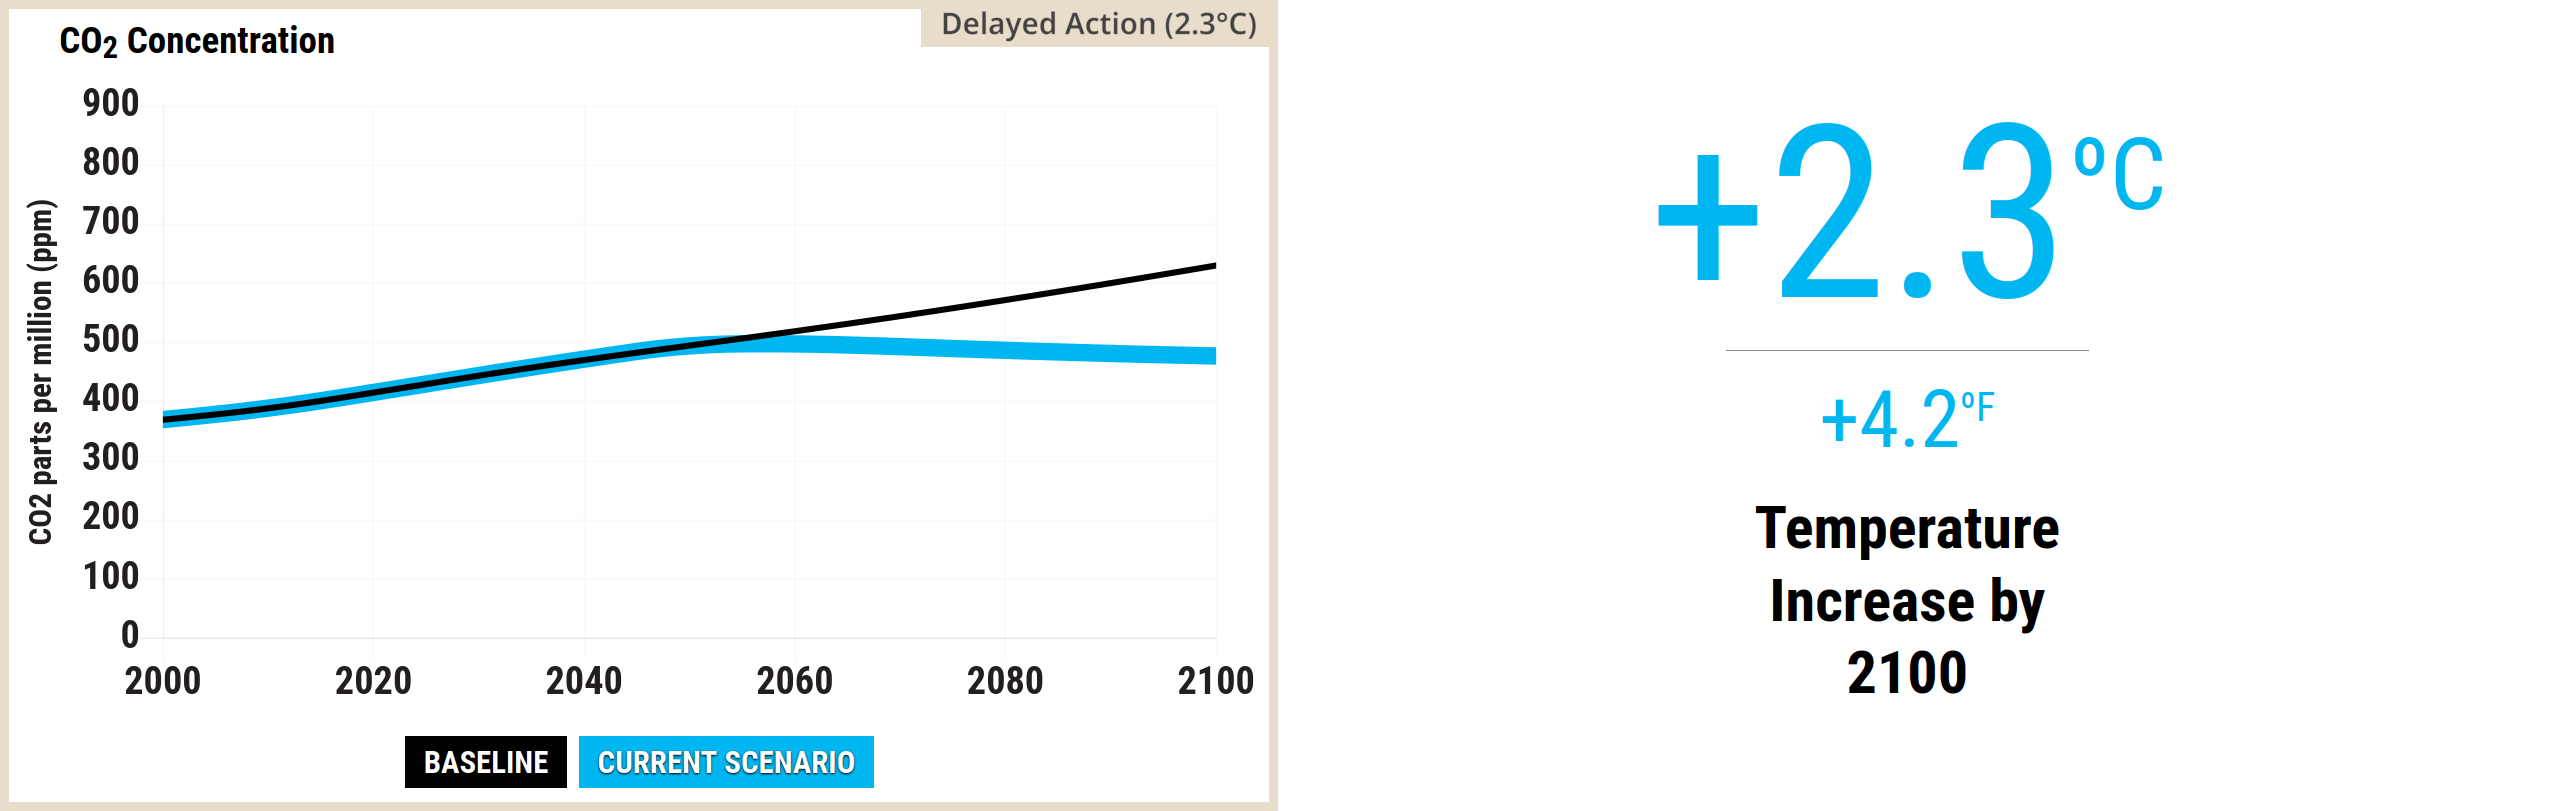
Source: Climate Interactive & MIT Sloan (2026) En-ROADS Simulator (Version 26.8.0)
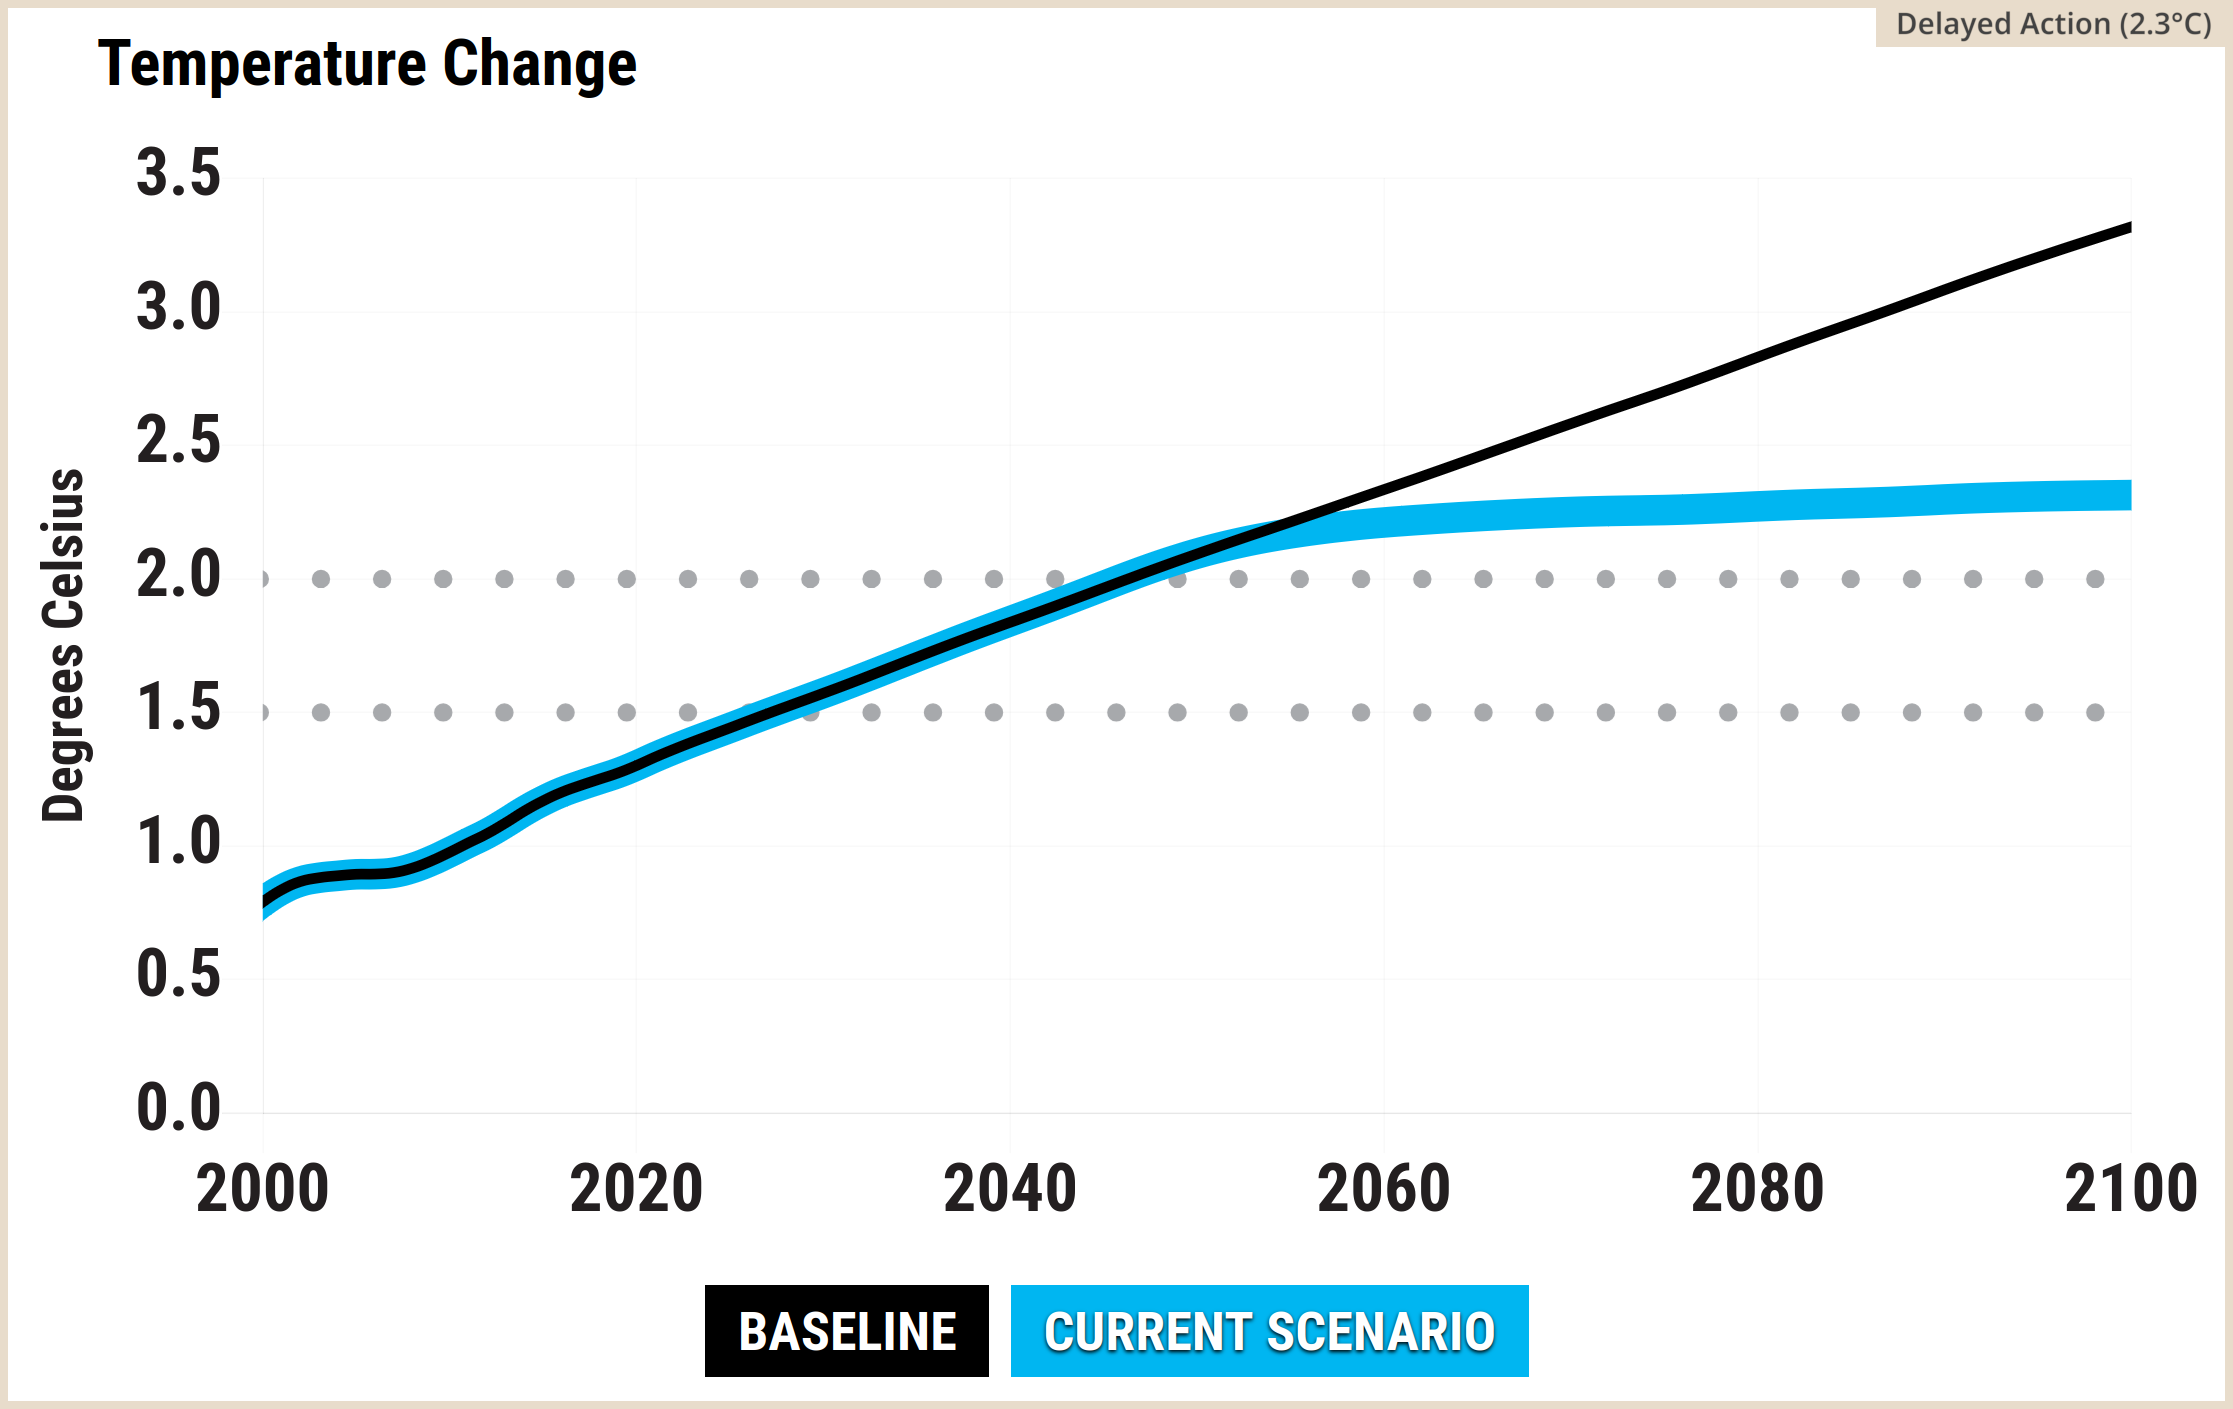
Source: Climate Interactive & MIT Sloan (2026) En-ROADS Simulator (Version 26.8.0)
Kaya graphs
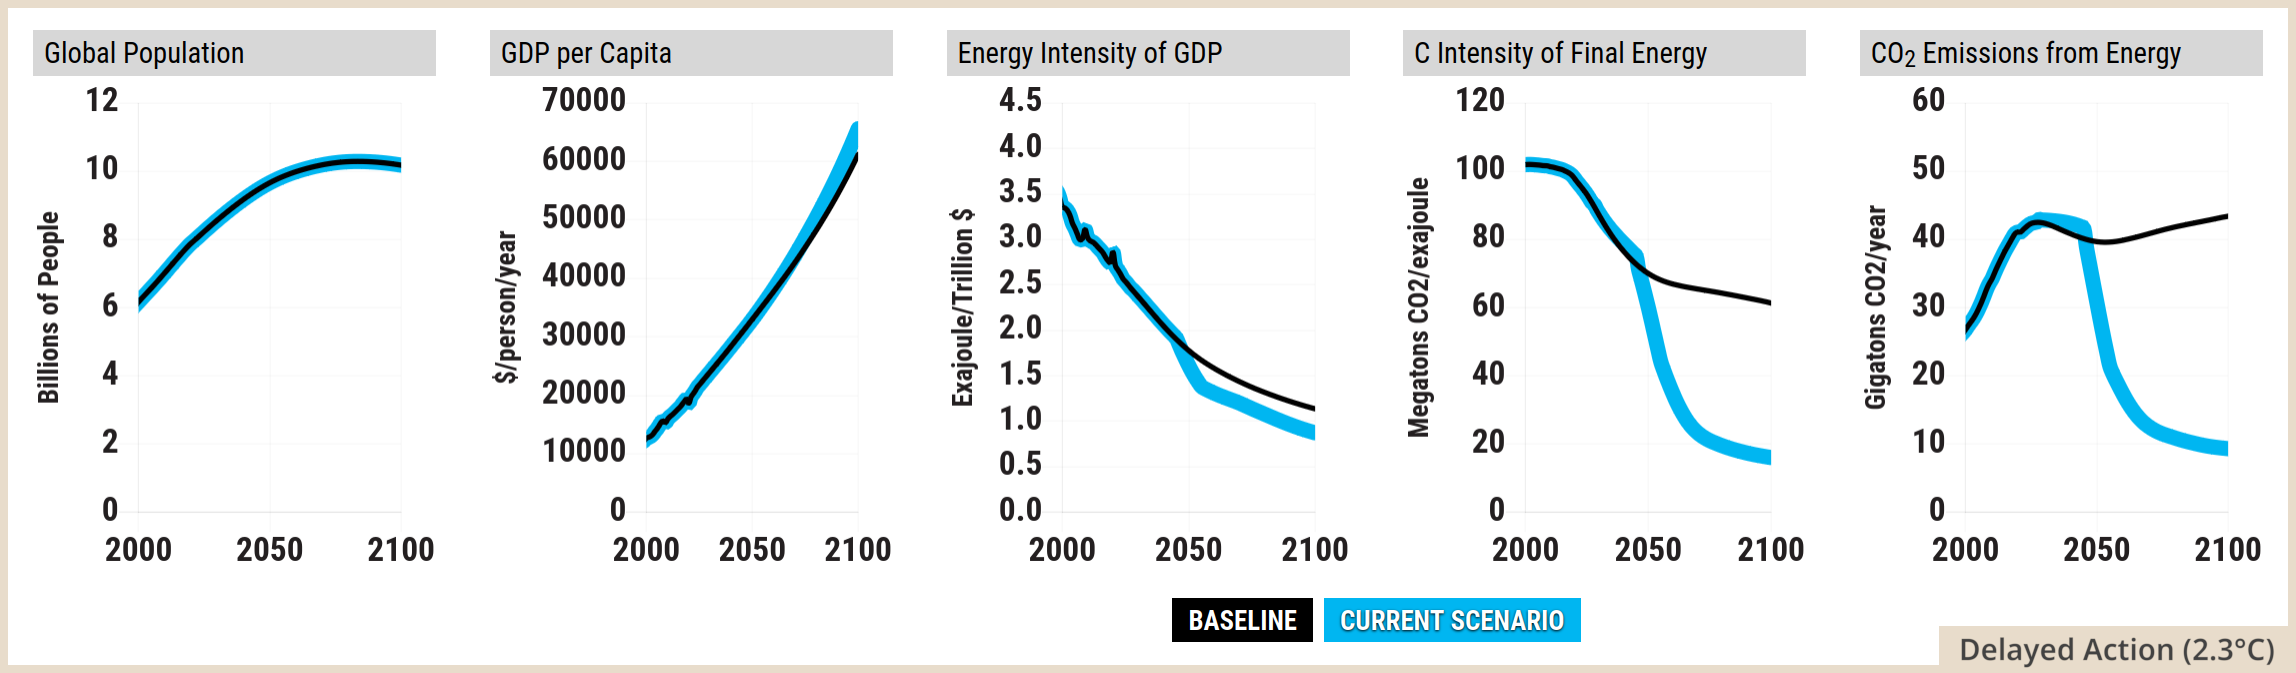
Source: Climate Interactive & MIT Sloan (2026) En-ROADS Simulator (Version 26.8.0)
En-ROADS settings for the 2.3°C by 2100 scenario
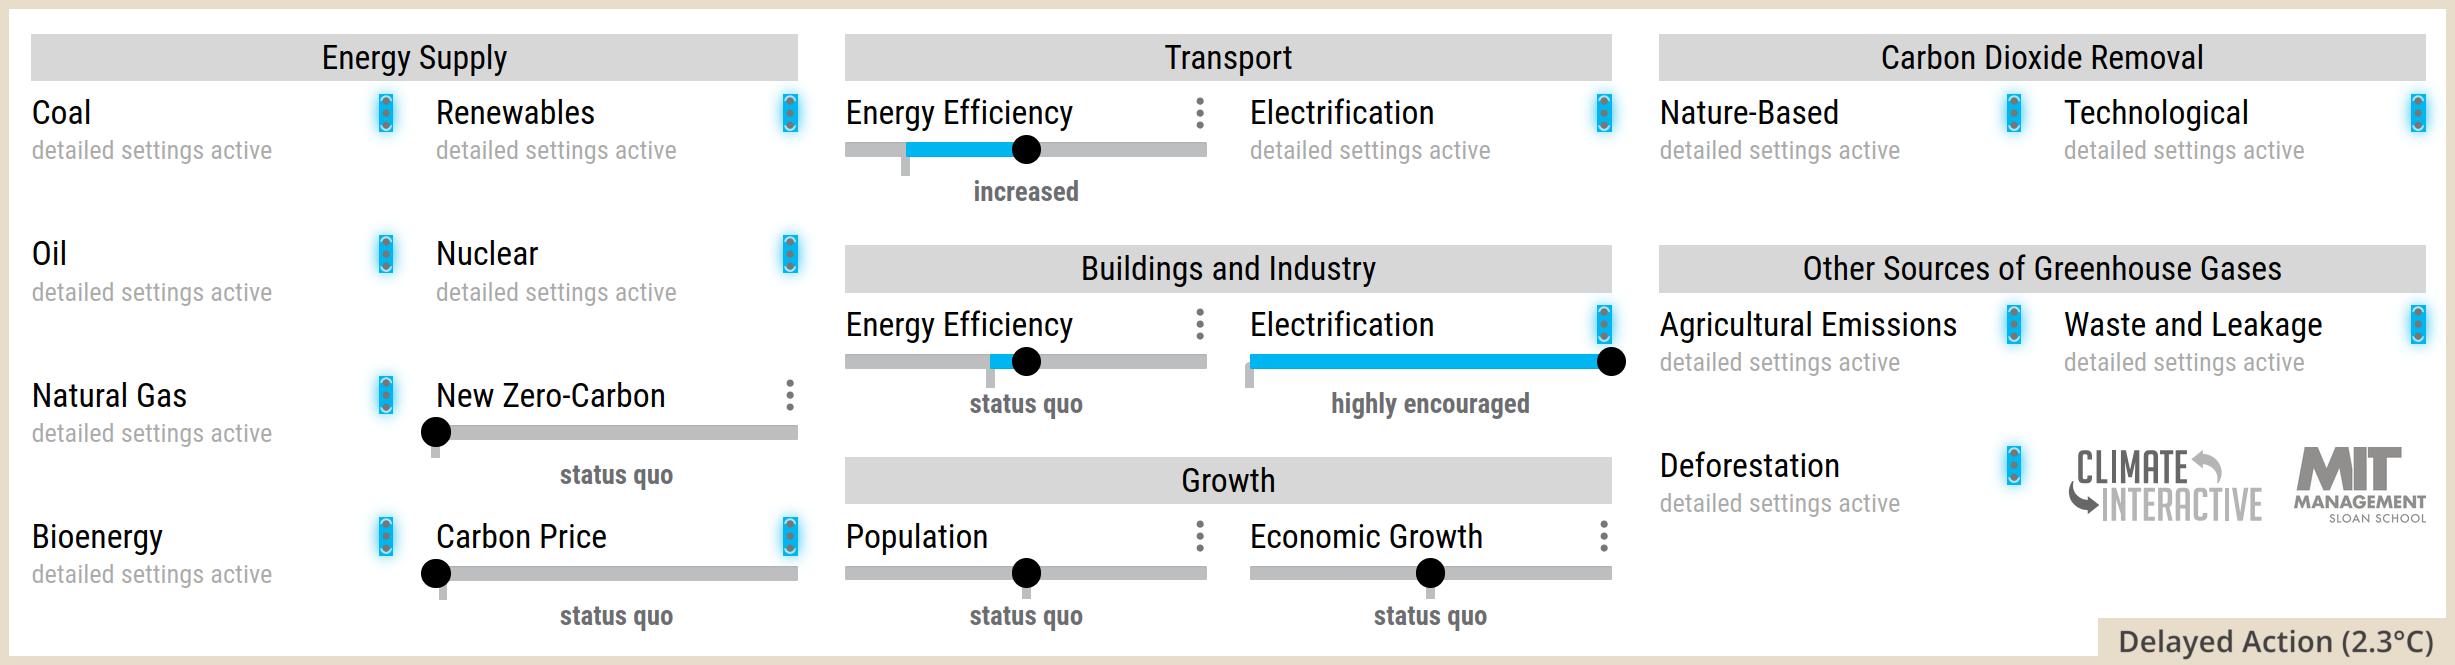
Source: Climate Interactive & MIT Sloan (2026) En-ROADS Simulator (Version 26.8.0)
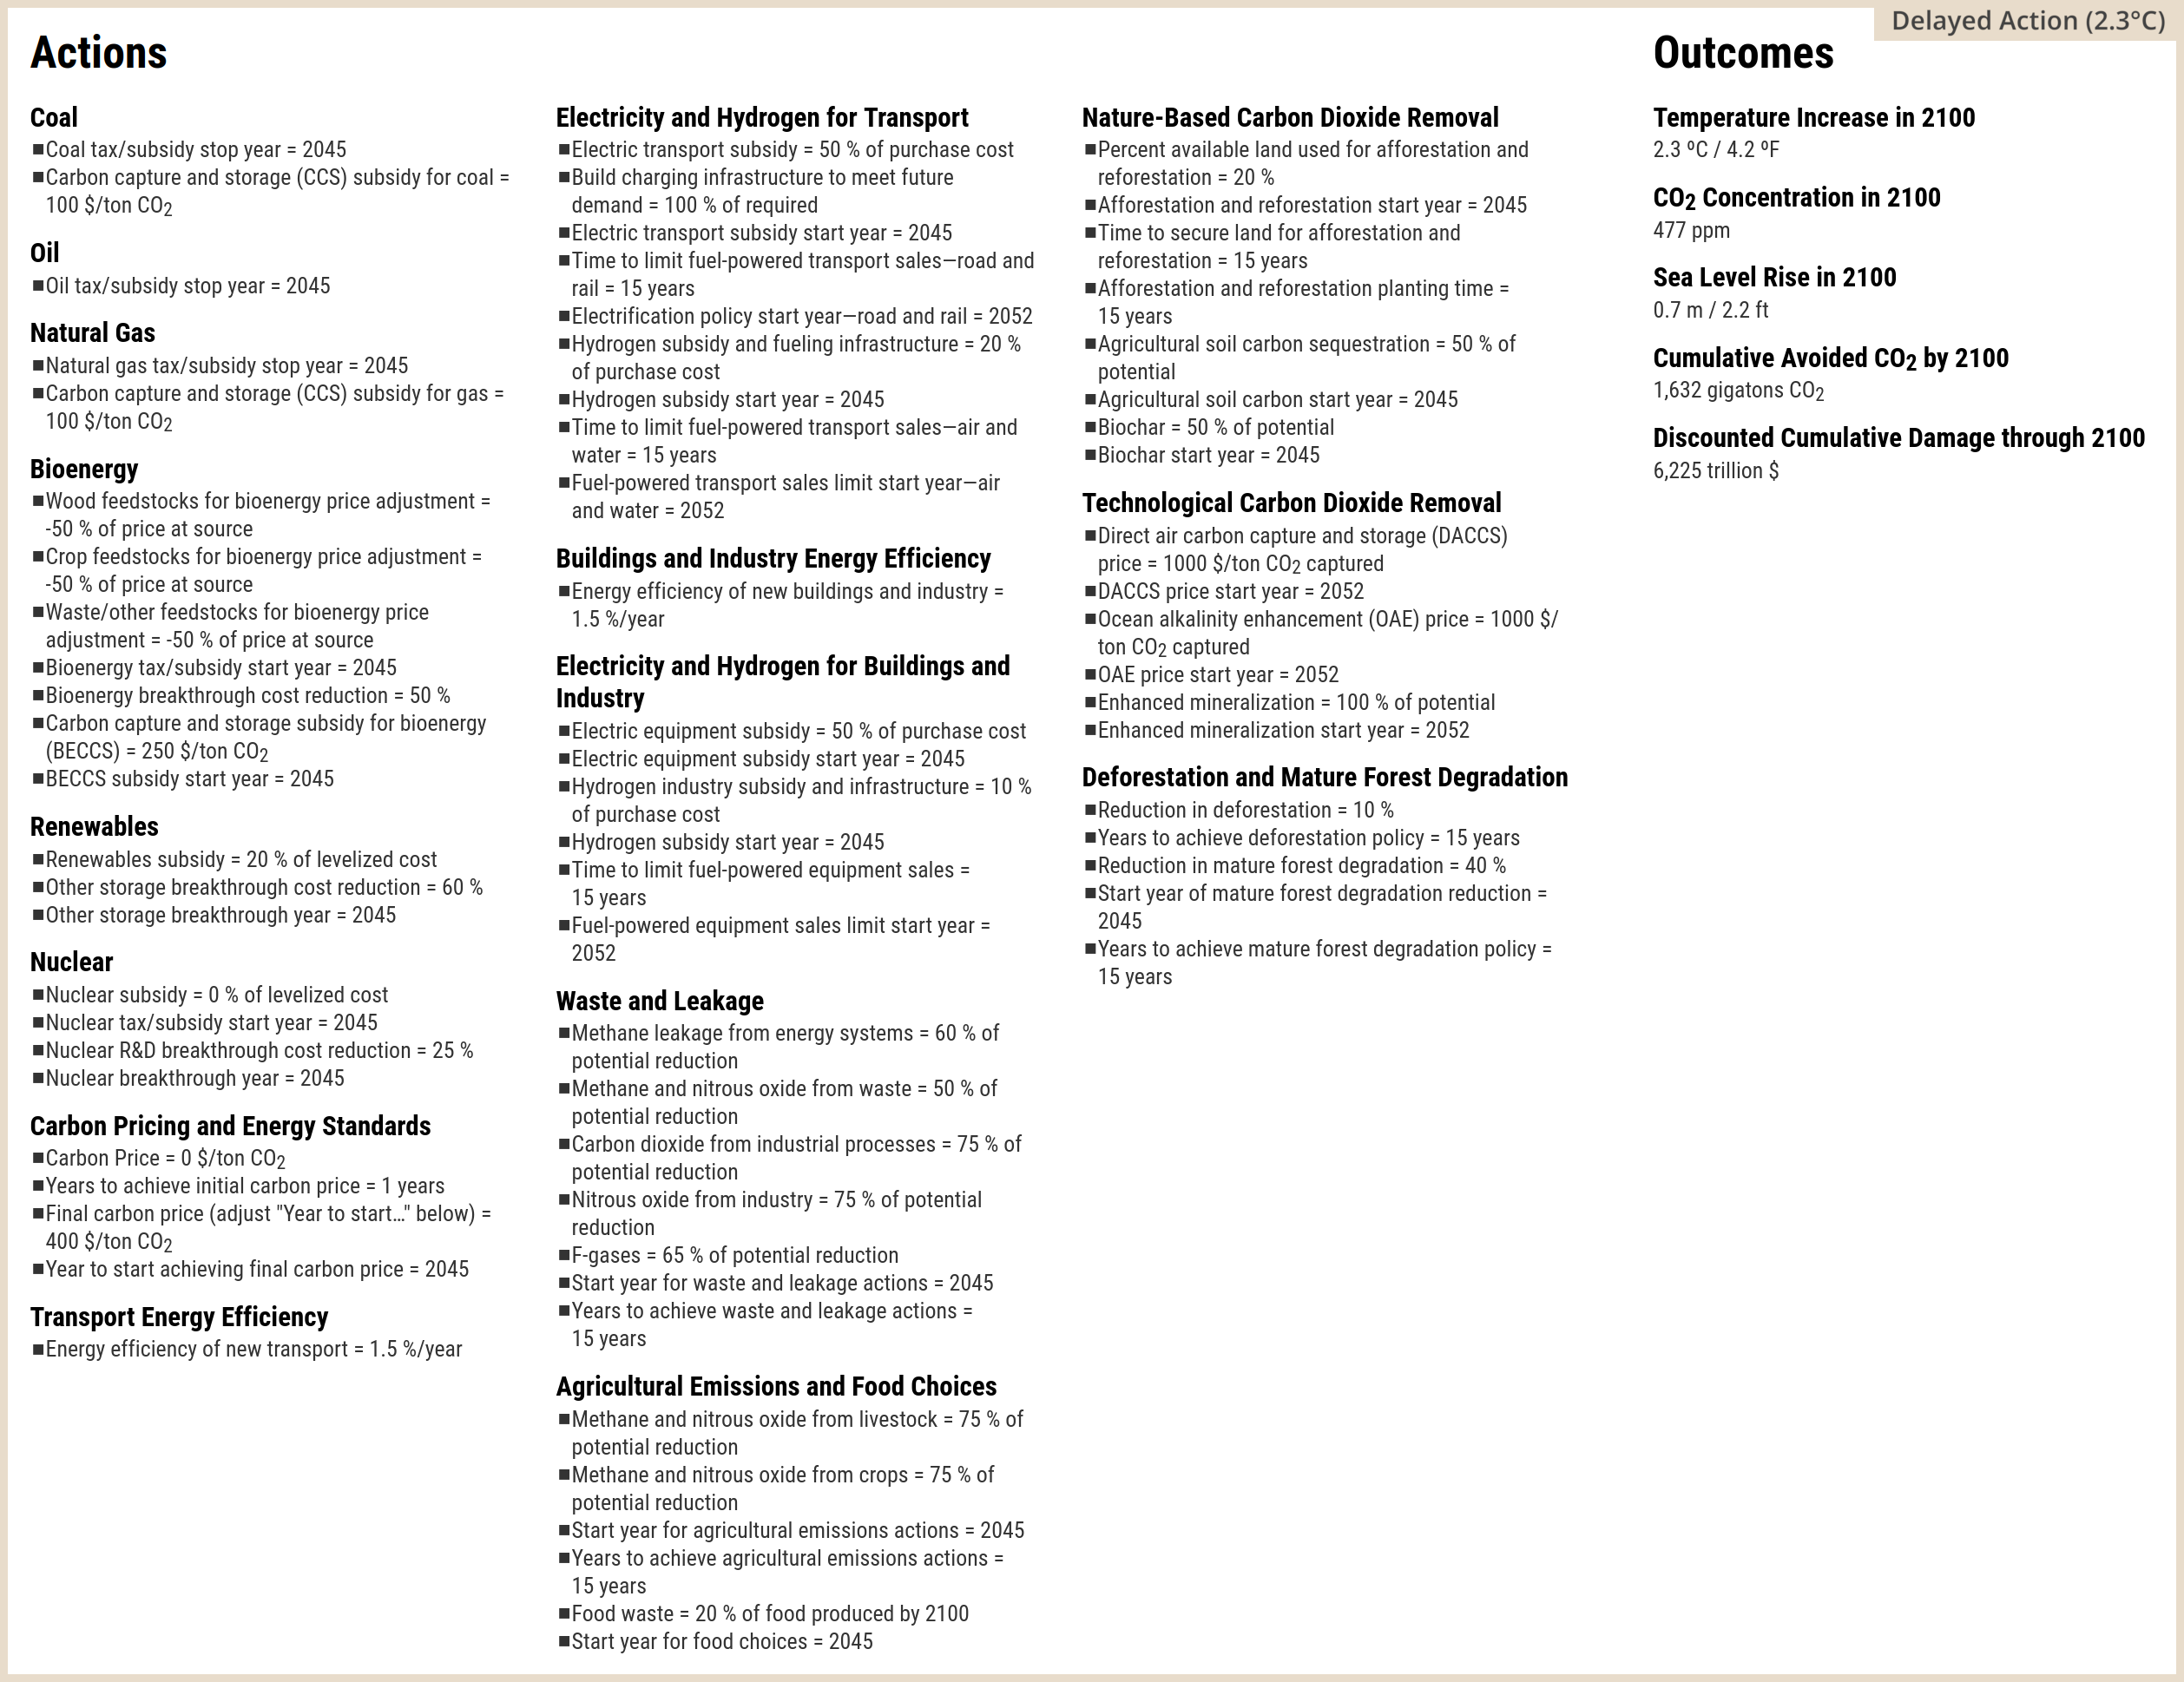
Source: Climate Interactive & MIT Sloan (2026) En-ROADS Simulator (Version 26.8.0)
Side by side: early transformative action vs. delayed and insufficient action
This section compares plots for two custom En-ROADS scenarios: 1.5°C by 2100 and 2.3°C by 2100.
This is an early version of this post:
- The two scenarios haven’t been explained properly yet and the En-ROADS plots in this section haven’t been arranged properly yet
- Some of the plots below won’t remain on the website, but they’re food for thought in the meantime. They were collected together to ensure that they came from the same version of the En-ROADS simulator
Explanations of the scientific basis of the simulations with references are available on En-ROADS Climate Solutions Simulator site and in the settings menus.
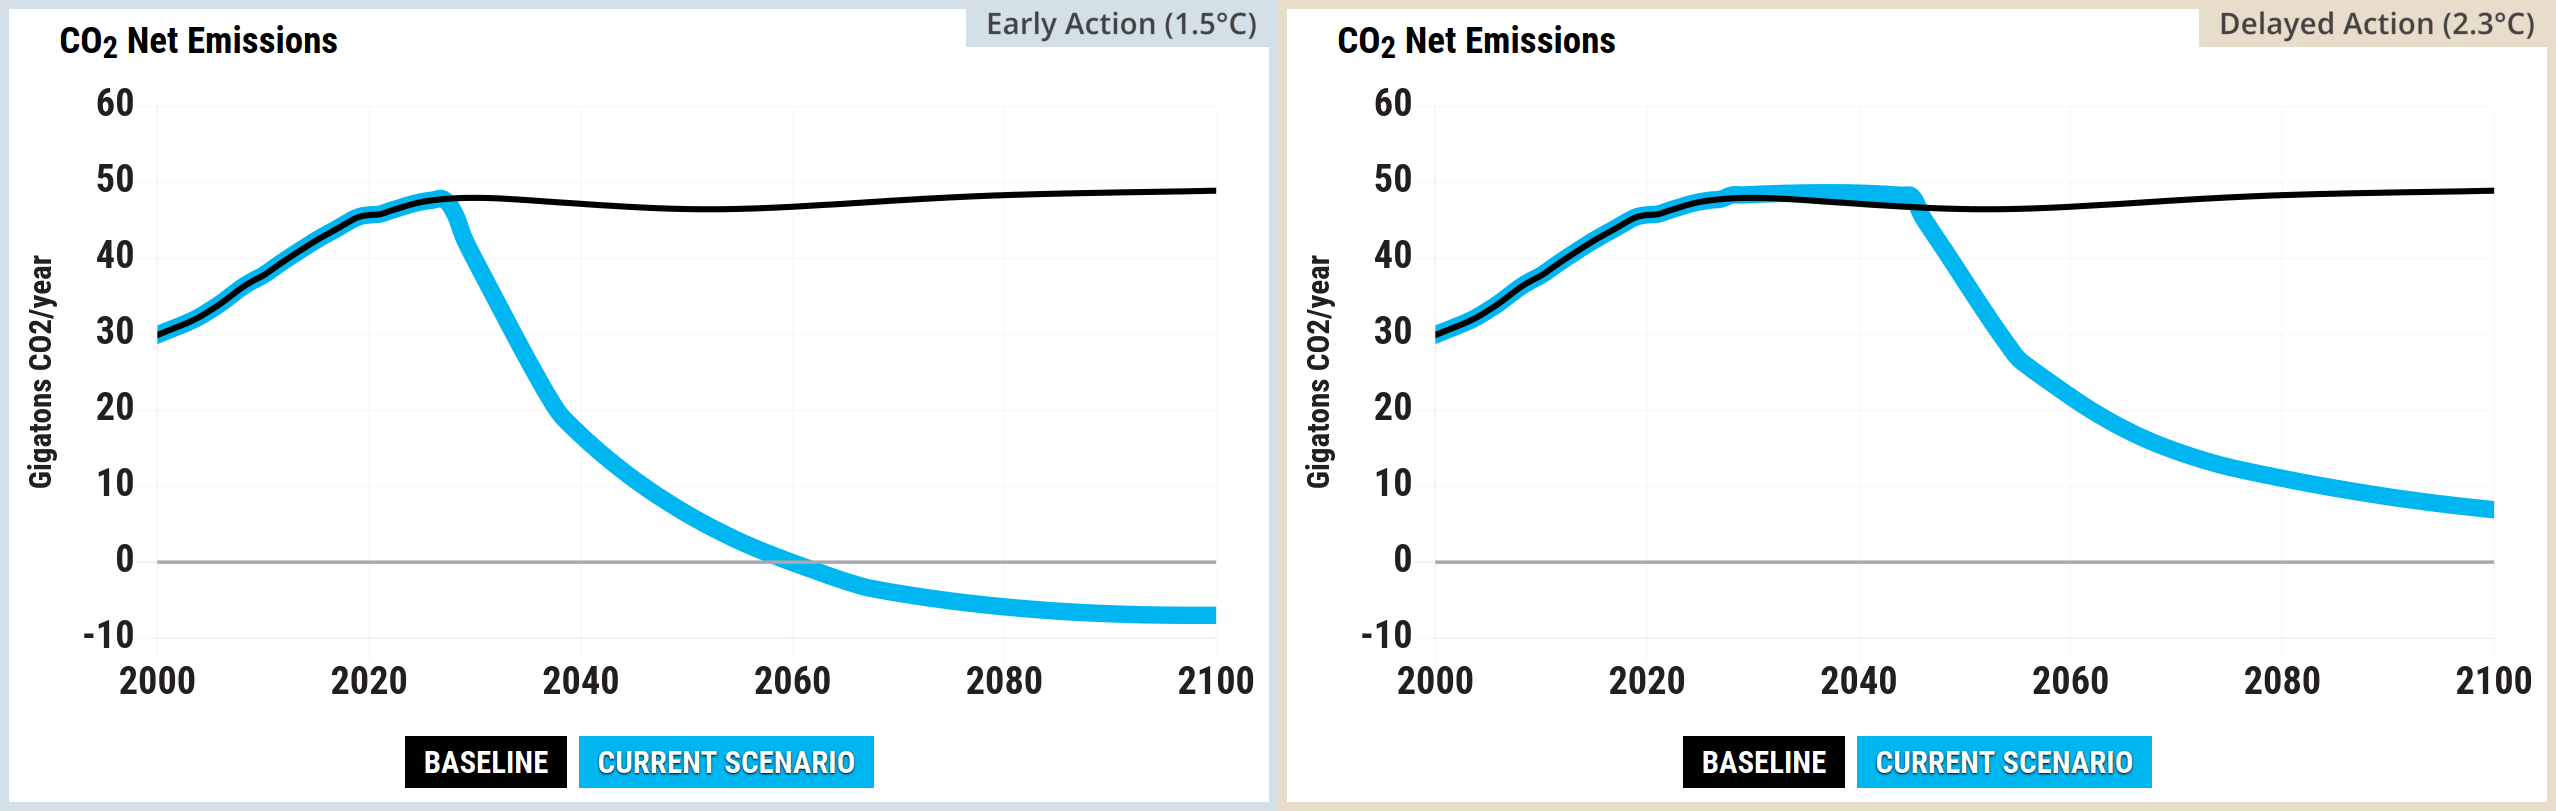
Source: Climate Interactive & MIT Sloan (2026) En-ROADS Simulator (Version 26.8.0)
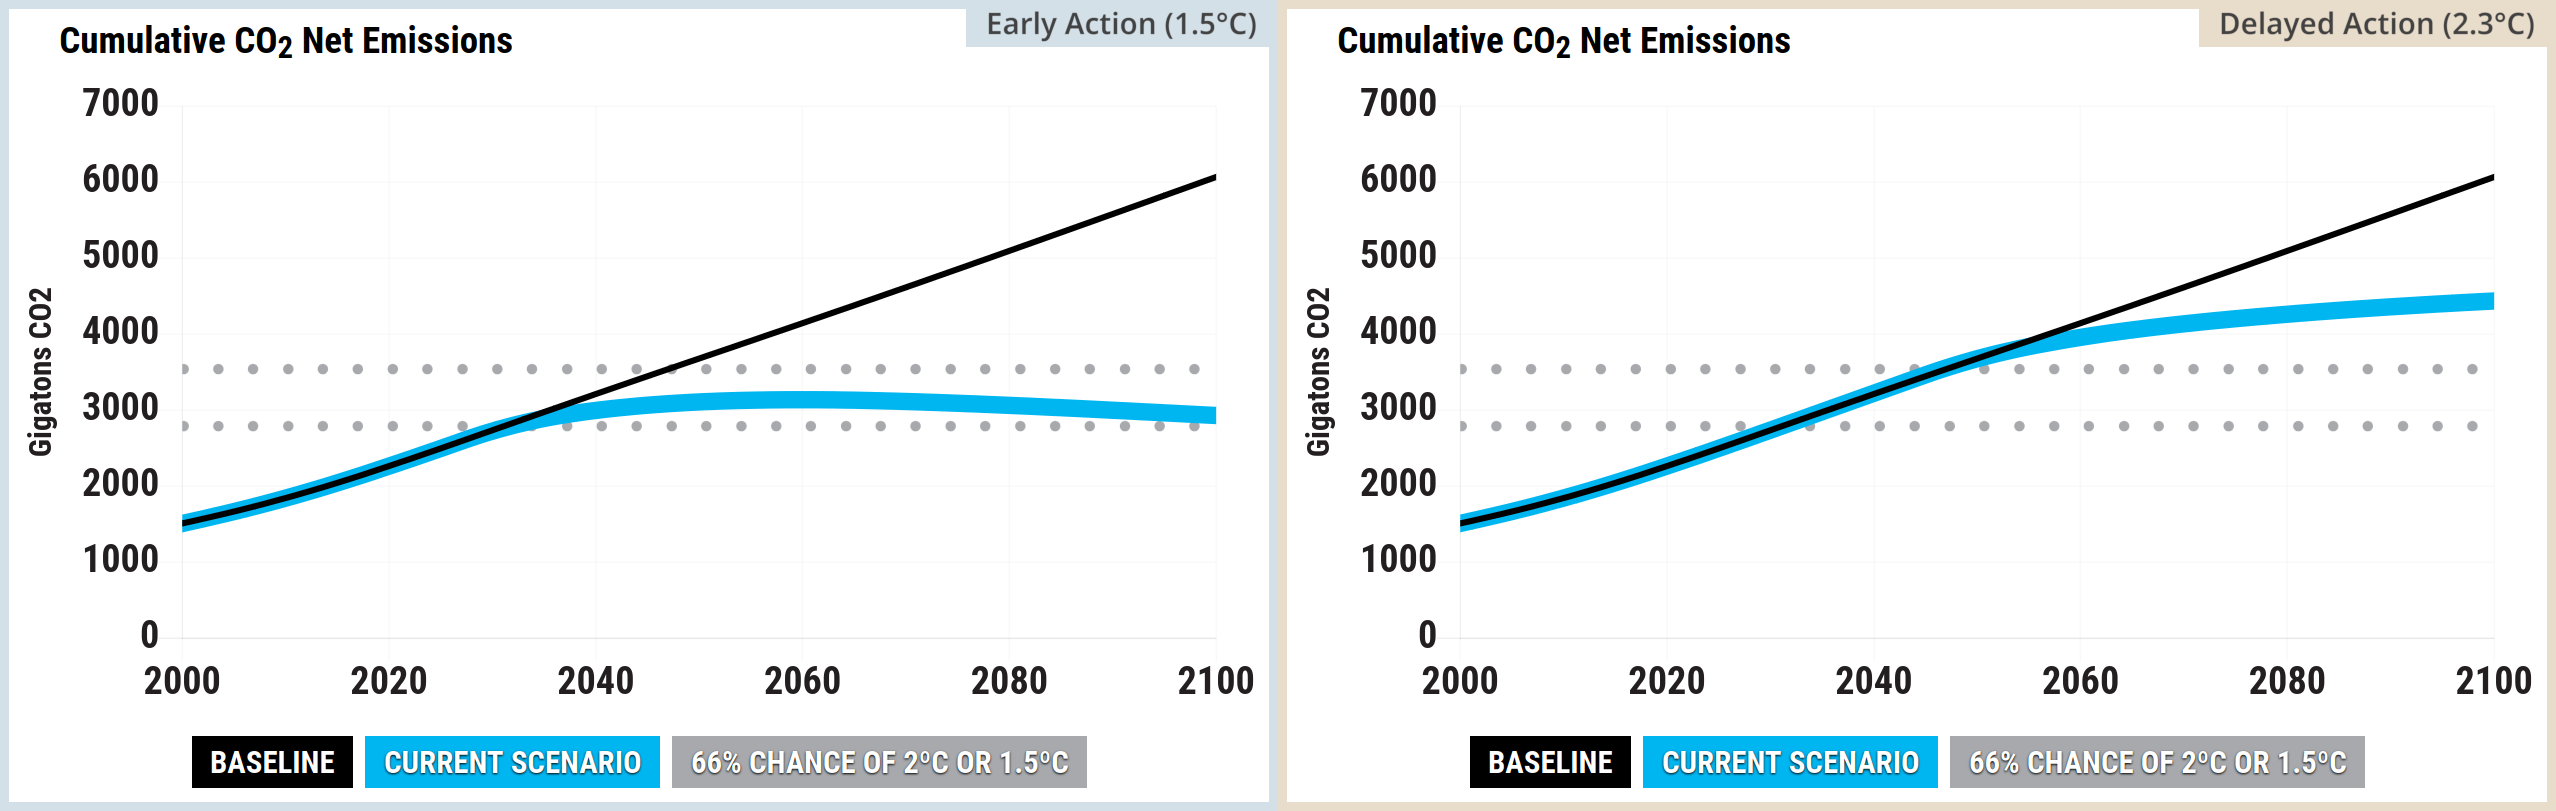
Source: Climate Interactive & MIT Sloan (2026) En-ROADS Simulator (Version 26.8.0)
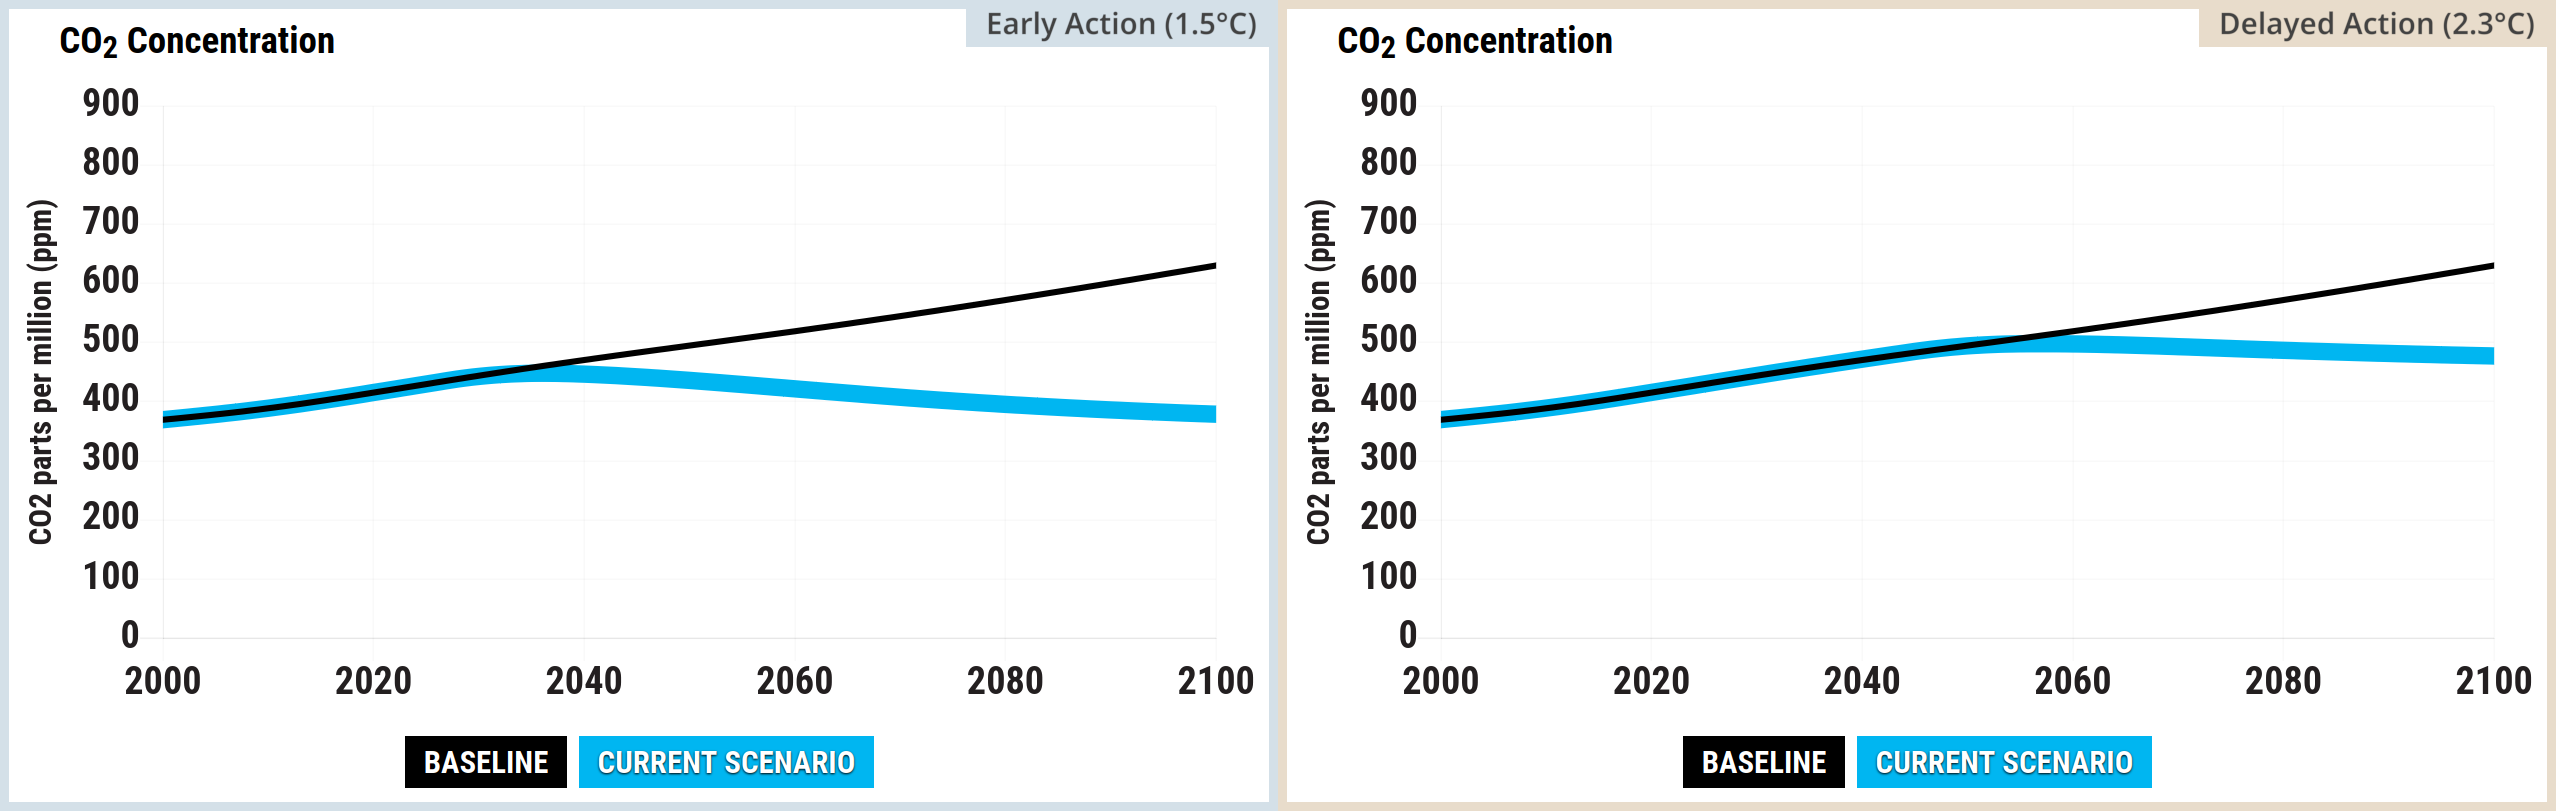
Source: Climate Interactive & MIT Sloan (2026) En-ROADS Simulator (Version 26.8.0)
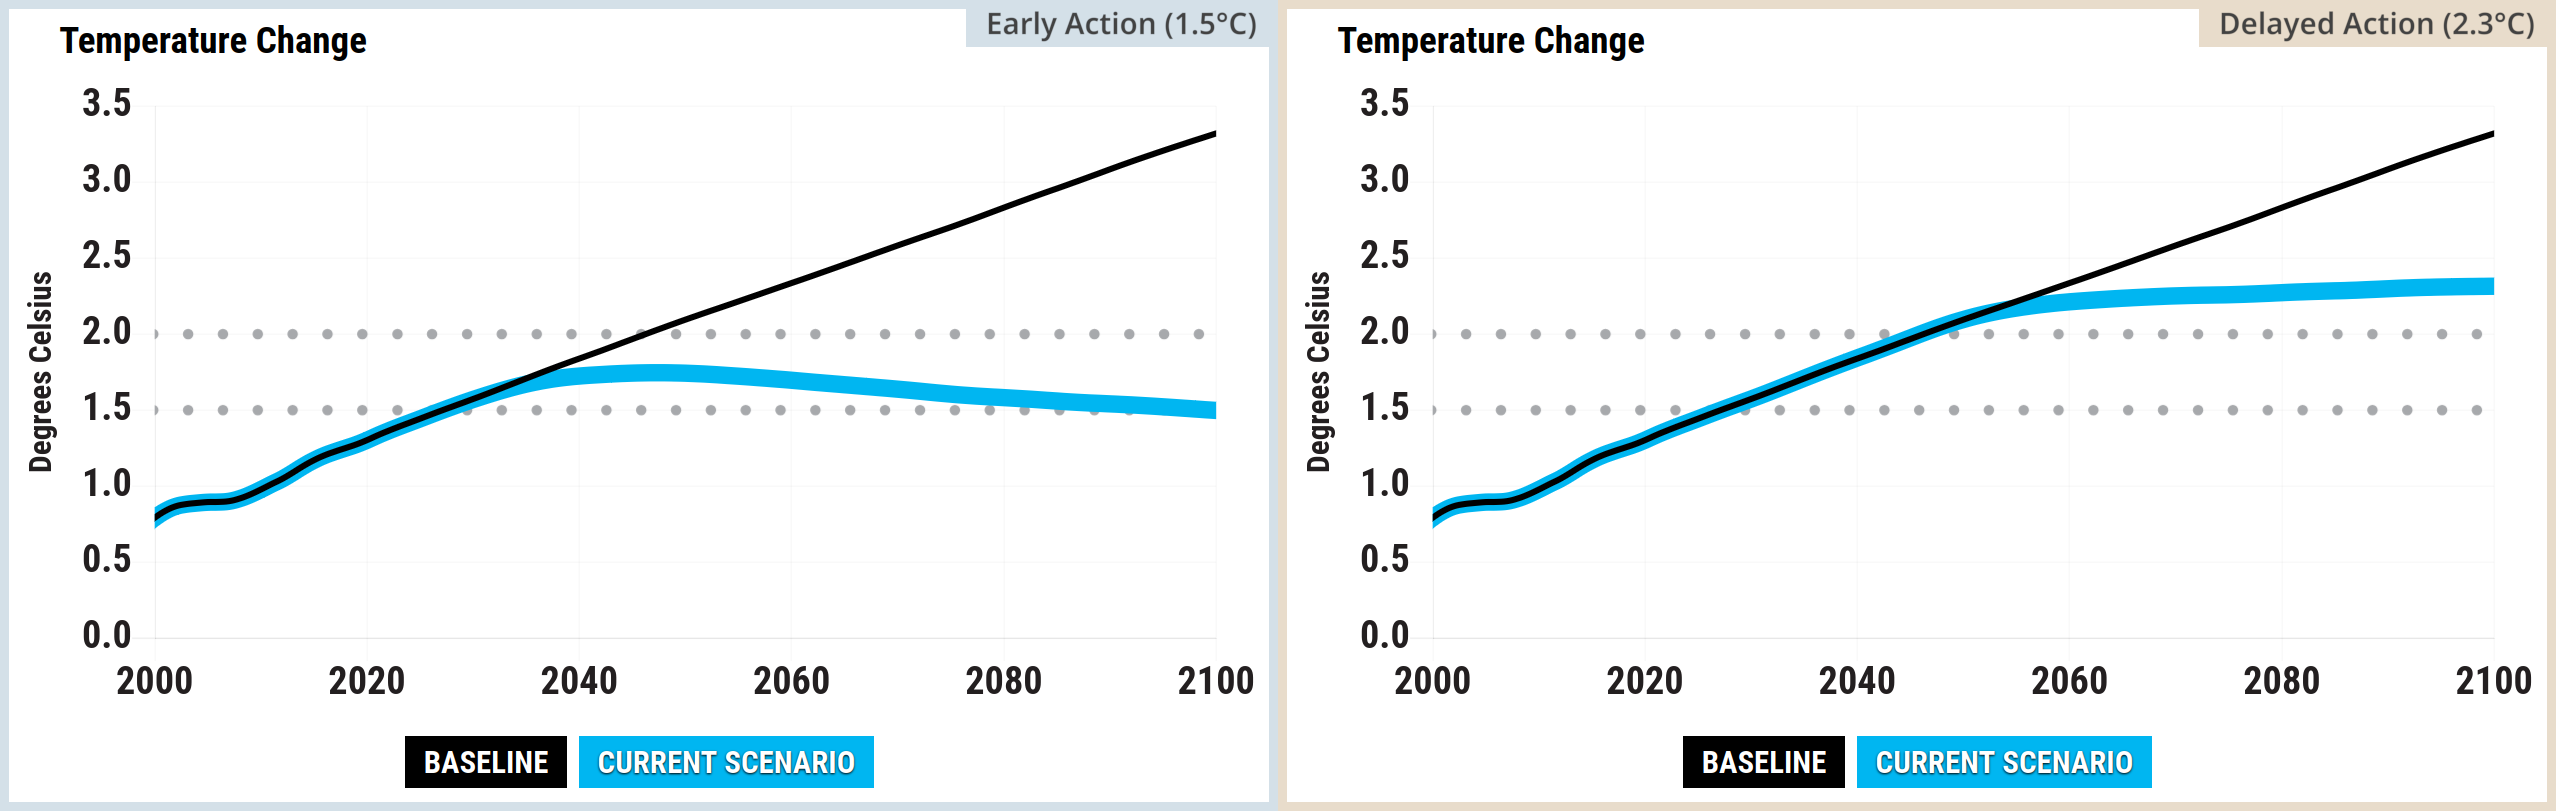
Source: Climate Interactive & MIT Sloan (2026) En-ROADS Simulator (Version 26.8.0)
Kaya graphs
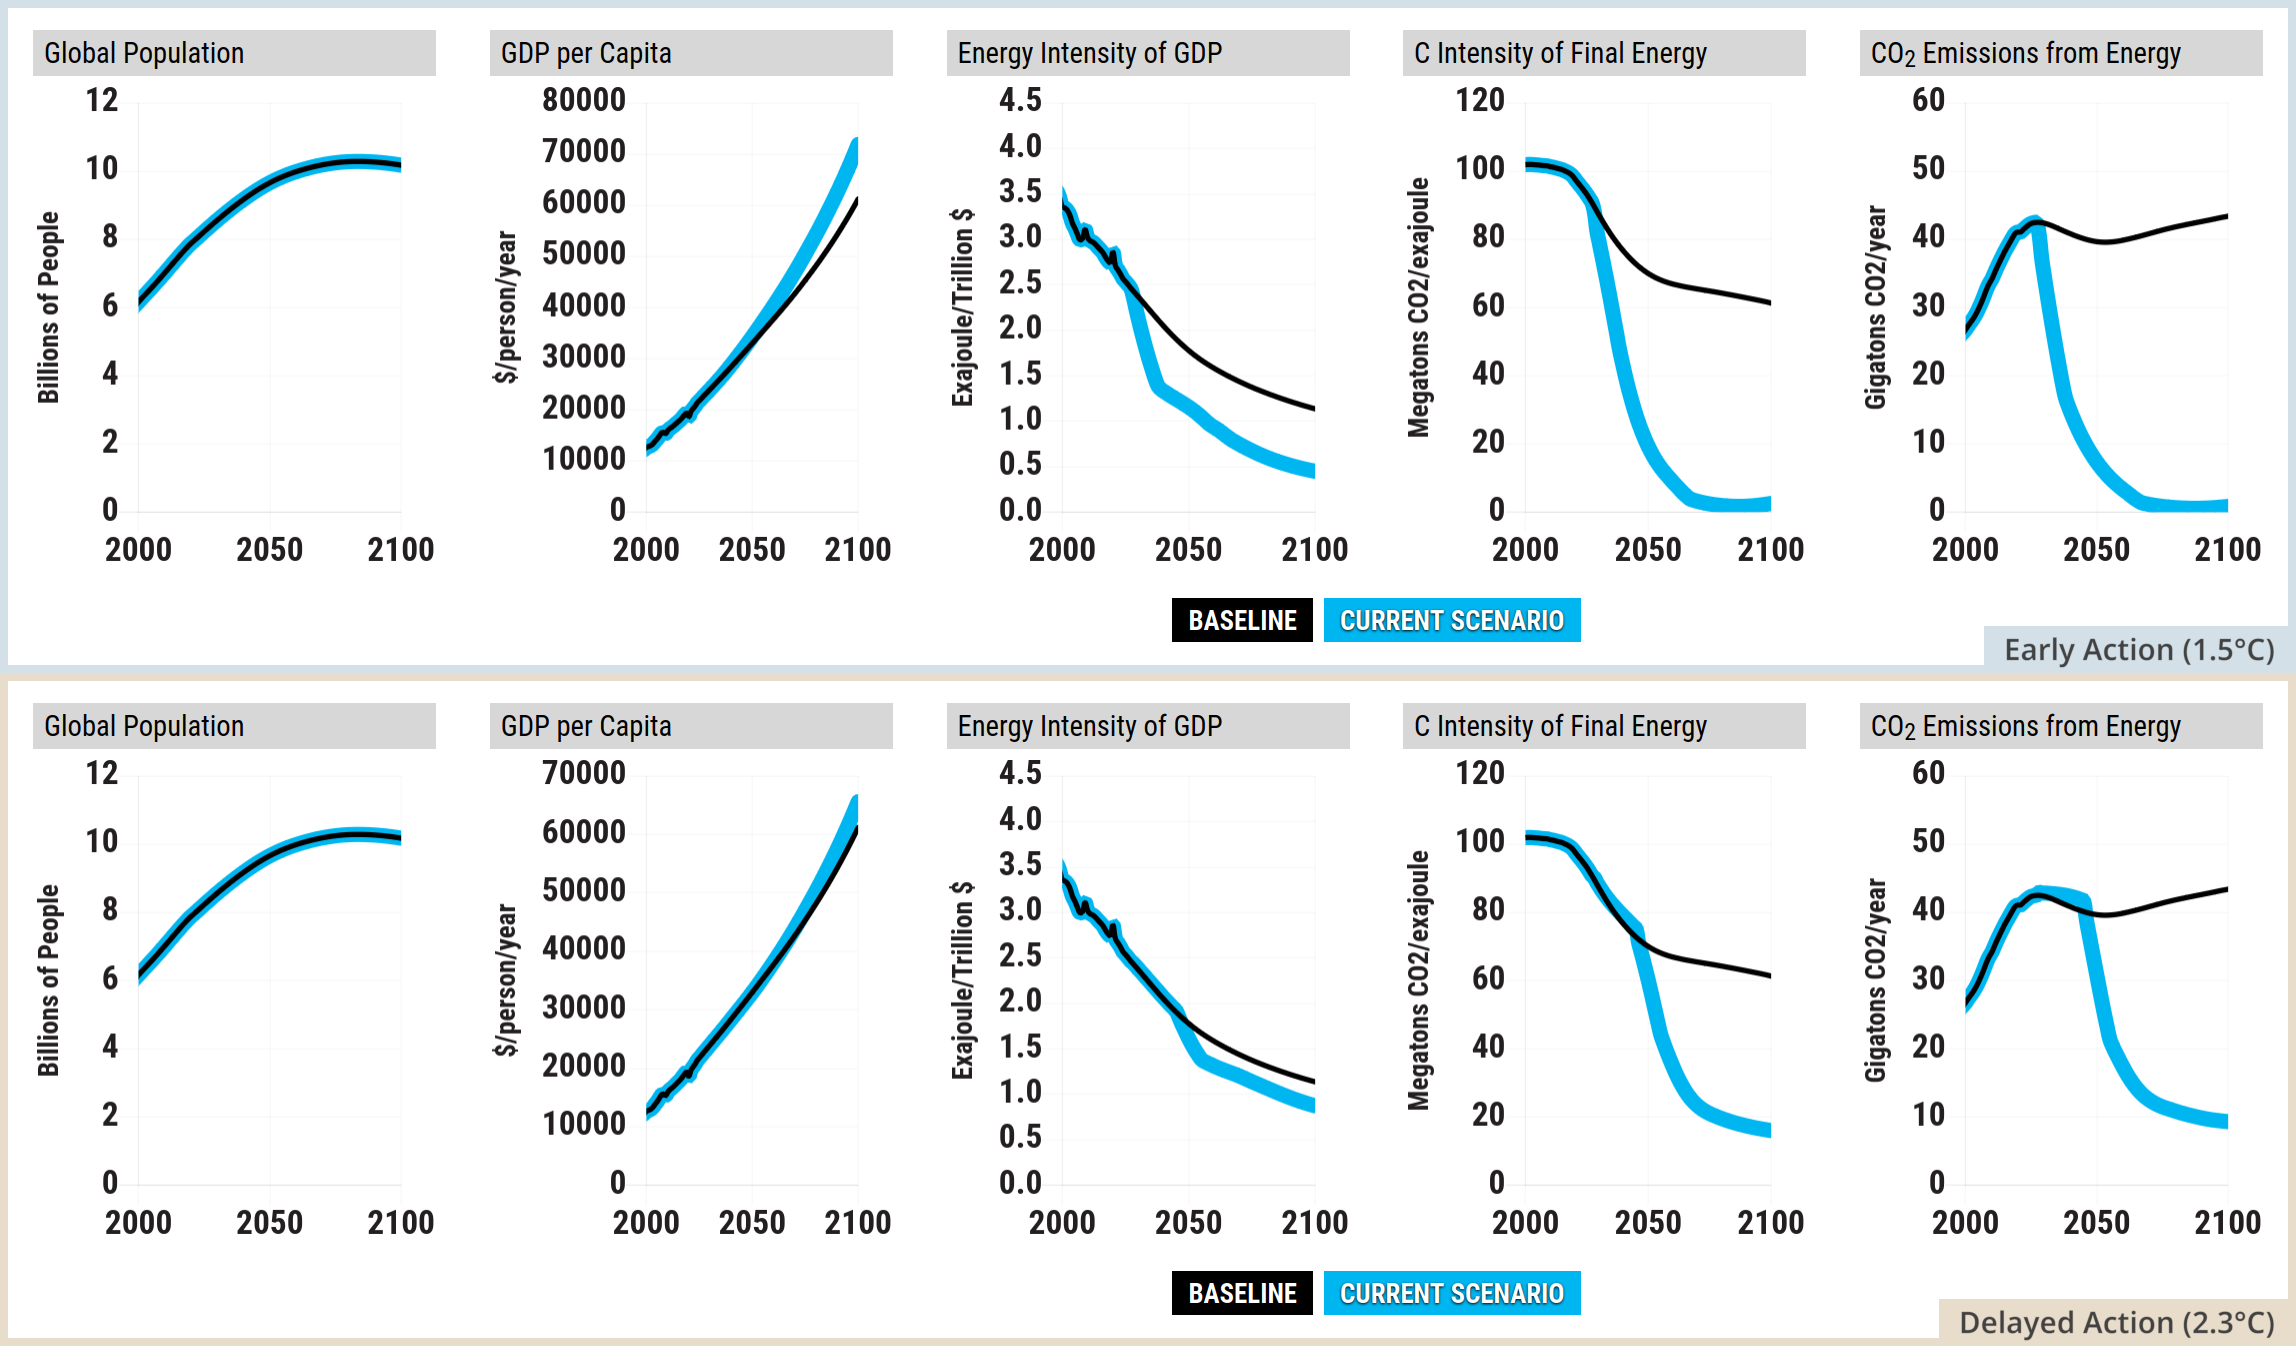
Source: Climate Interactive & MIT Sloan (2026) En-ROADS Simulator (Version 26.8.0)
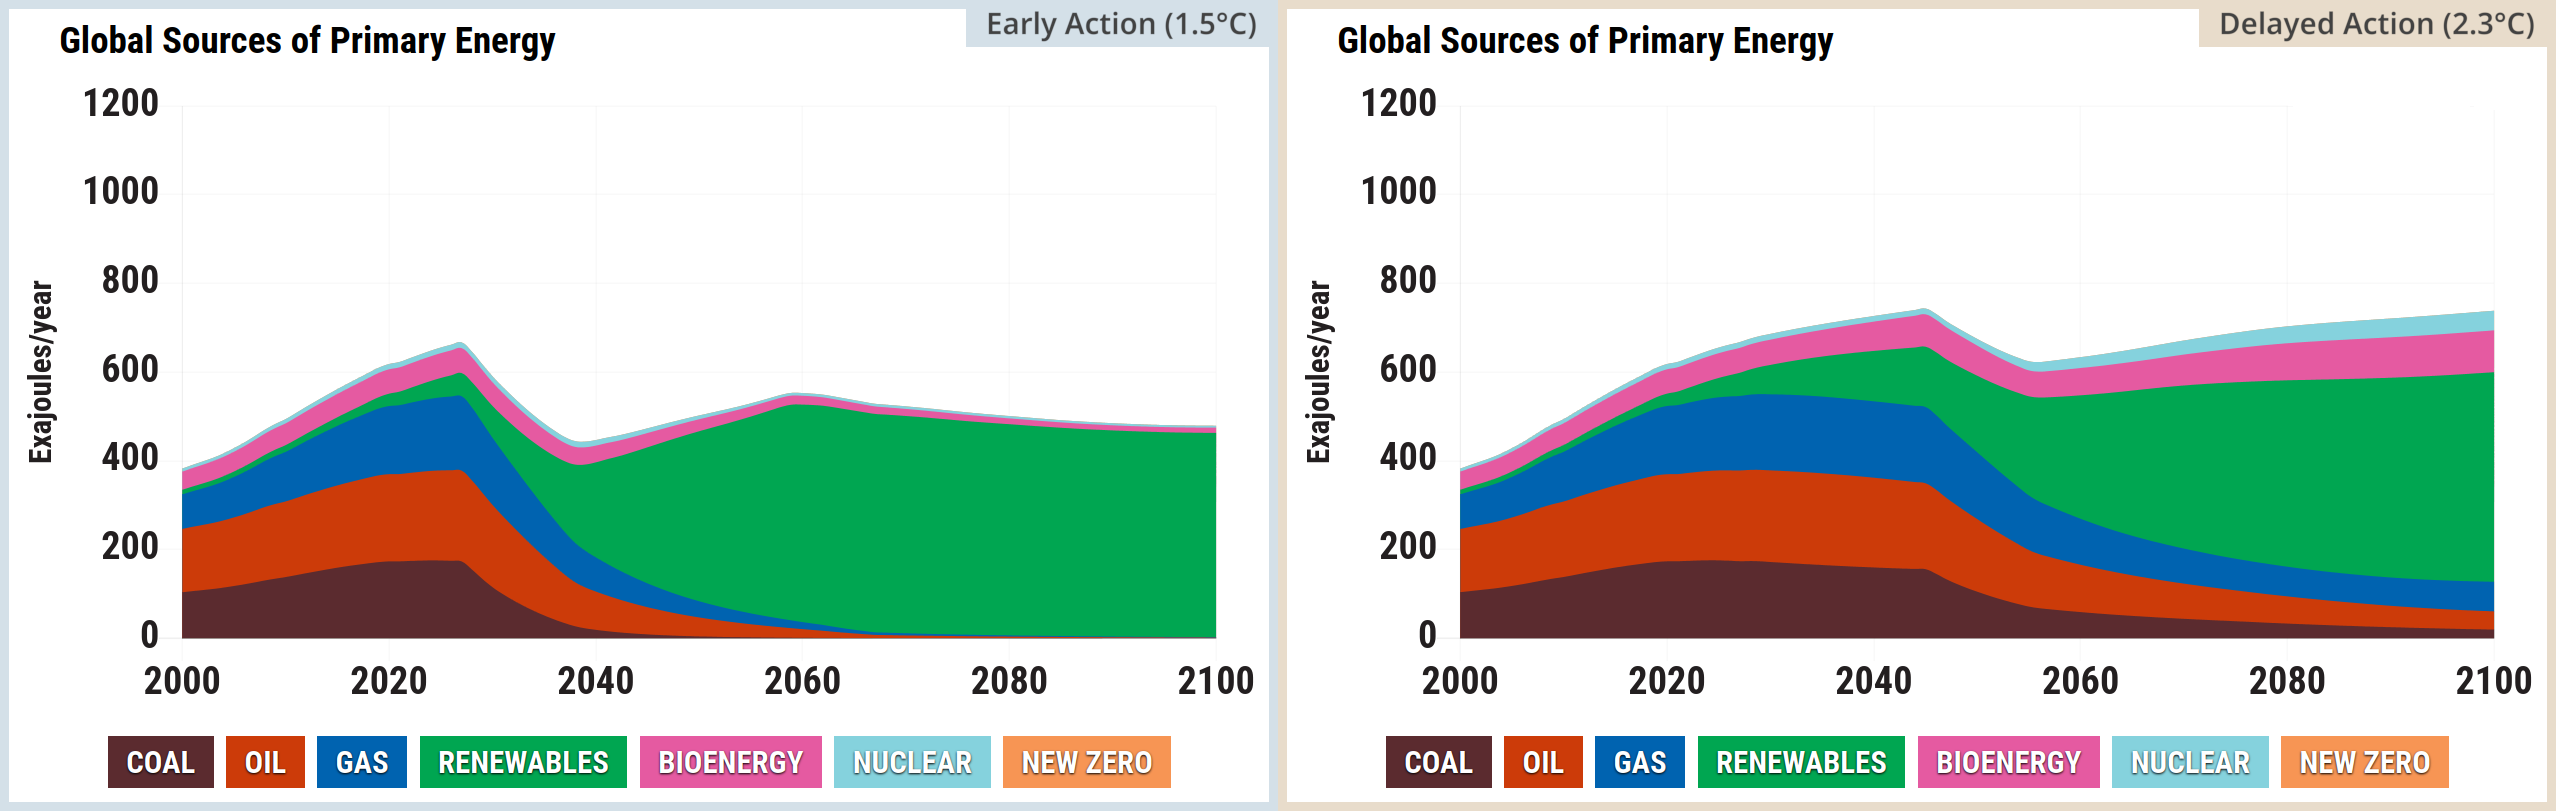
Source: Climate Interactive & MIT Sloan (2026) En-ROADS Simulator (Version 26.8.0)
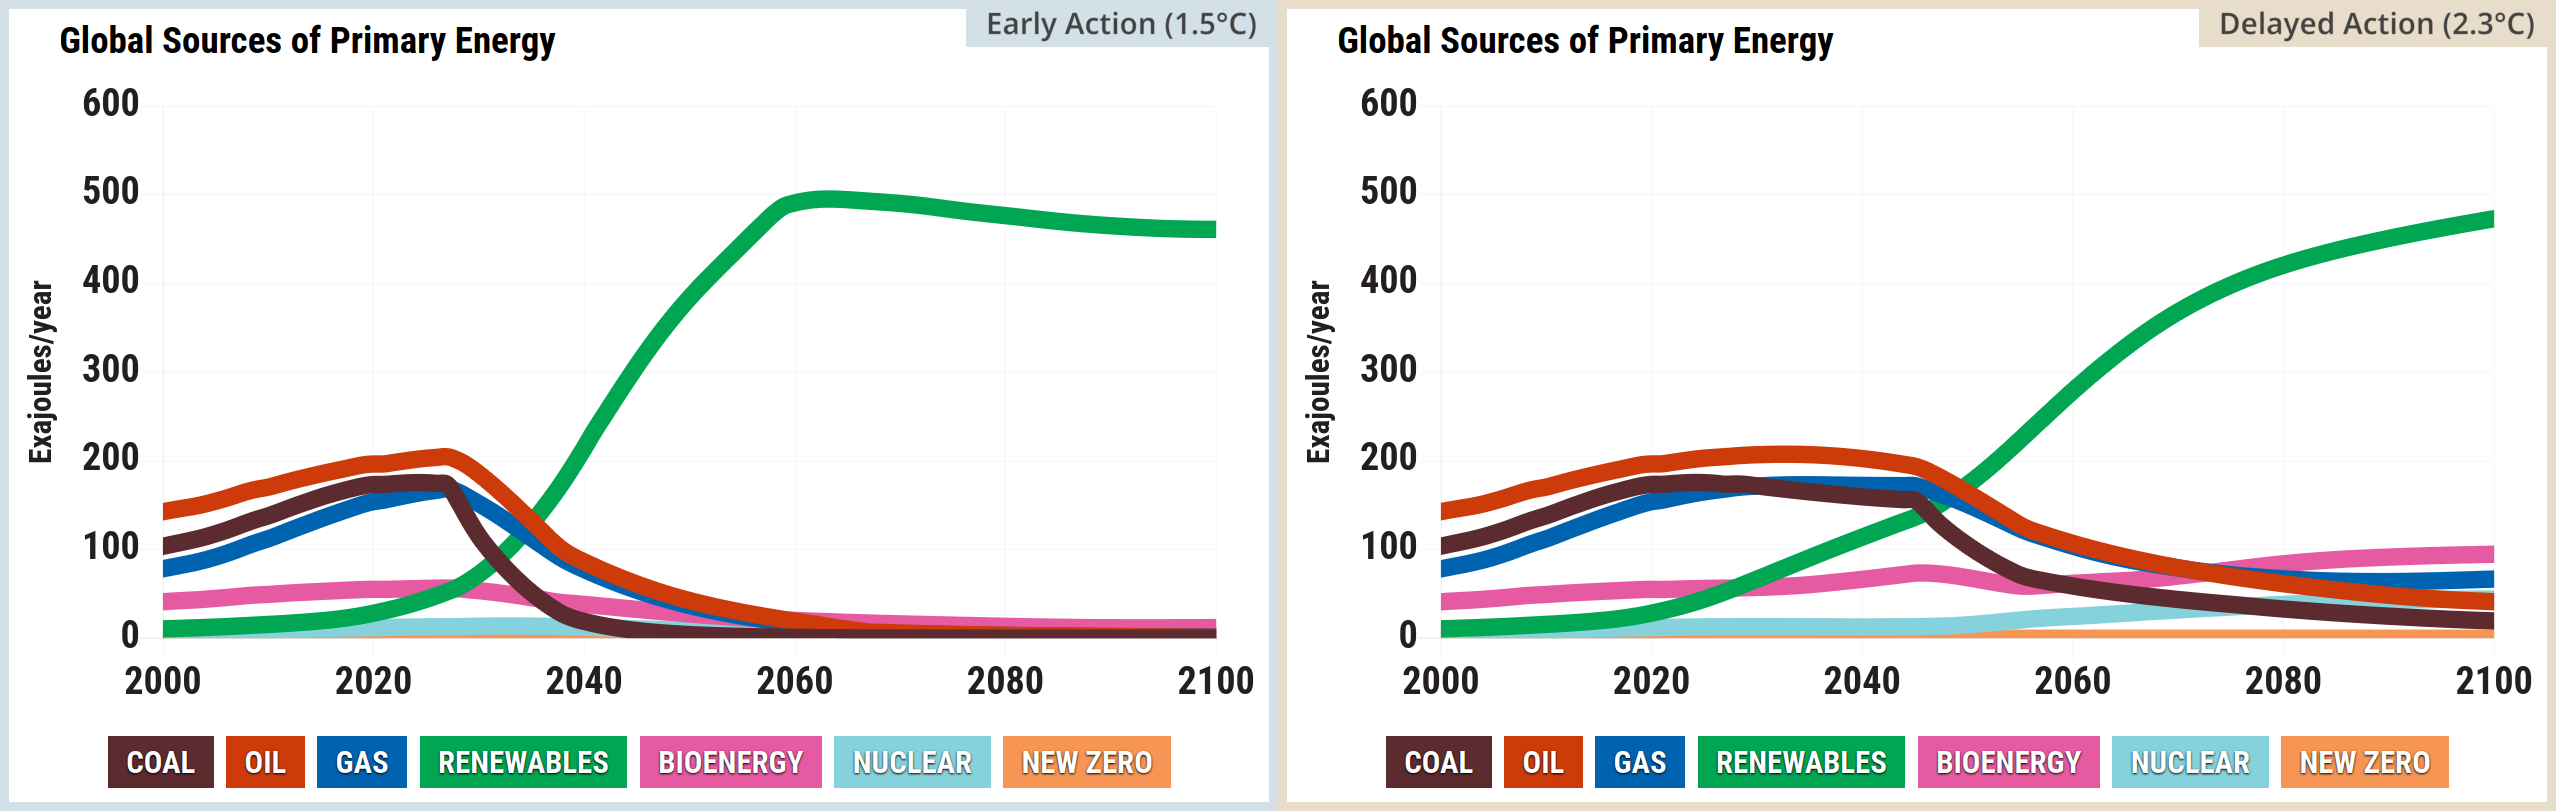
Source: Climate Interactive & MIT Sloan (2026) En-ROADS Simulator (Version 26.8.0)
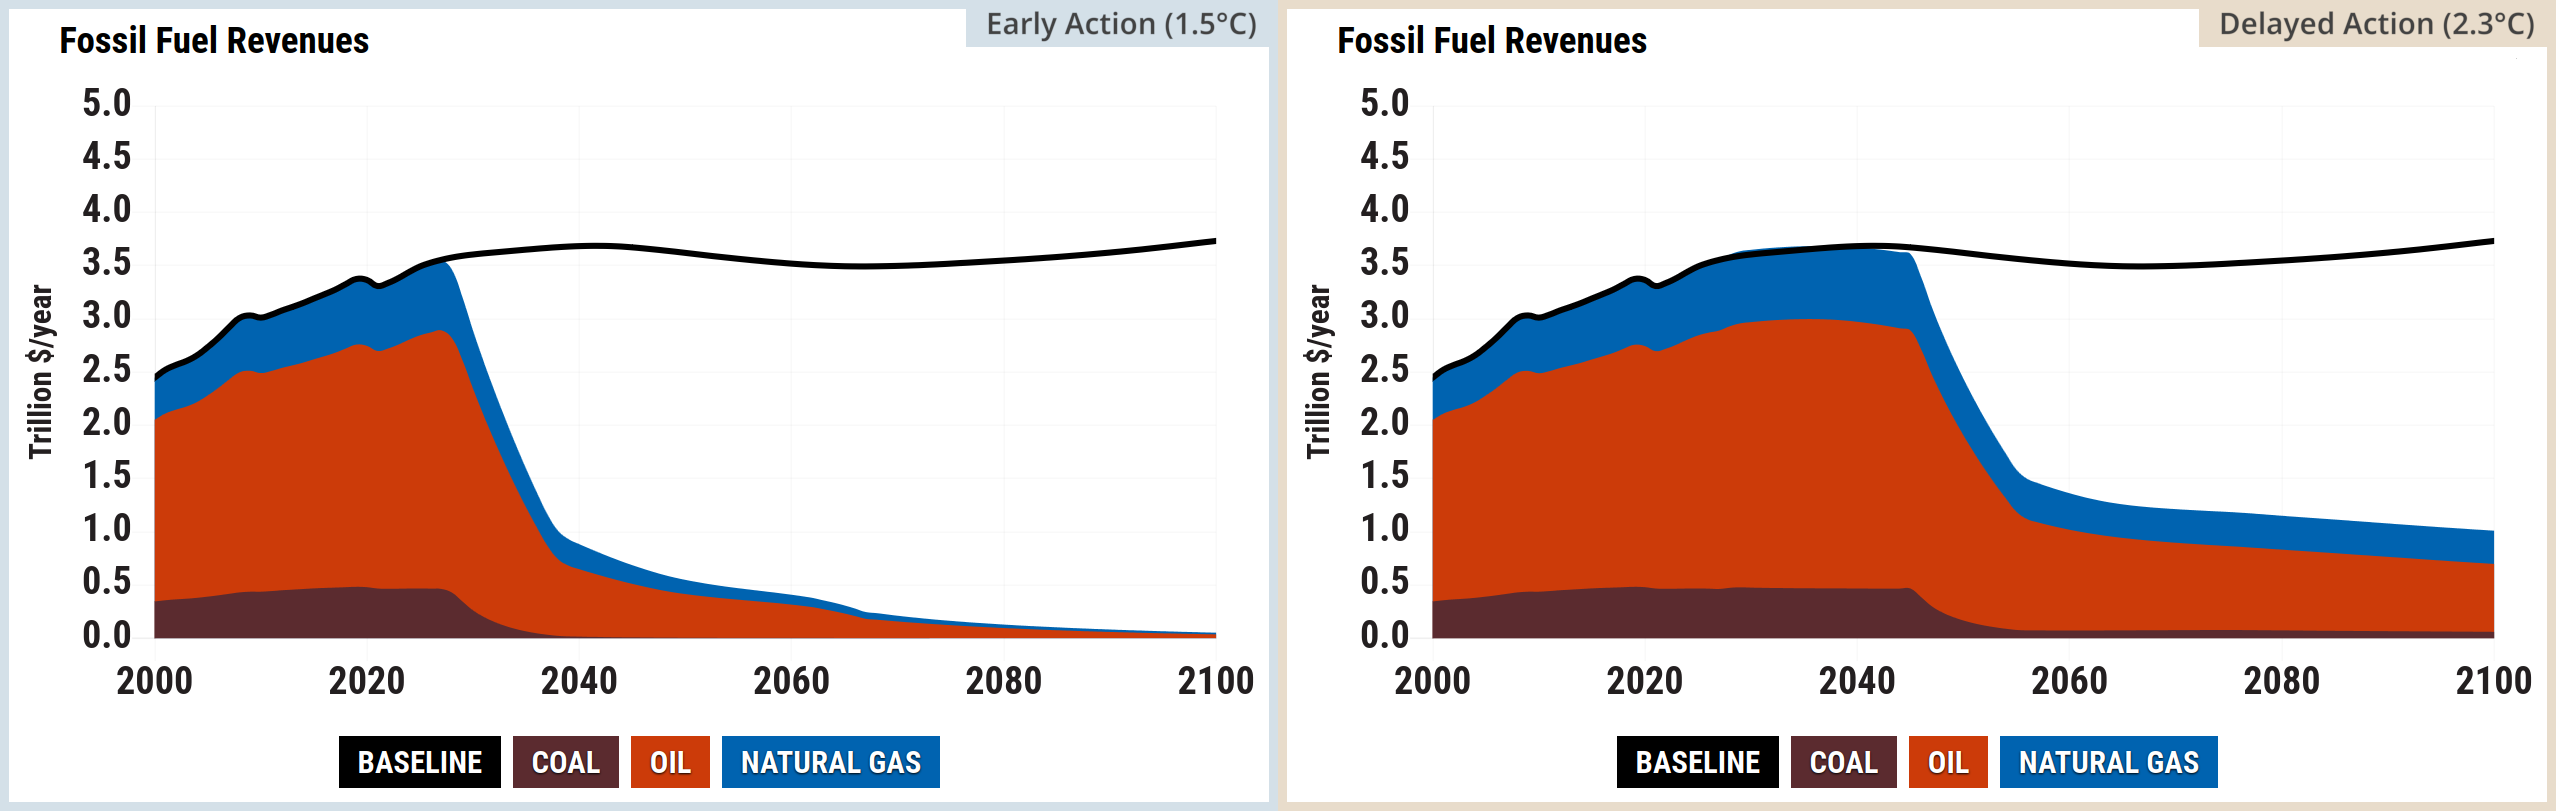
Source: Climate Interactive & MIT Sloan (2026) En-ROADS Simulator (Version 26.8.0)
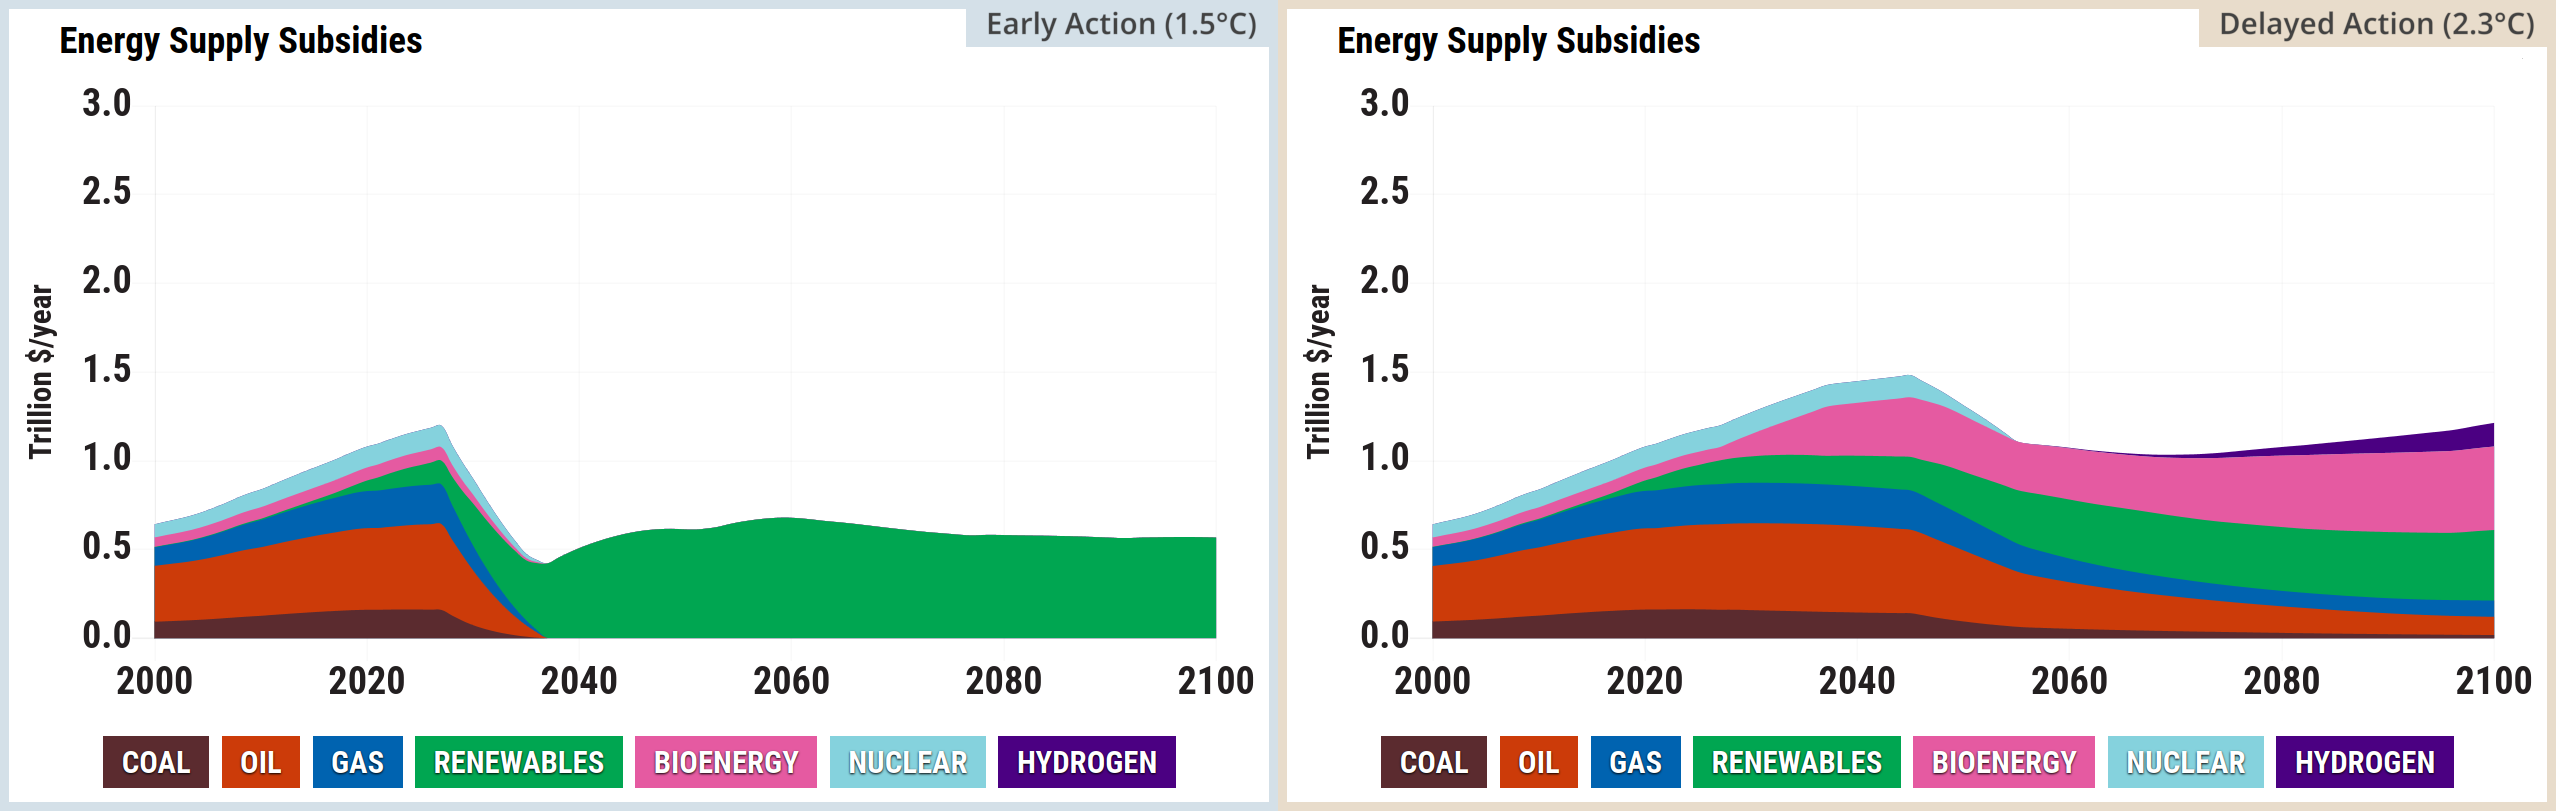
Source: Climate Interactive & MIT Sloan (2026) En-ROADS Simulator (Version 26.8.0)
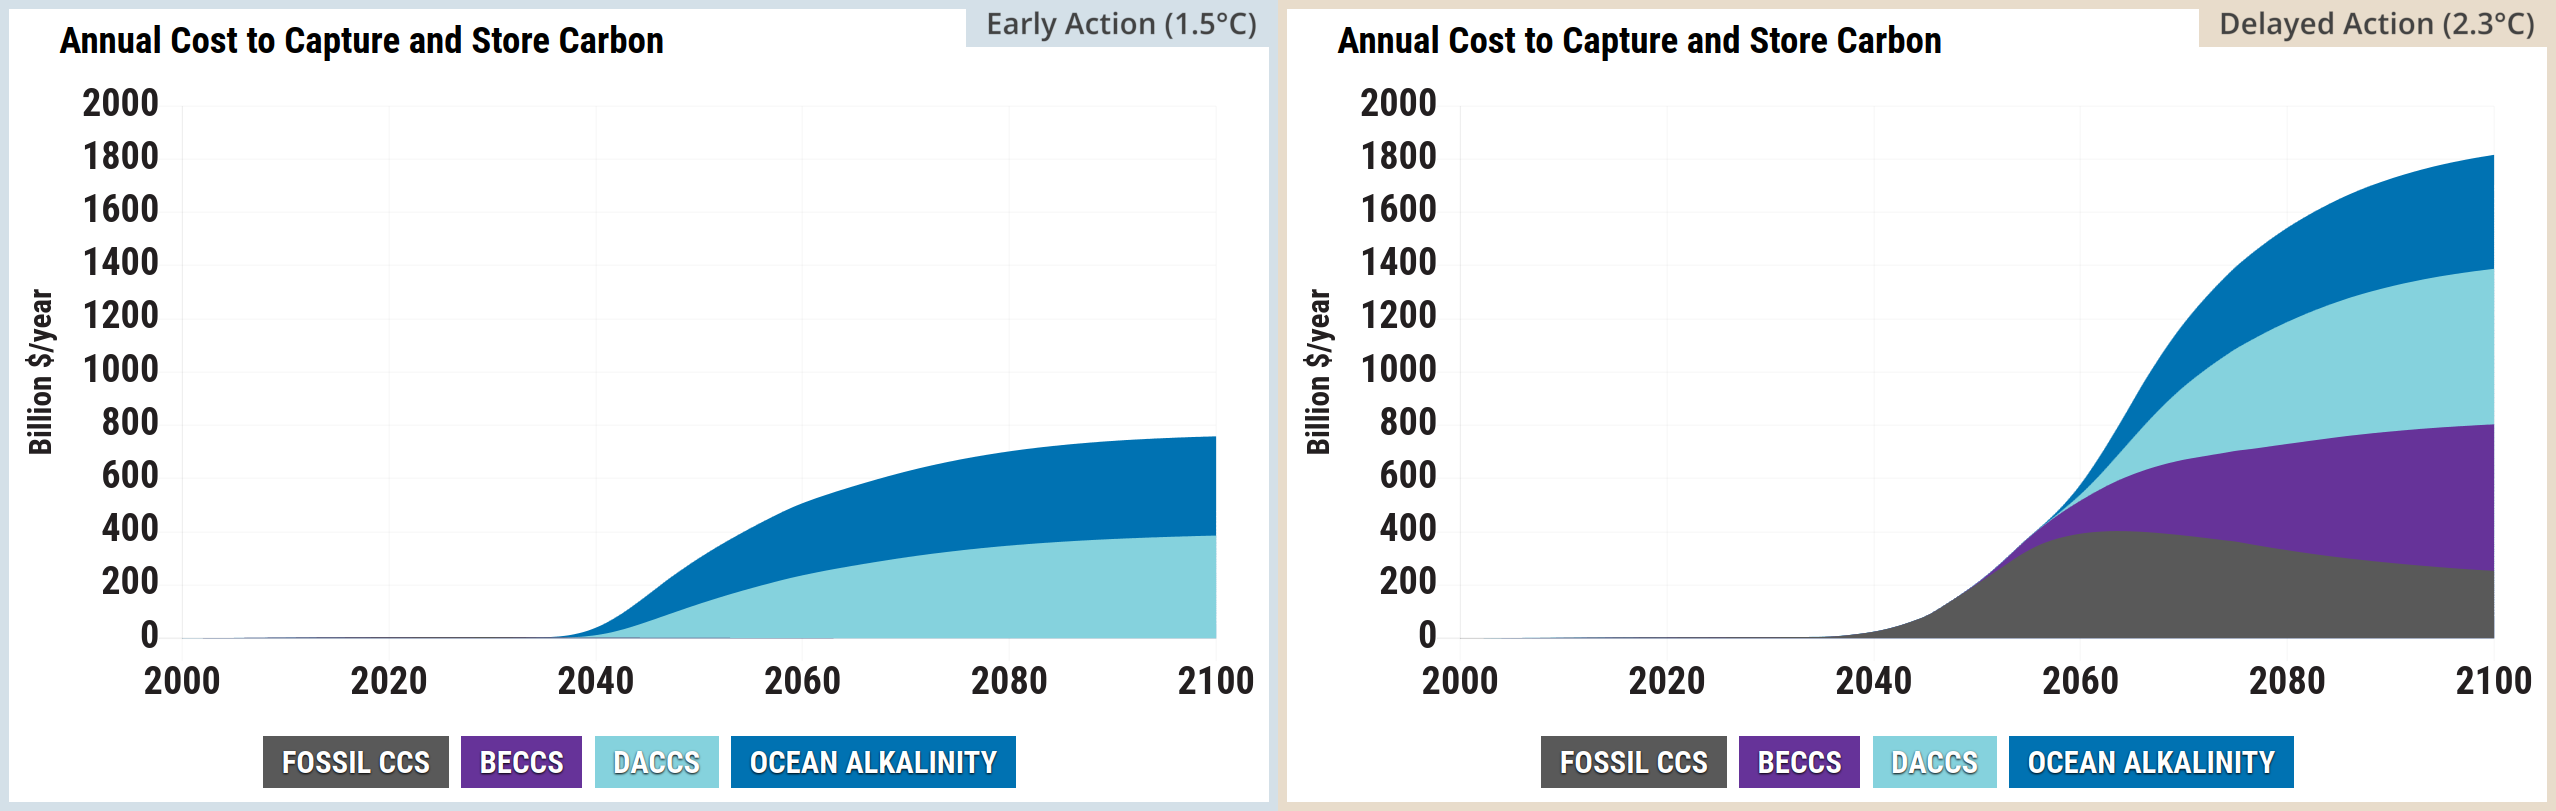
Source: Climate Interactive & MIT Sloan (2026) En-ROADS Simulator (Version 26.8.0)
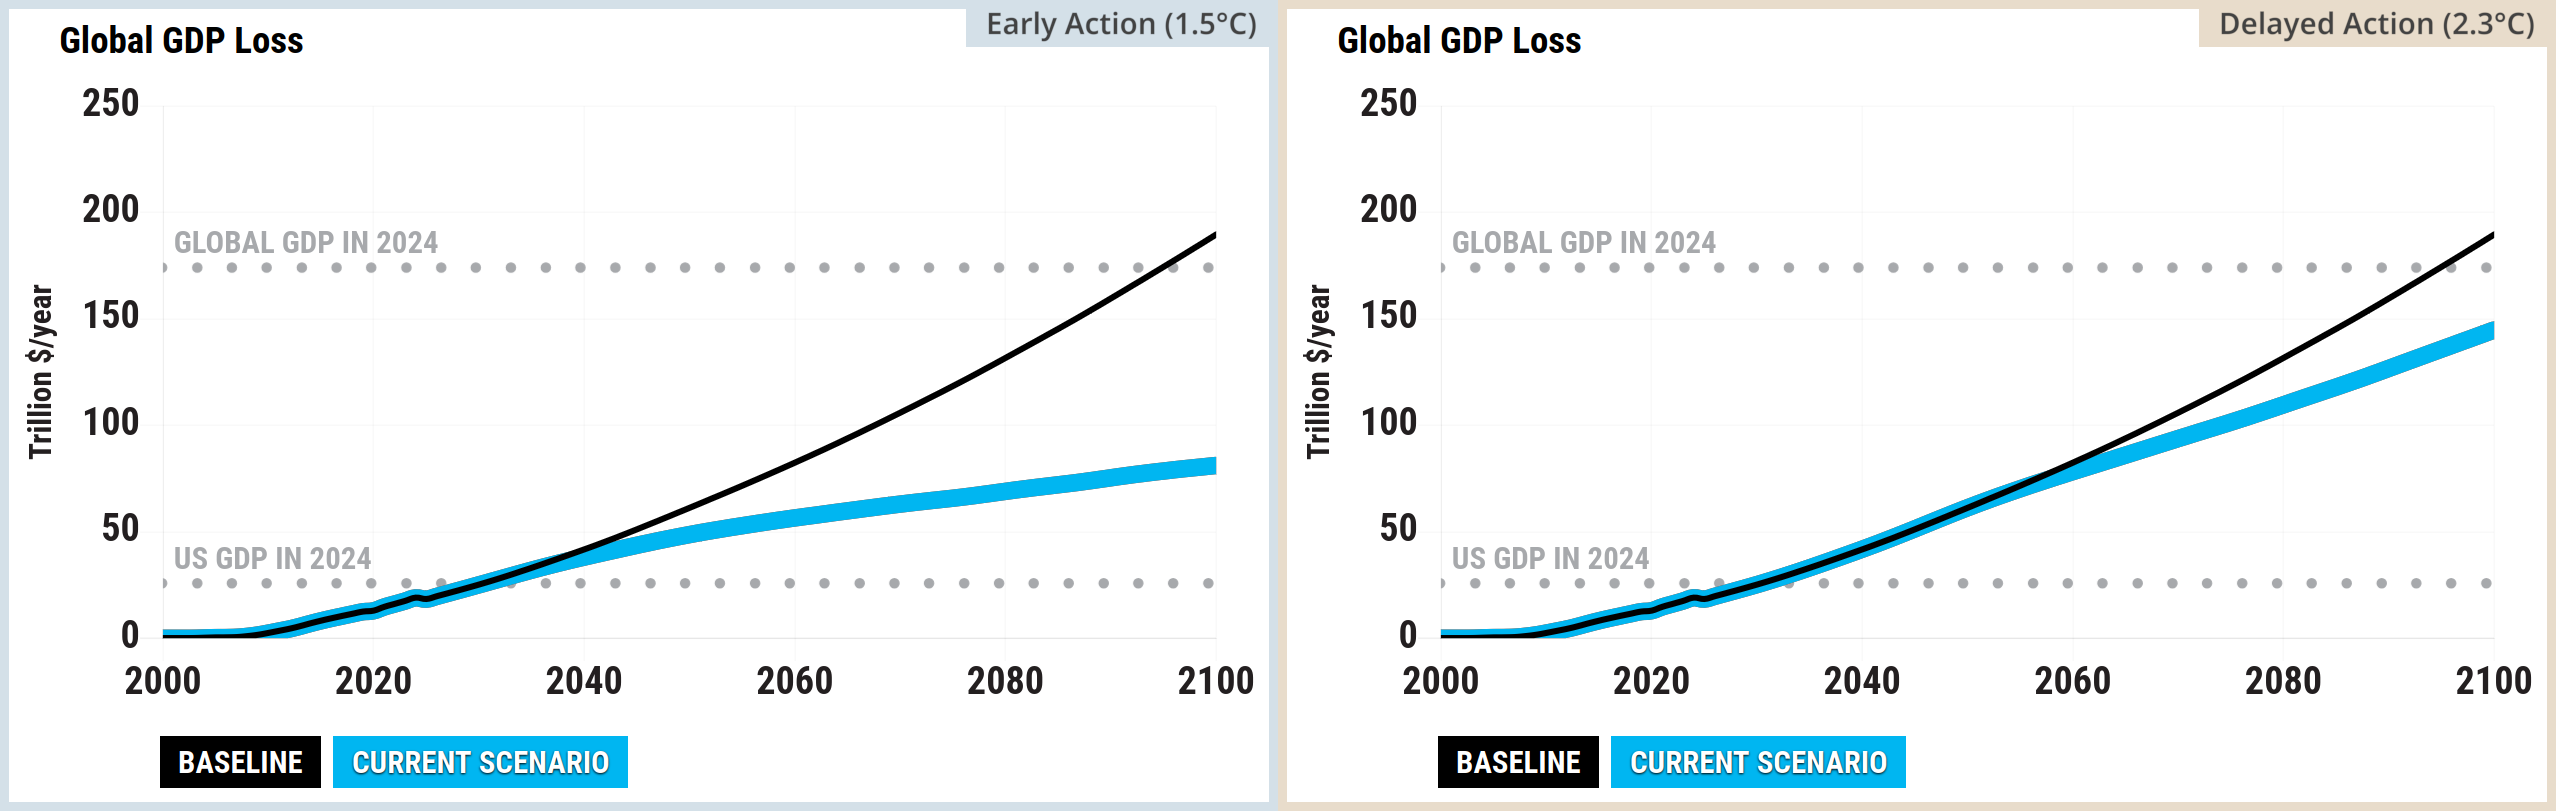
Source: Climate Interactive & MIT Sloan (2026) En-ROADS Simulator (Version 26.8.0)
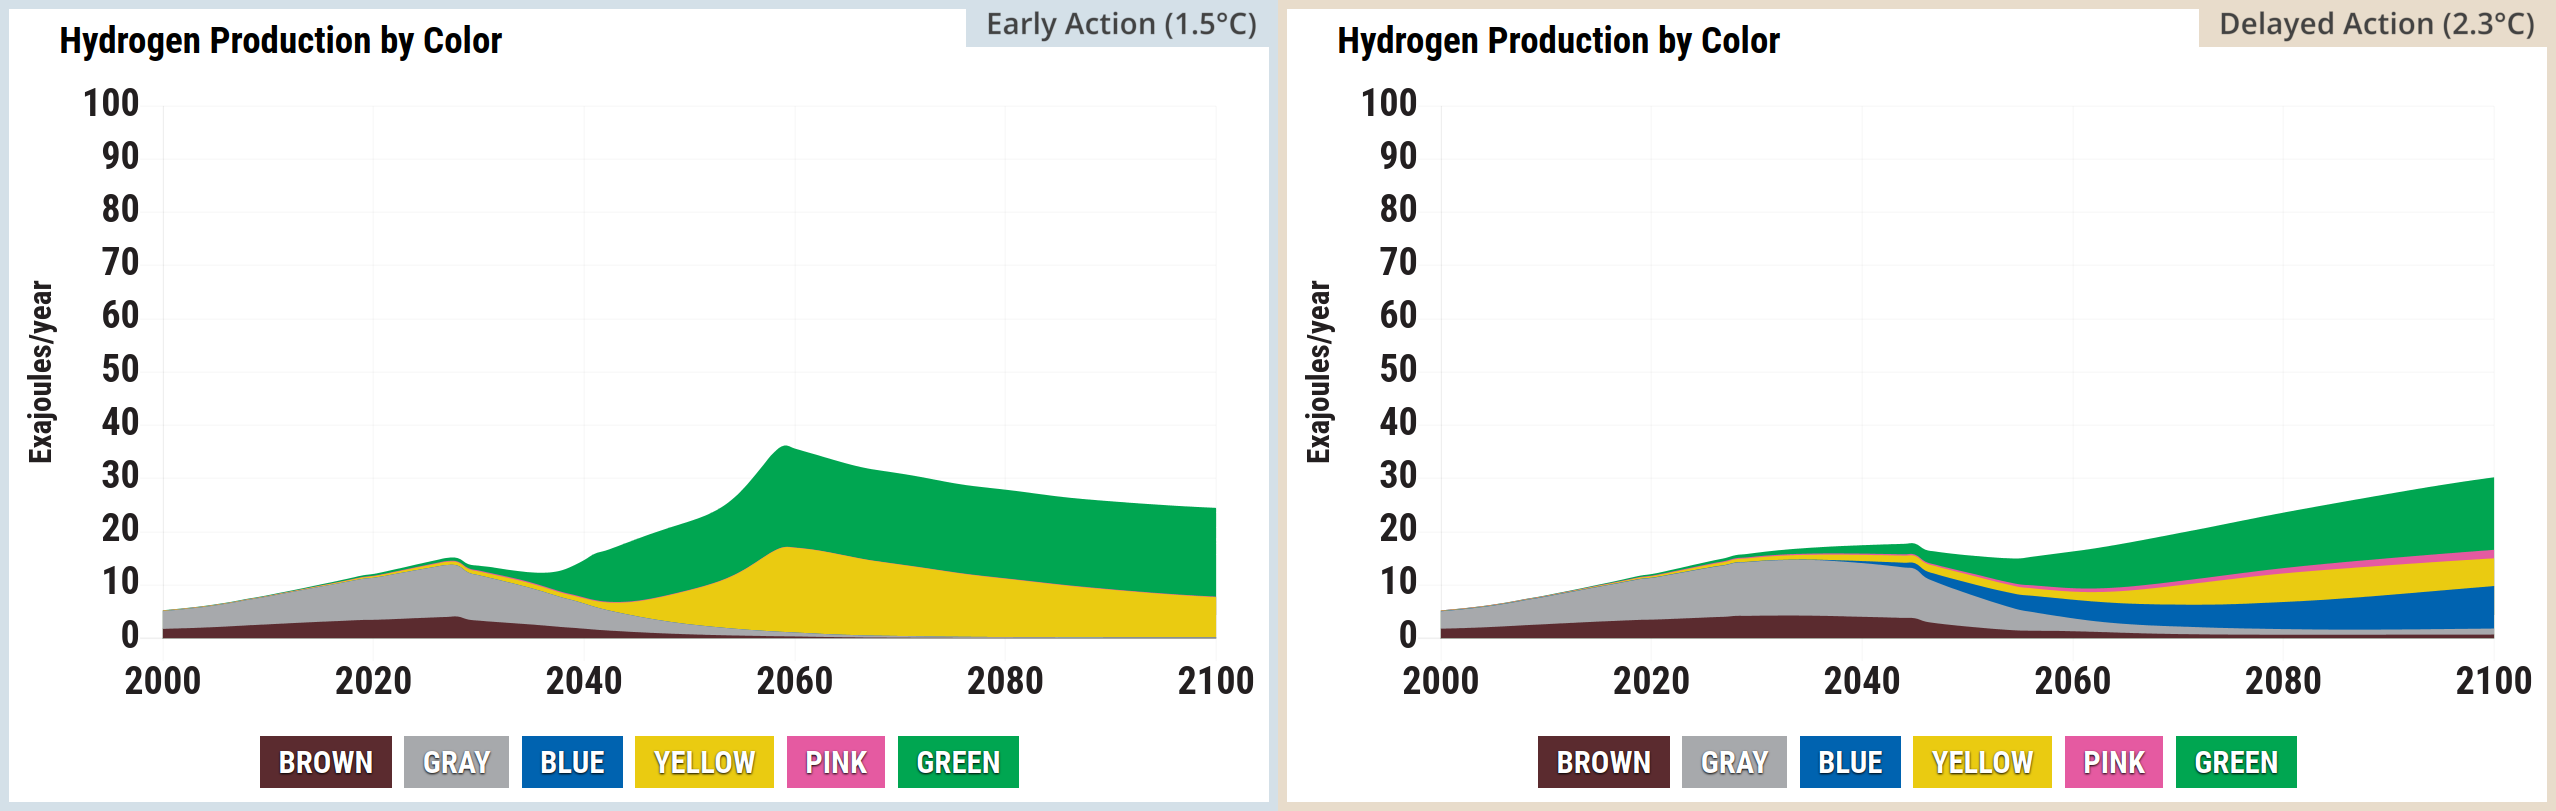
Source: Climate Interactive & MIT Sloan (2026) En-ROADS Simulator (Version 26.8.0)
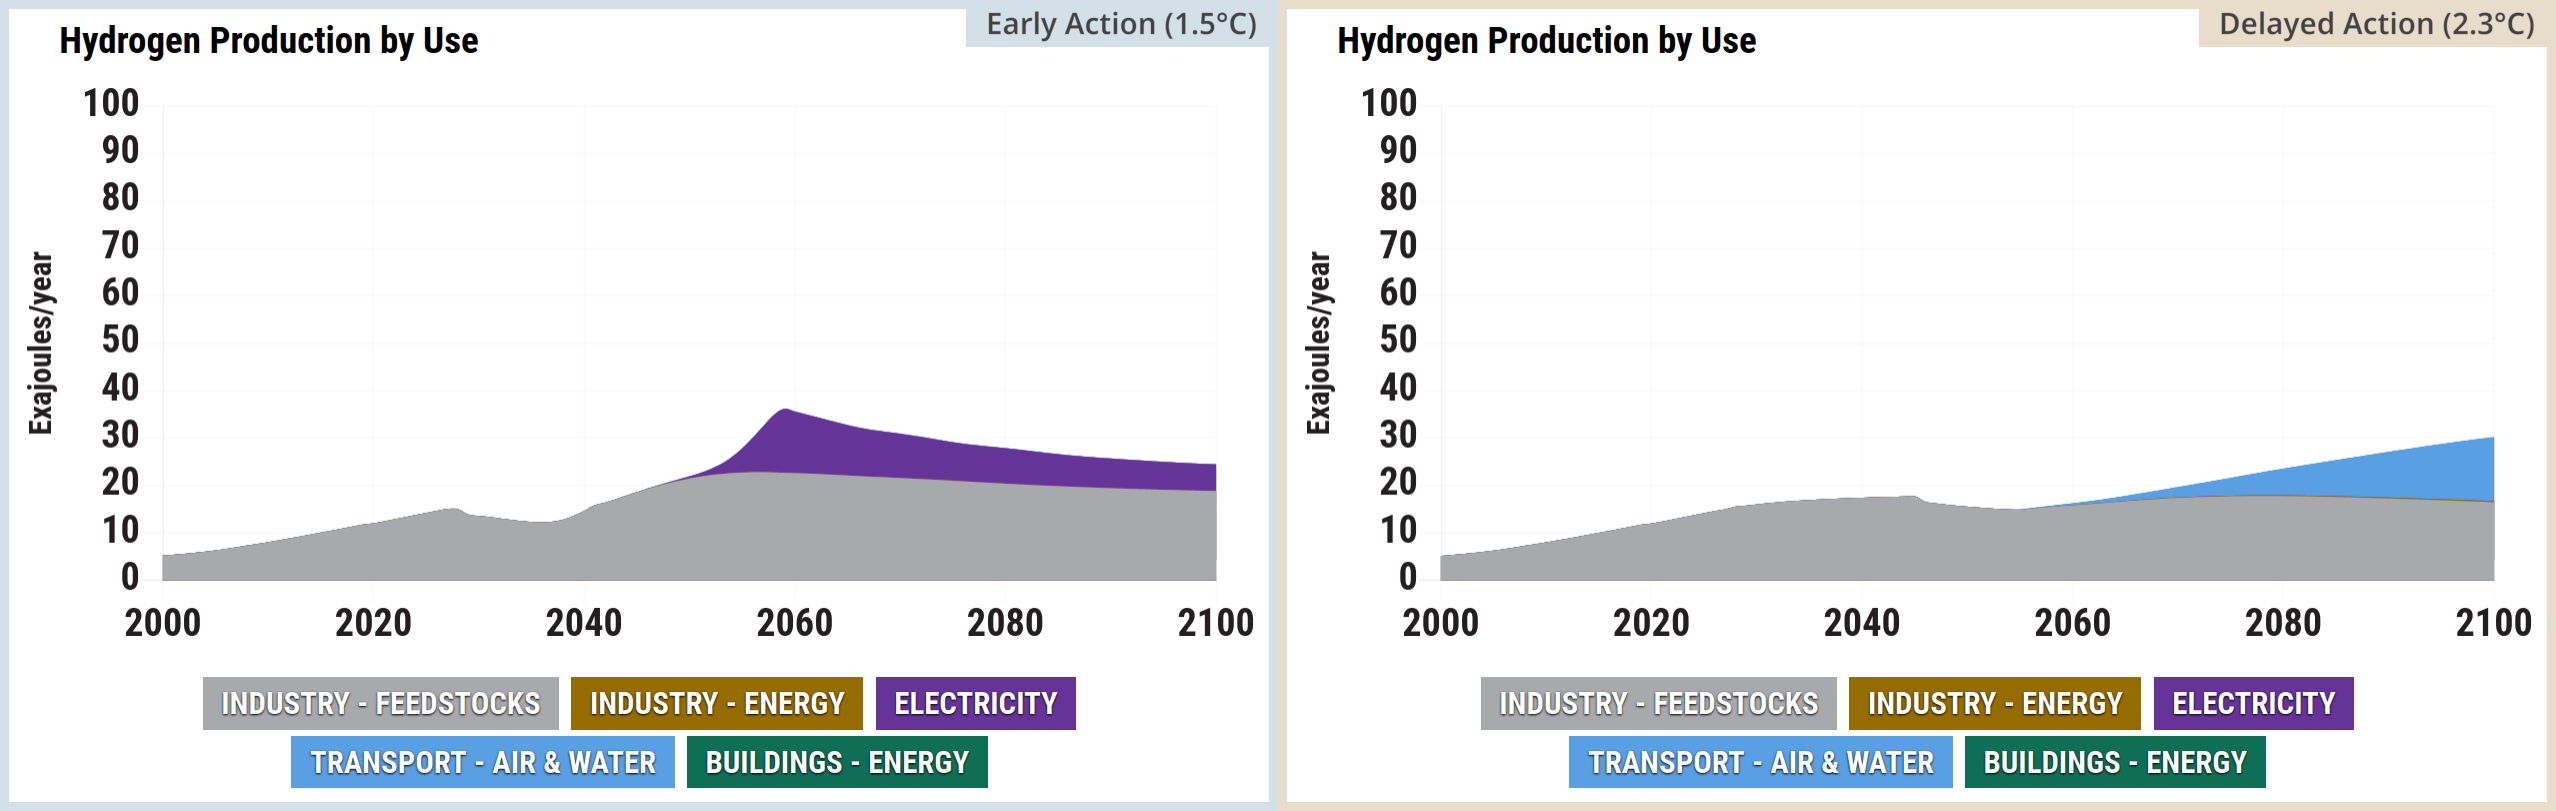
Source: Climate Interactive & MIT Sloan (2026) En-ROADS Simulator (Version 26.8.0)
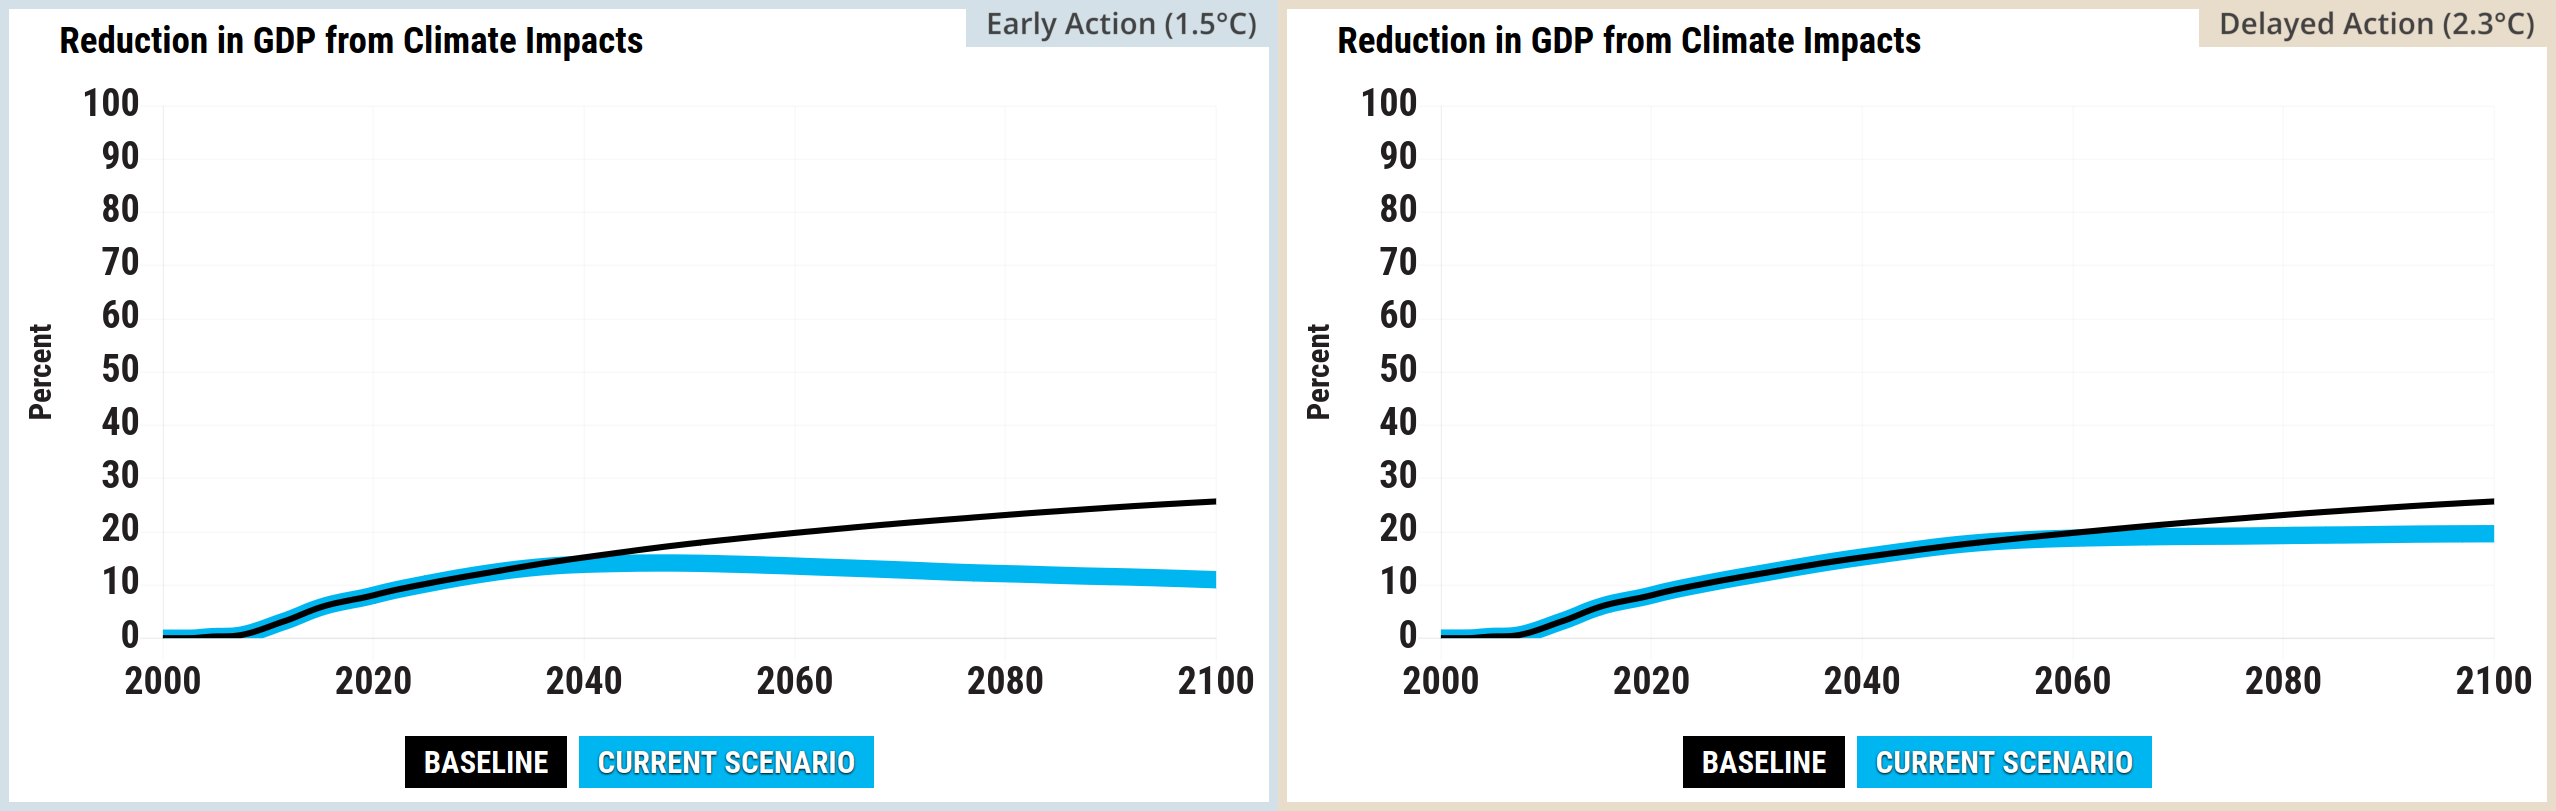
Source: Climate Interactive & MIT Sloan (2026) En-ROADS Simulator (Version 26.8.0)
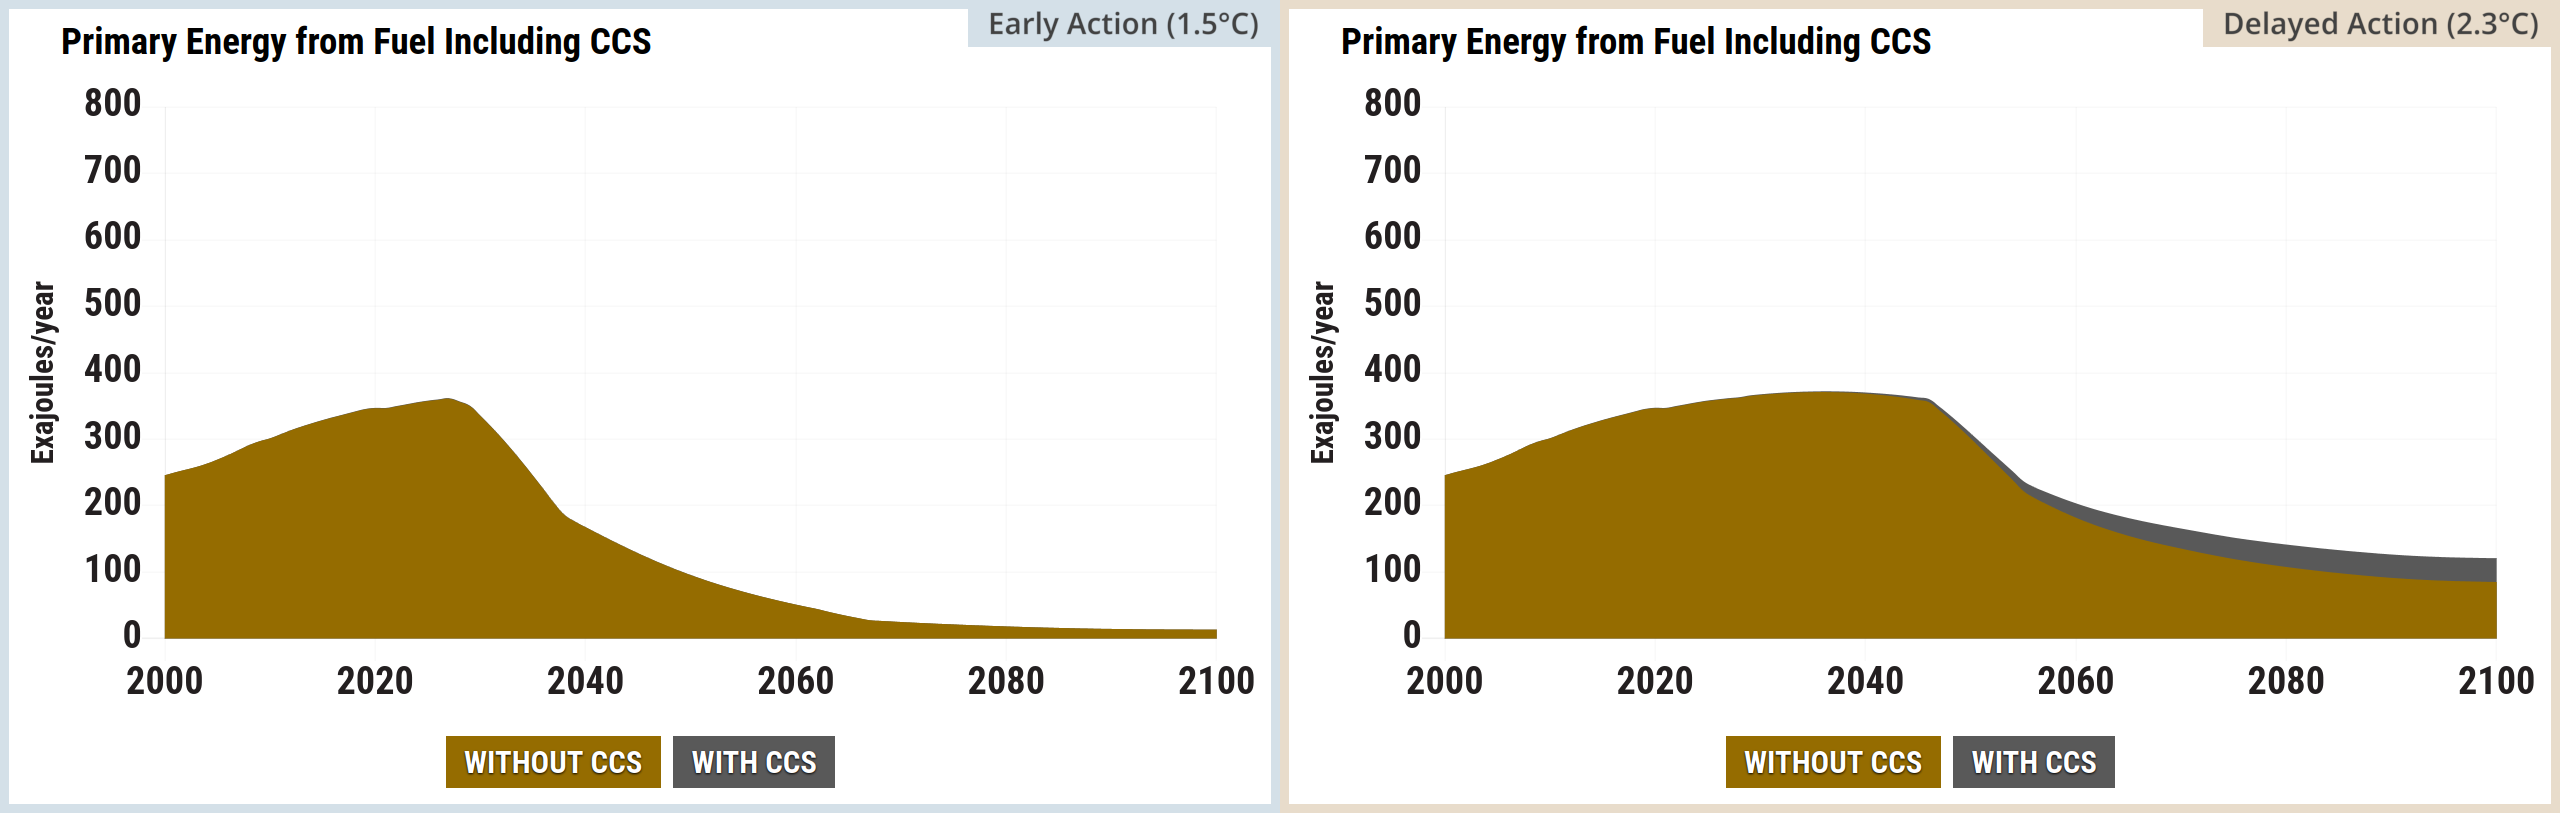
Source: Climate Interactive & MIT Sloan (2026) En-ROADS Simulator (Version 26.8.0)
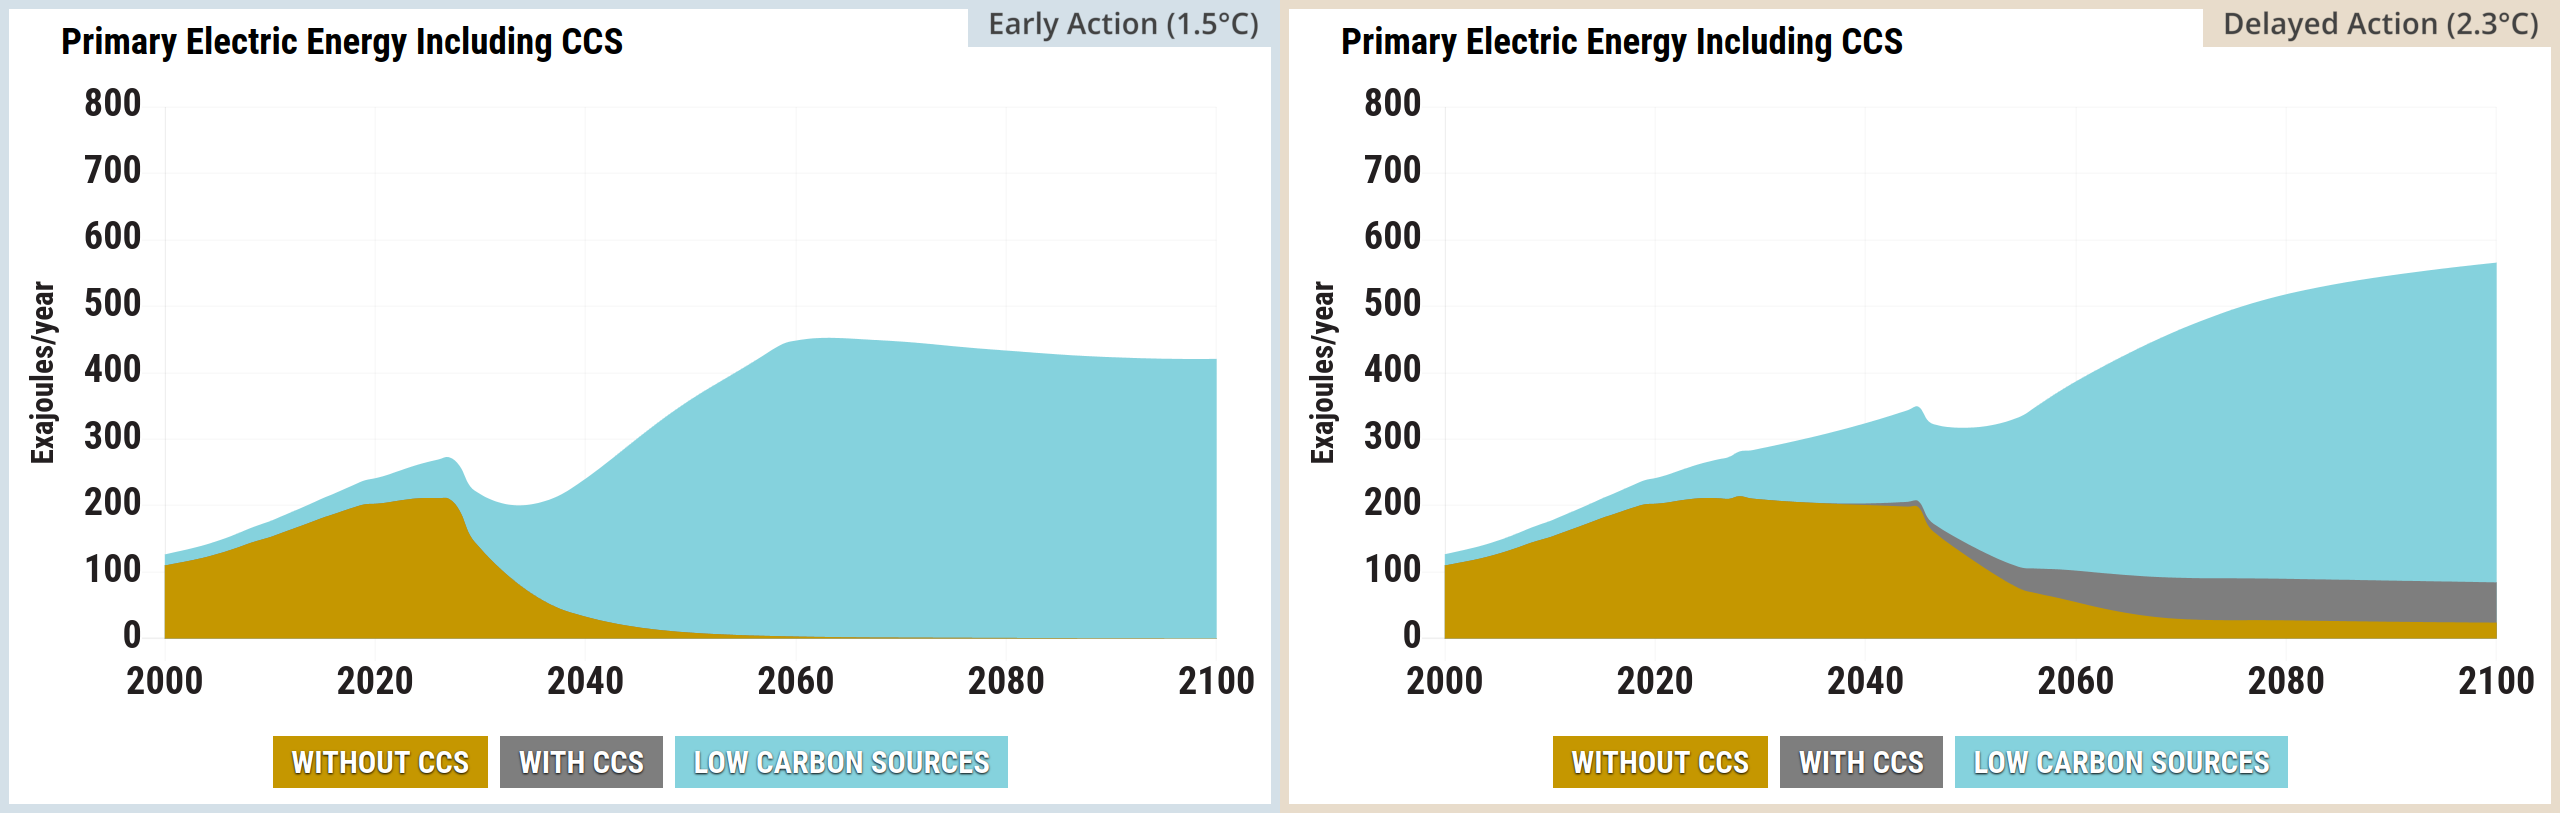
Source: Climate Interactive & MIT Sloan (2026) En-ROADS Simulator (Version 26.8.0)
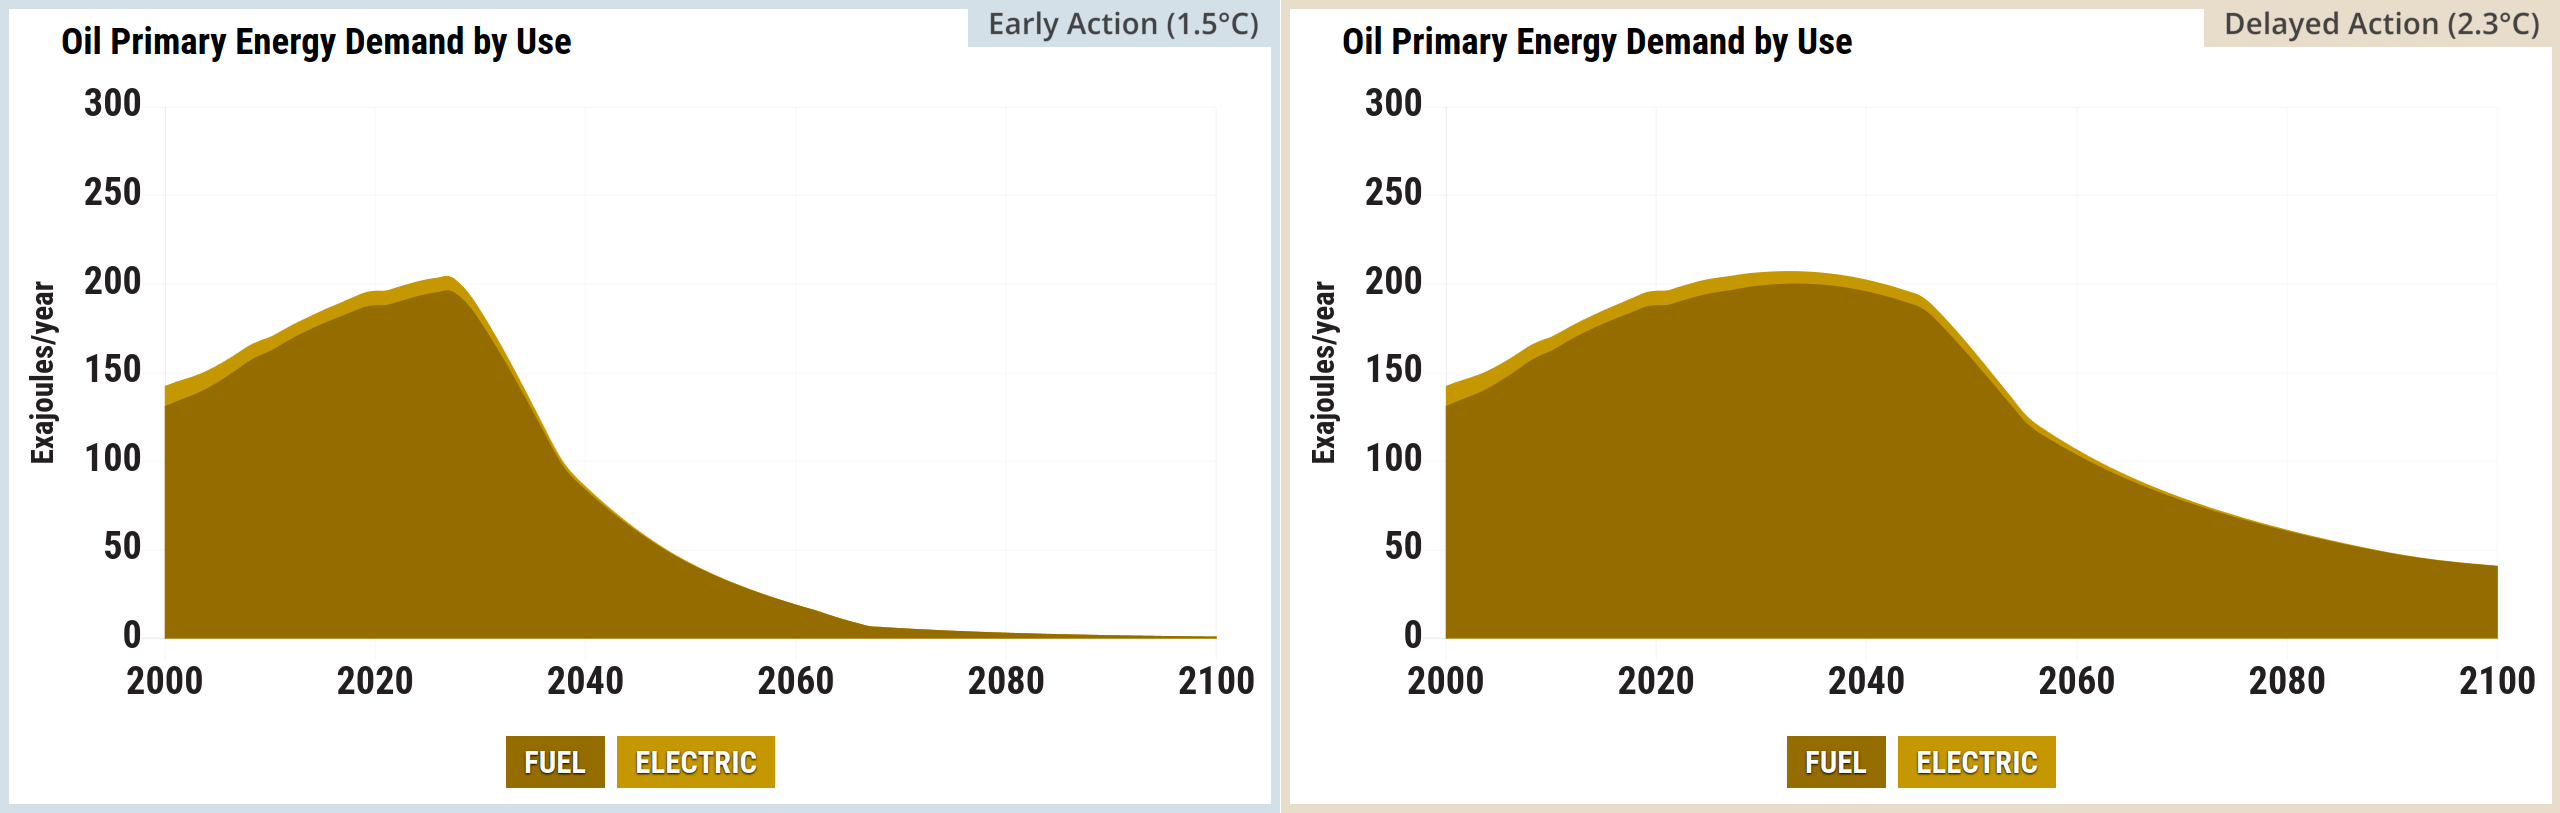
Source: Climate Interactive & MIT Sloan (2026) En-ROADS Simulator (Version 26.8.0)
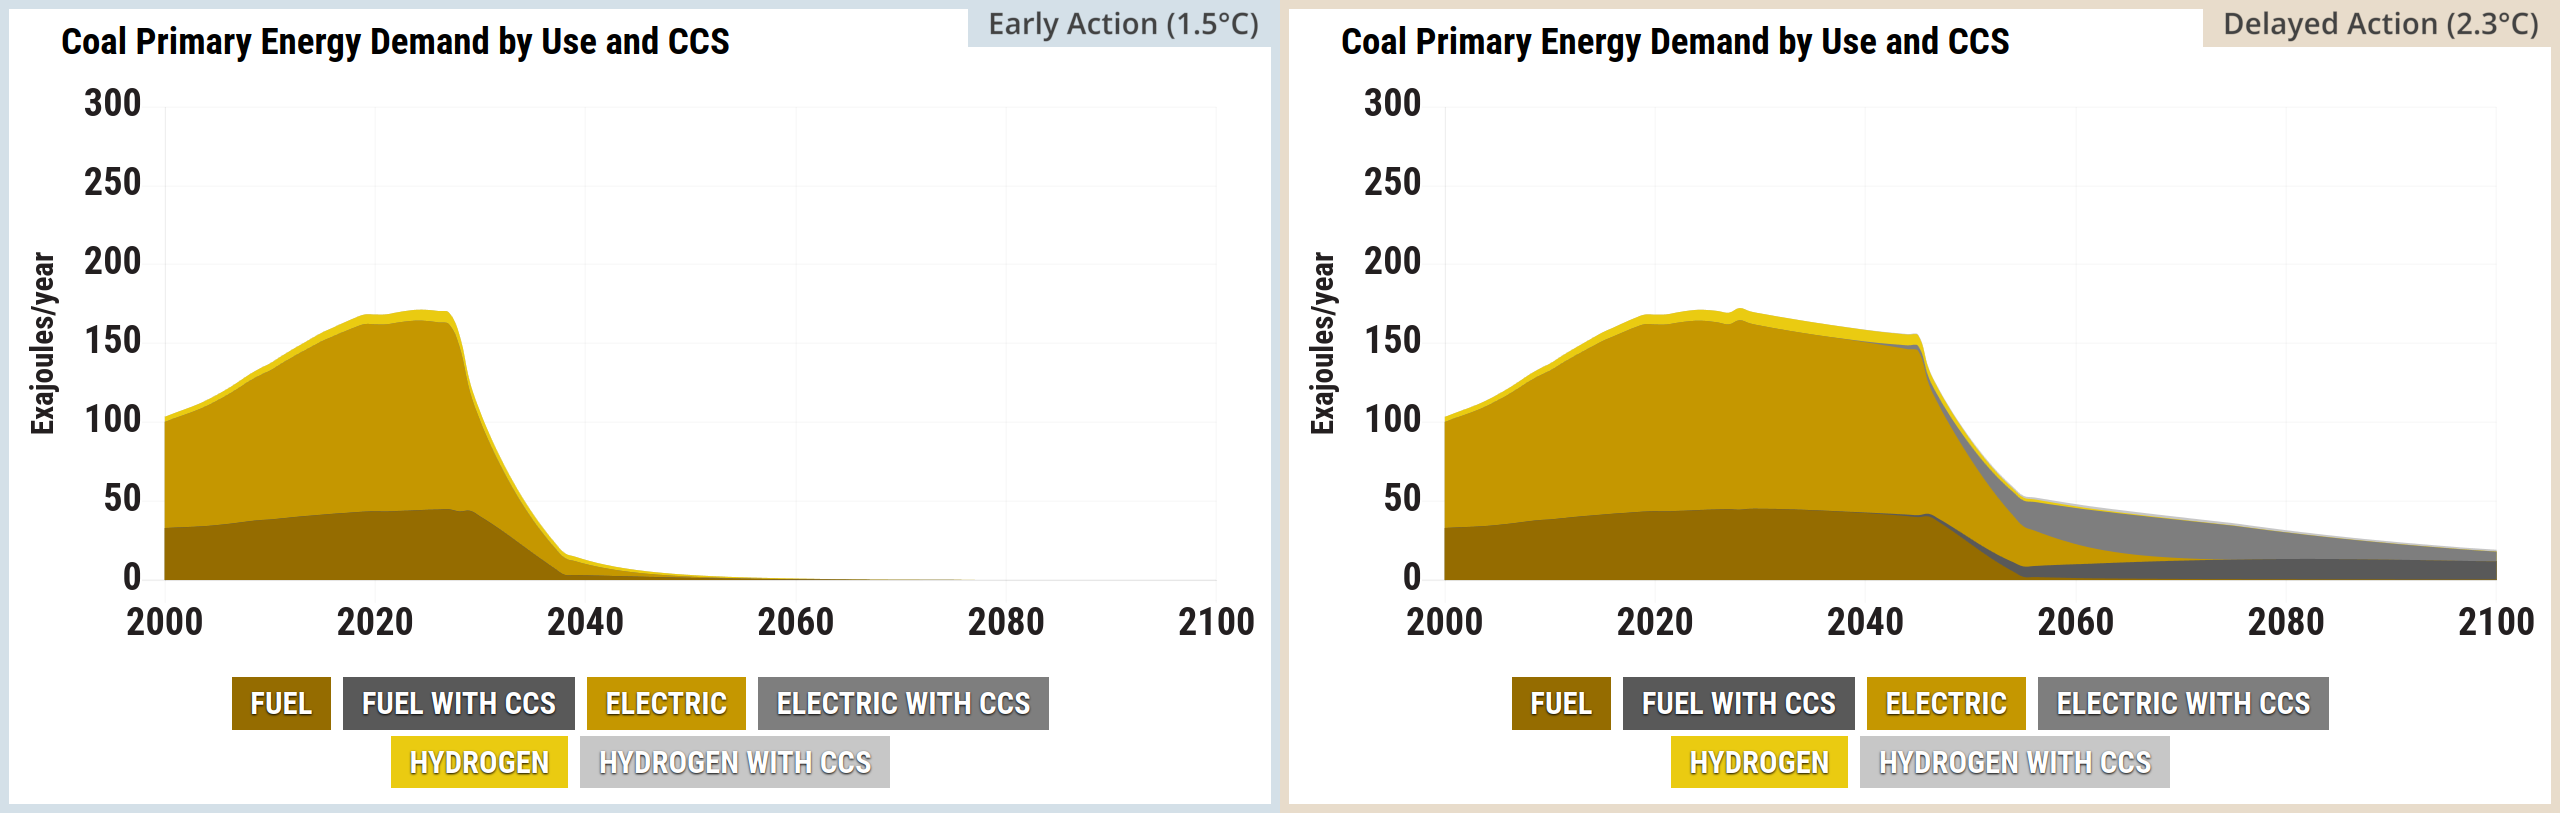
Source: Climate Interactive & MIT Sloan (2026) En-ROADS Simulator (Version 26.8.0)
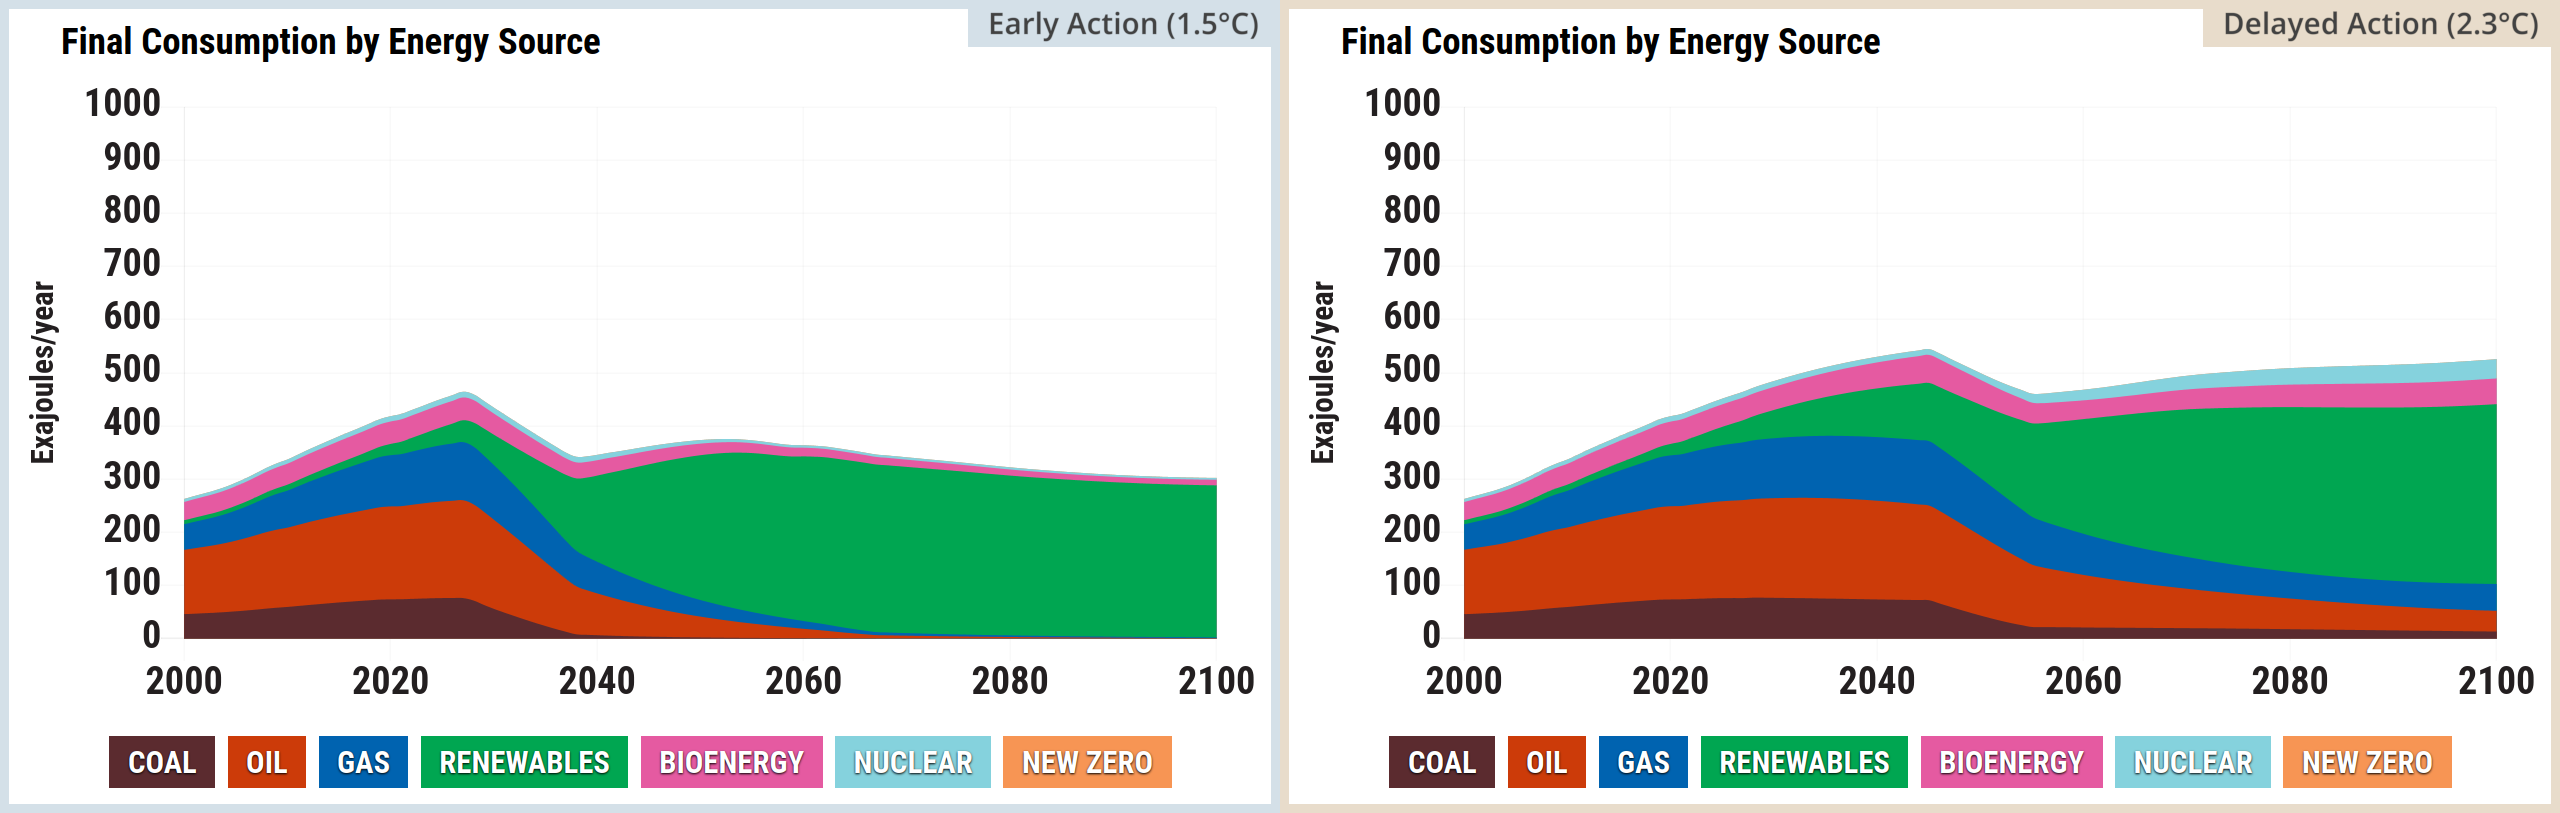
Source: Climate Interactive & MIT Sloan (2026) En-ROADS Simulator (Version 26.8.0)
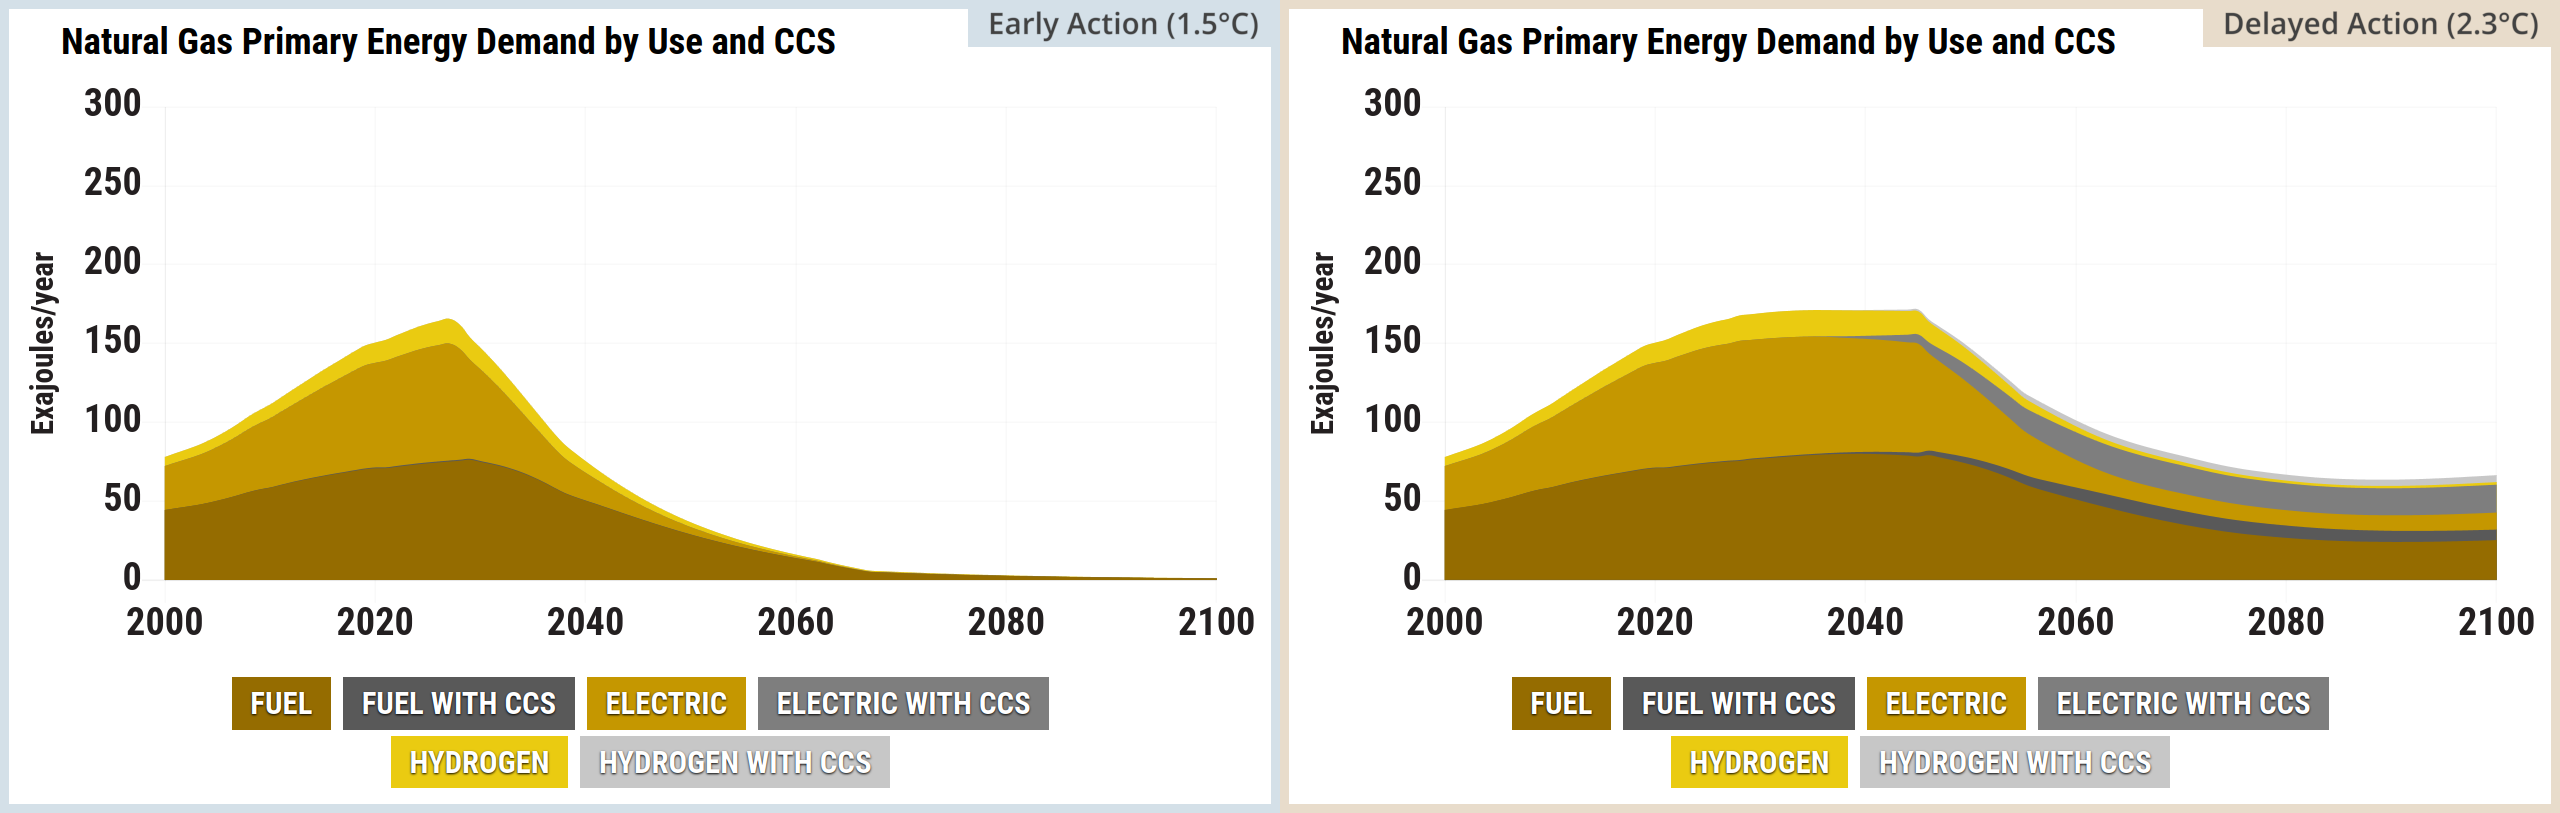
Source: Climate Interactive & MIT Sloan (2026) En-ROADS Simulator (Version 26.8.0)
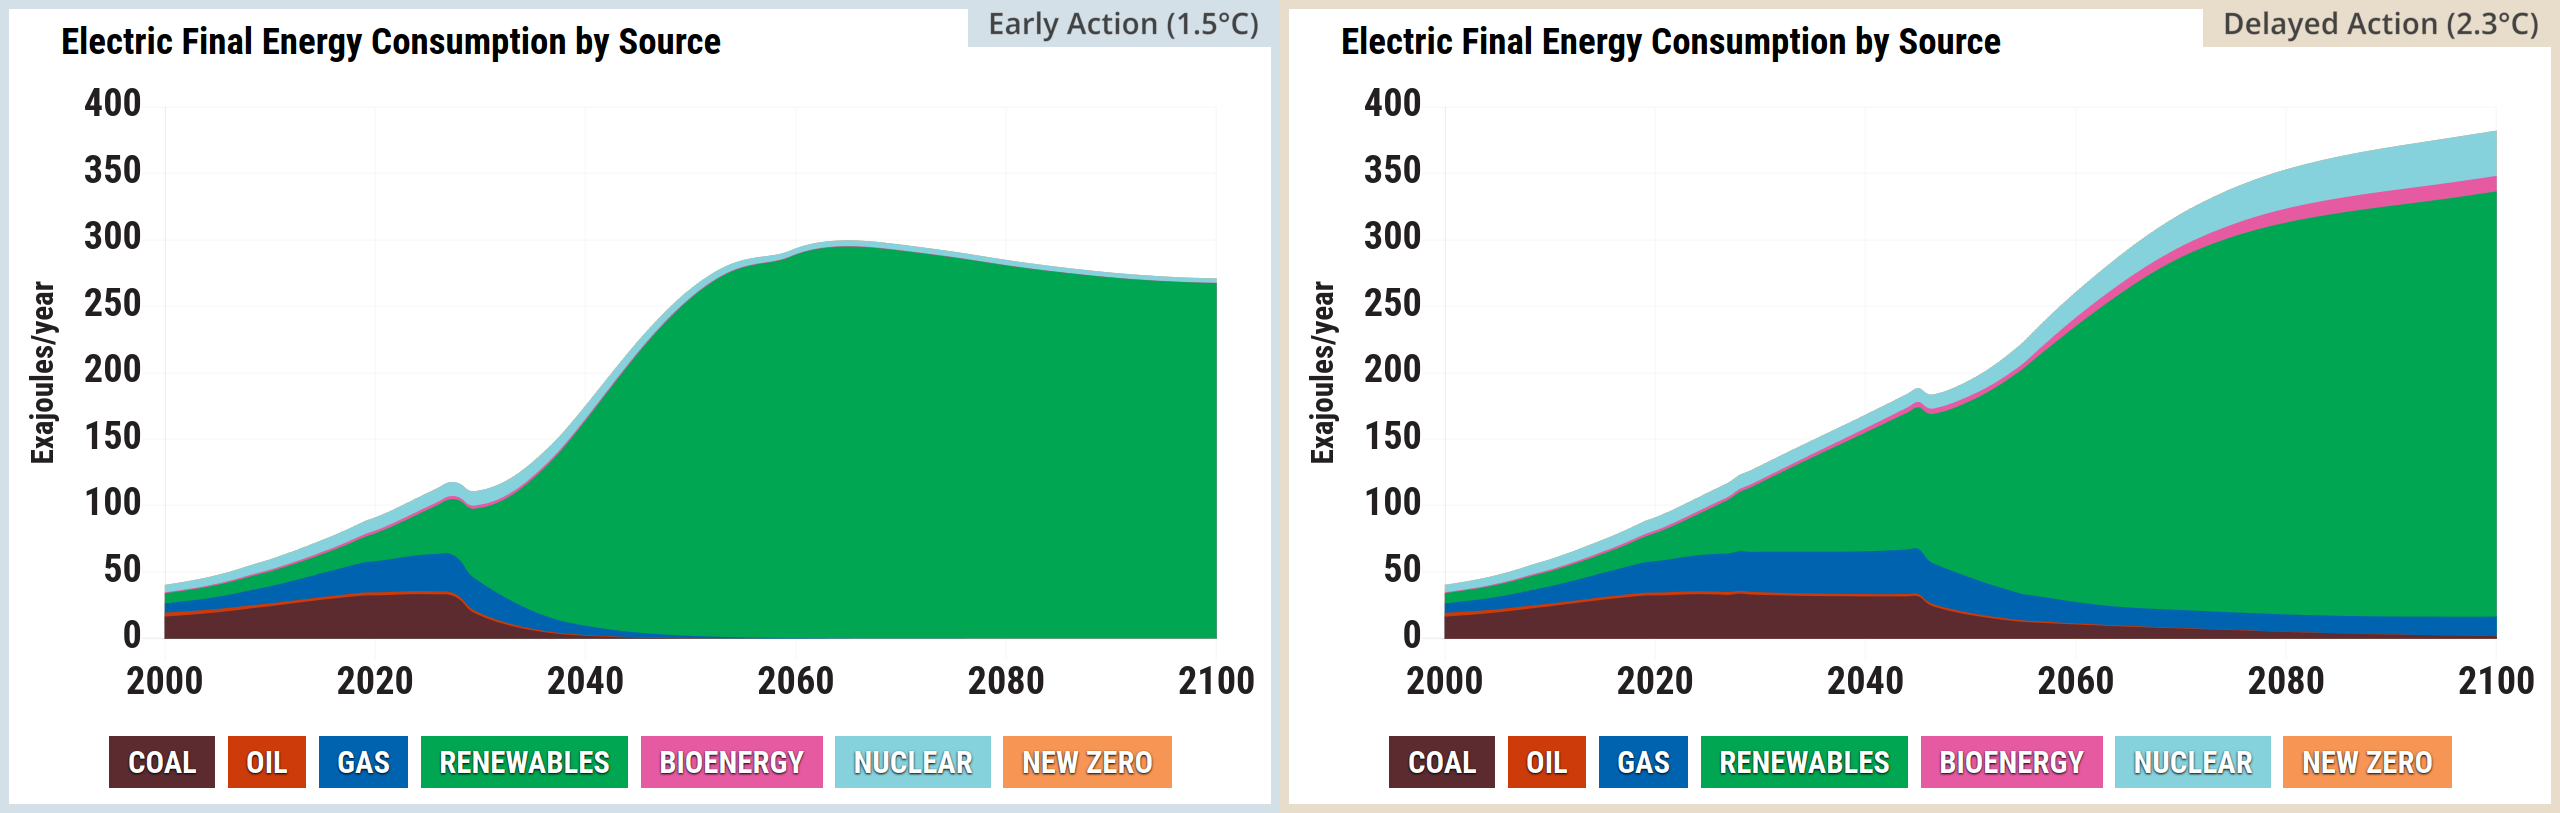
Source: Climate Interactive & MIT Sloan (2026) En-ROADS Simulator (Version 26.8.0)
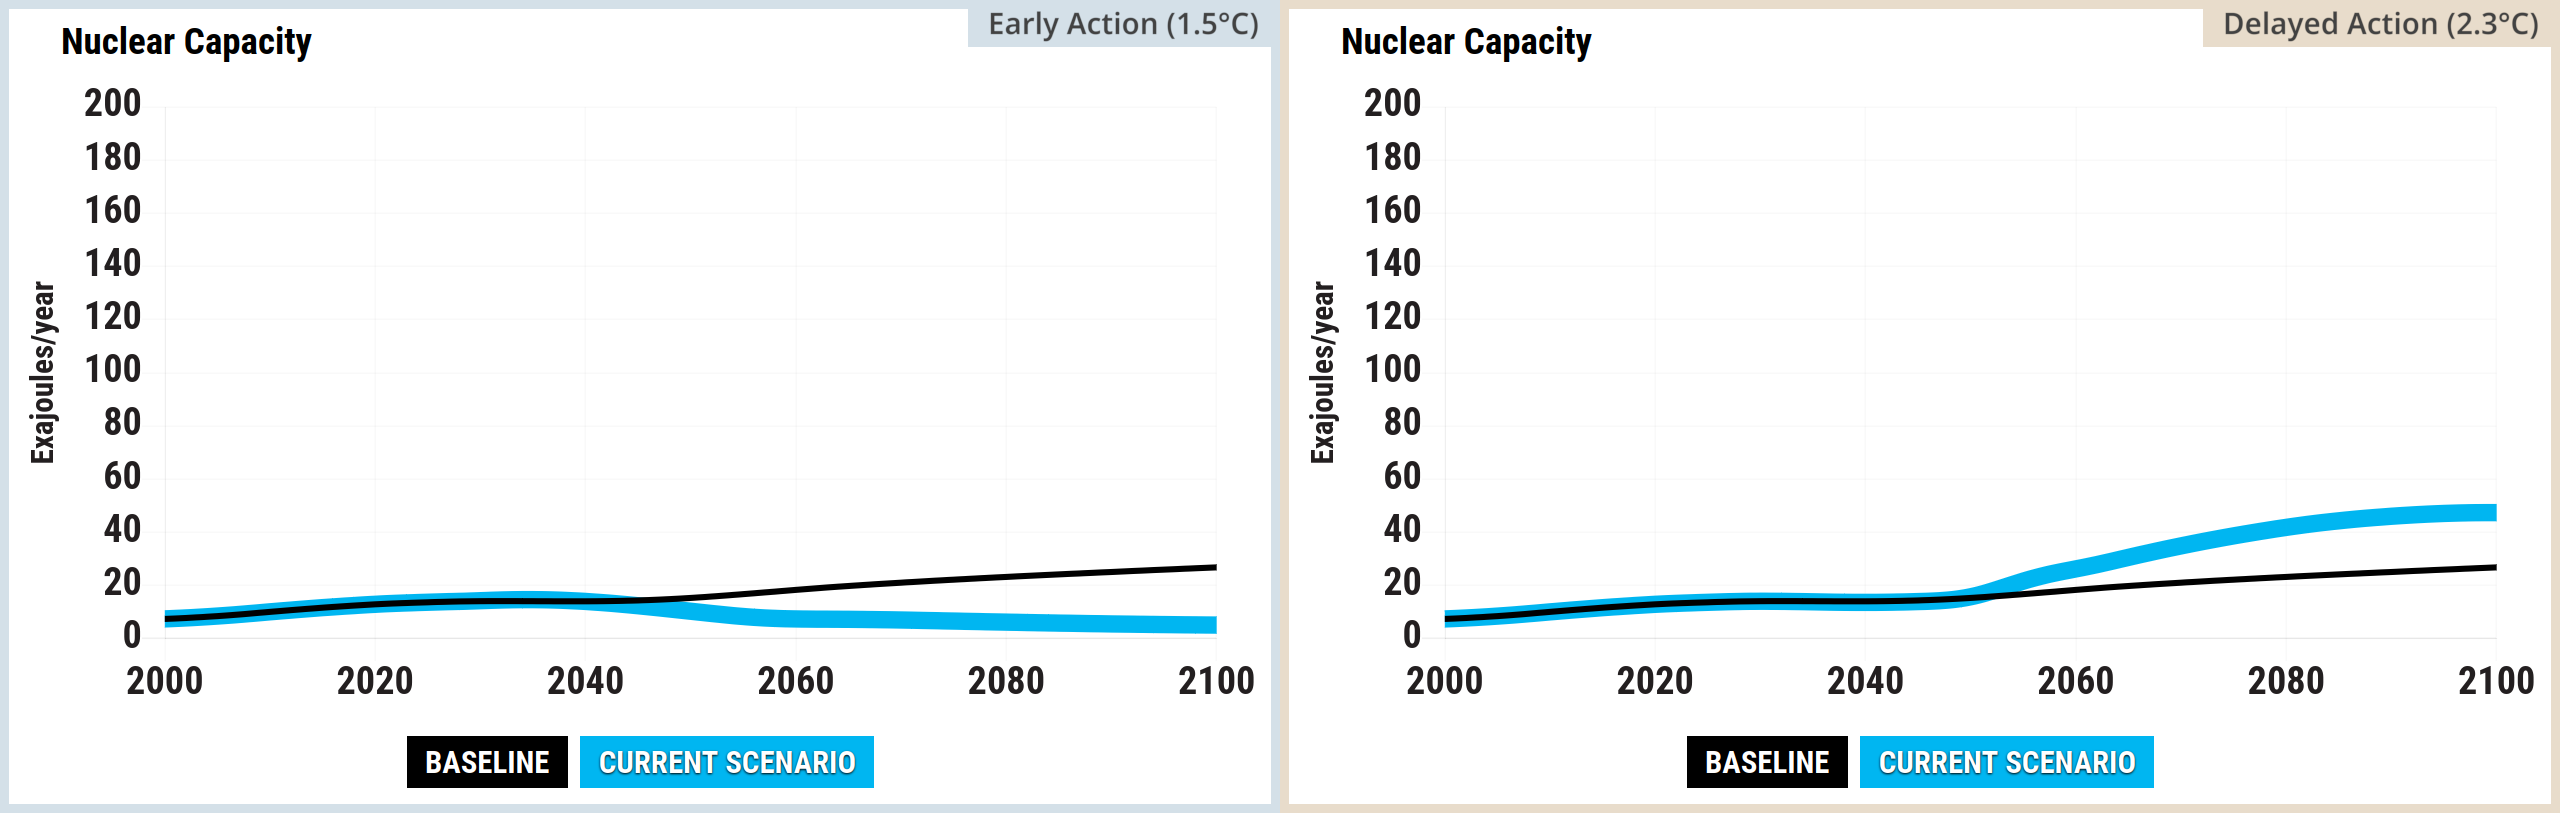
Source: Climate Interactive & MIT Sloan (2026) En-ROADS Simulator (Version 26.8.0)
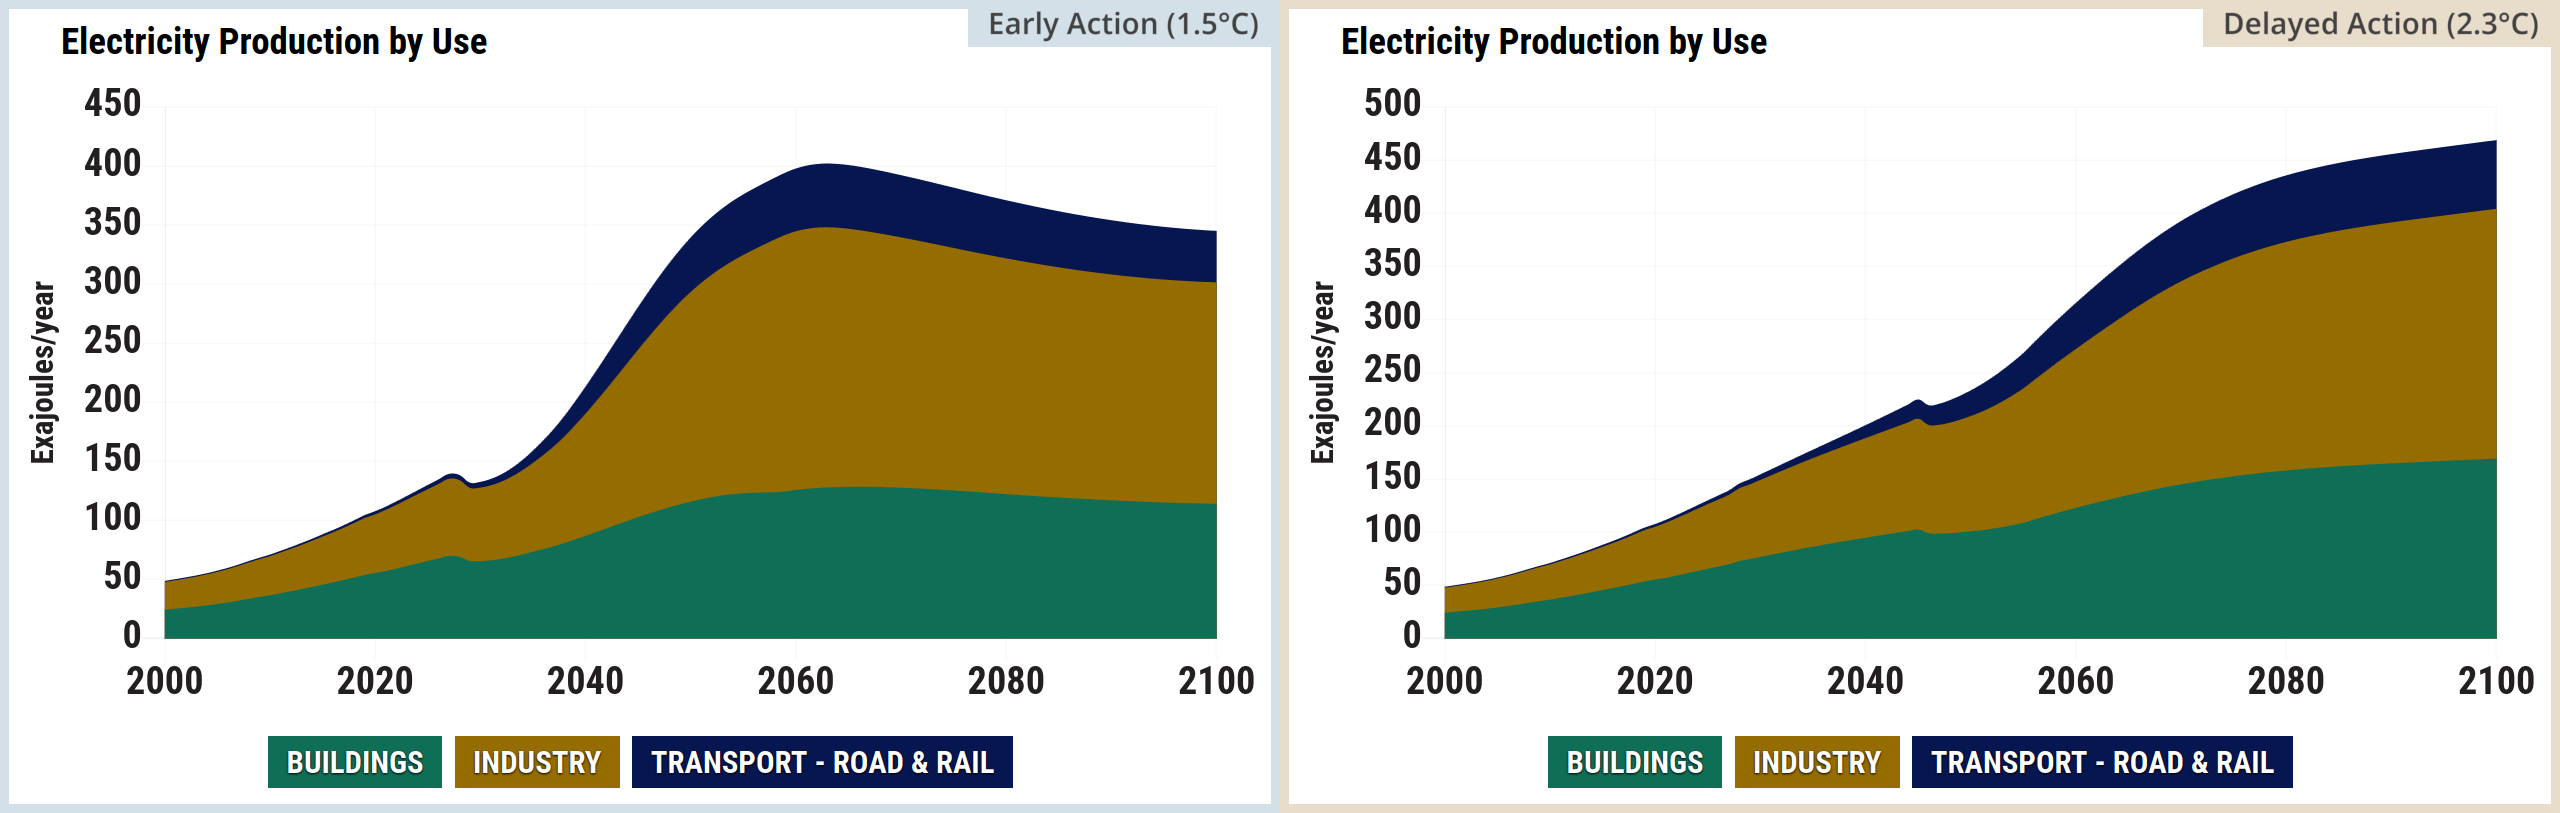
Source: Climate Interactive & MIT Sloan (2026) En-ROADS Simulator (Version 26.8.0)
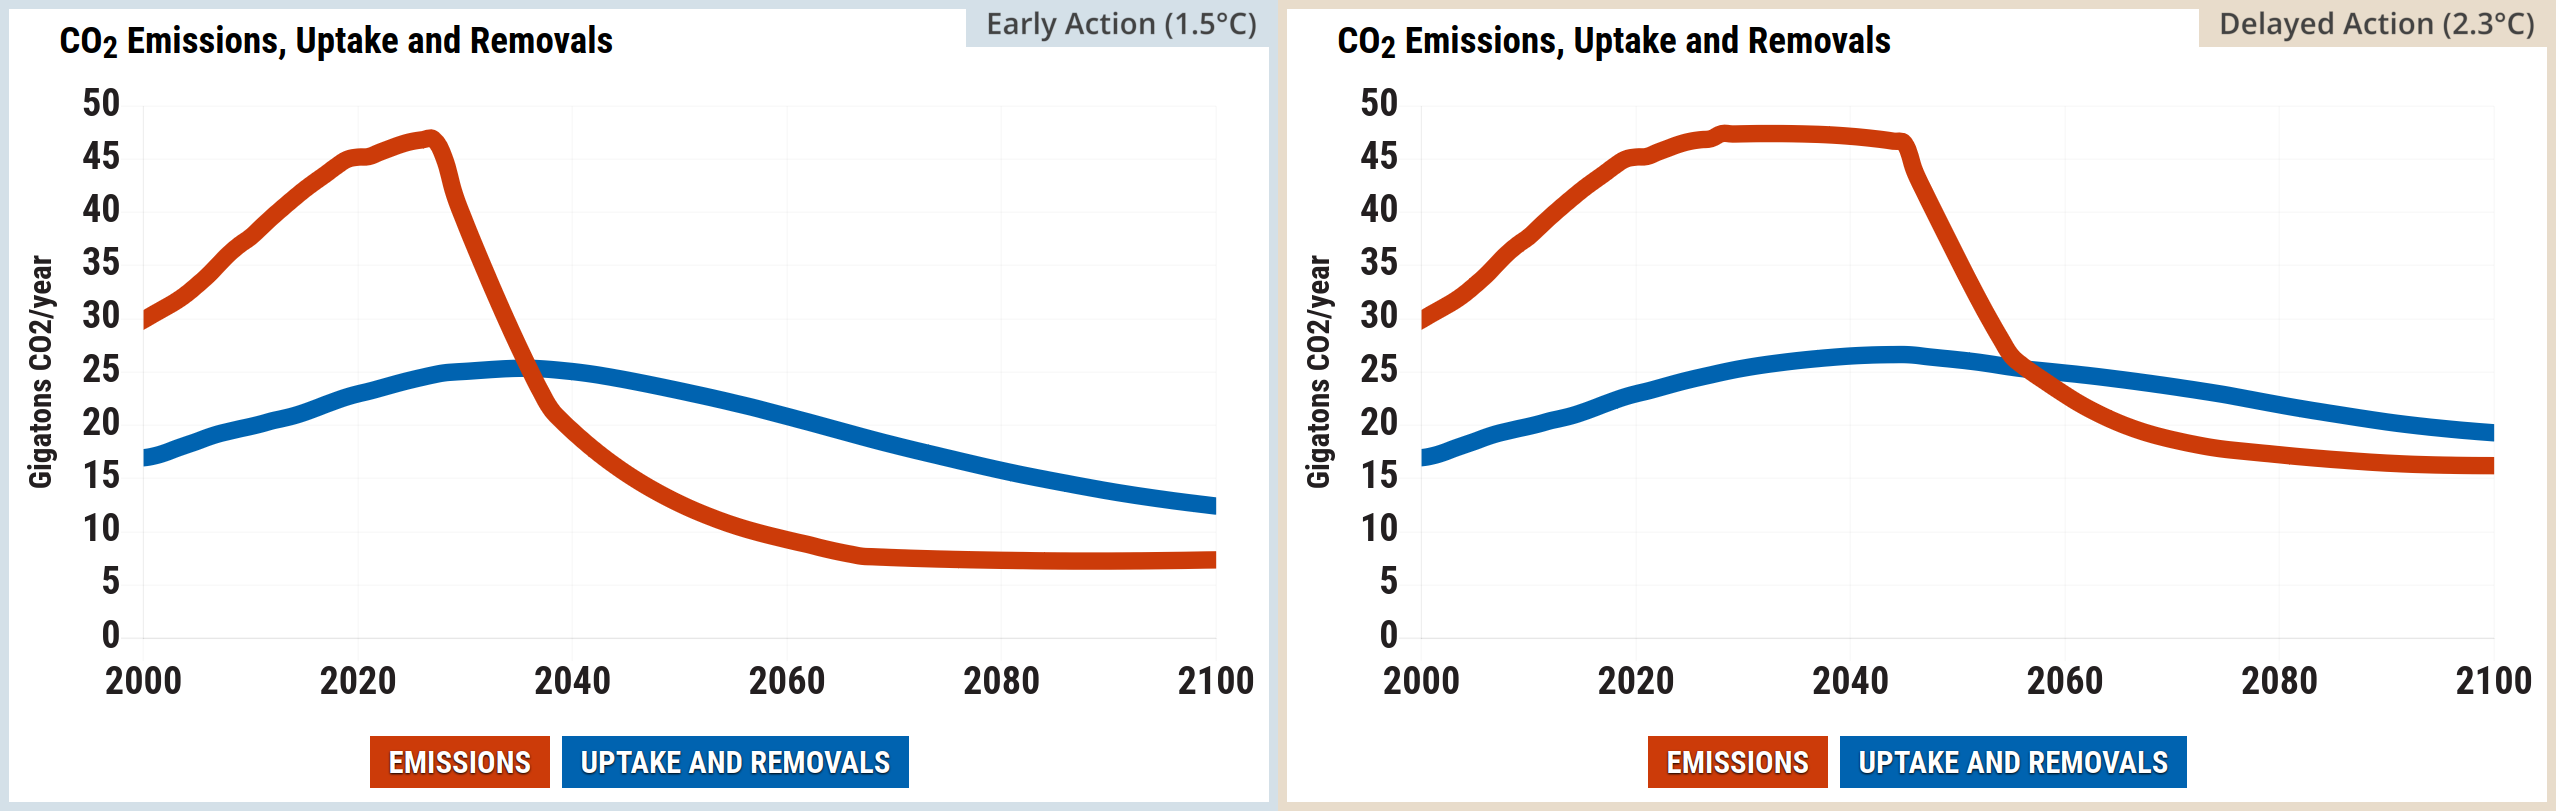
Source: Climate Interactive & MIT Sloan (2026) En-ROADS Simulator (Version 26.8.0)
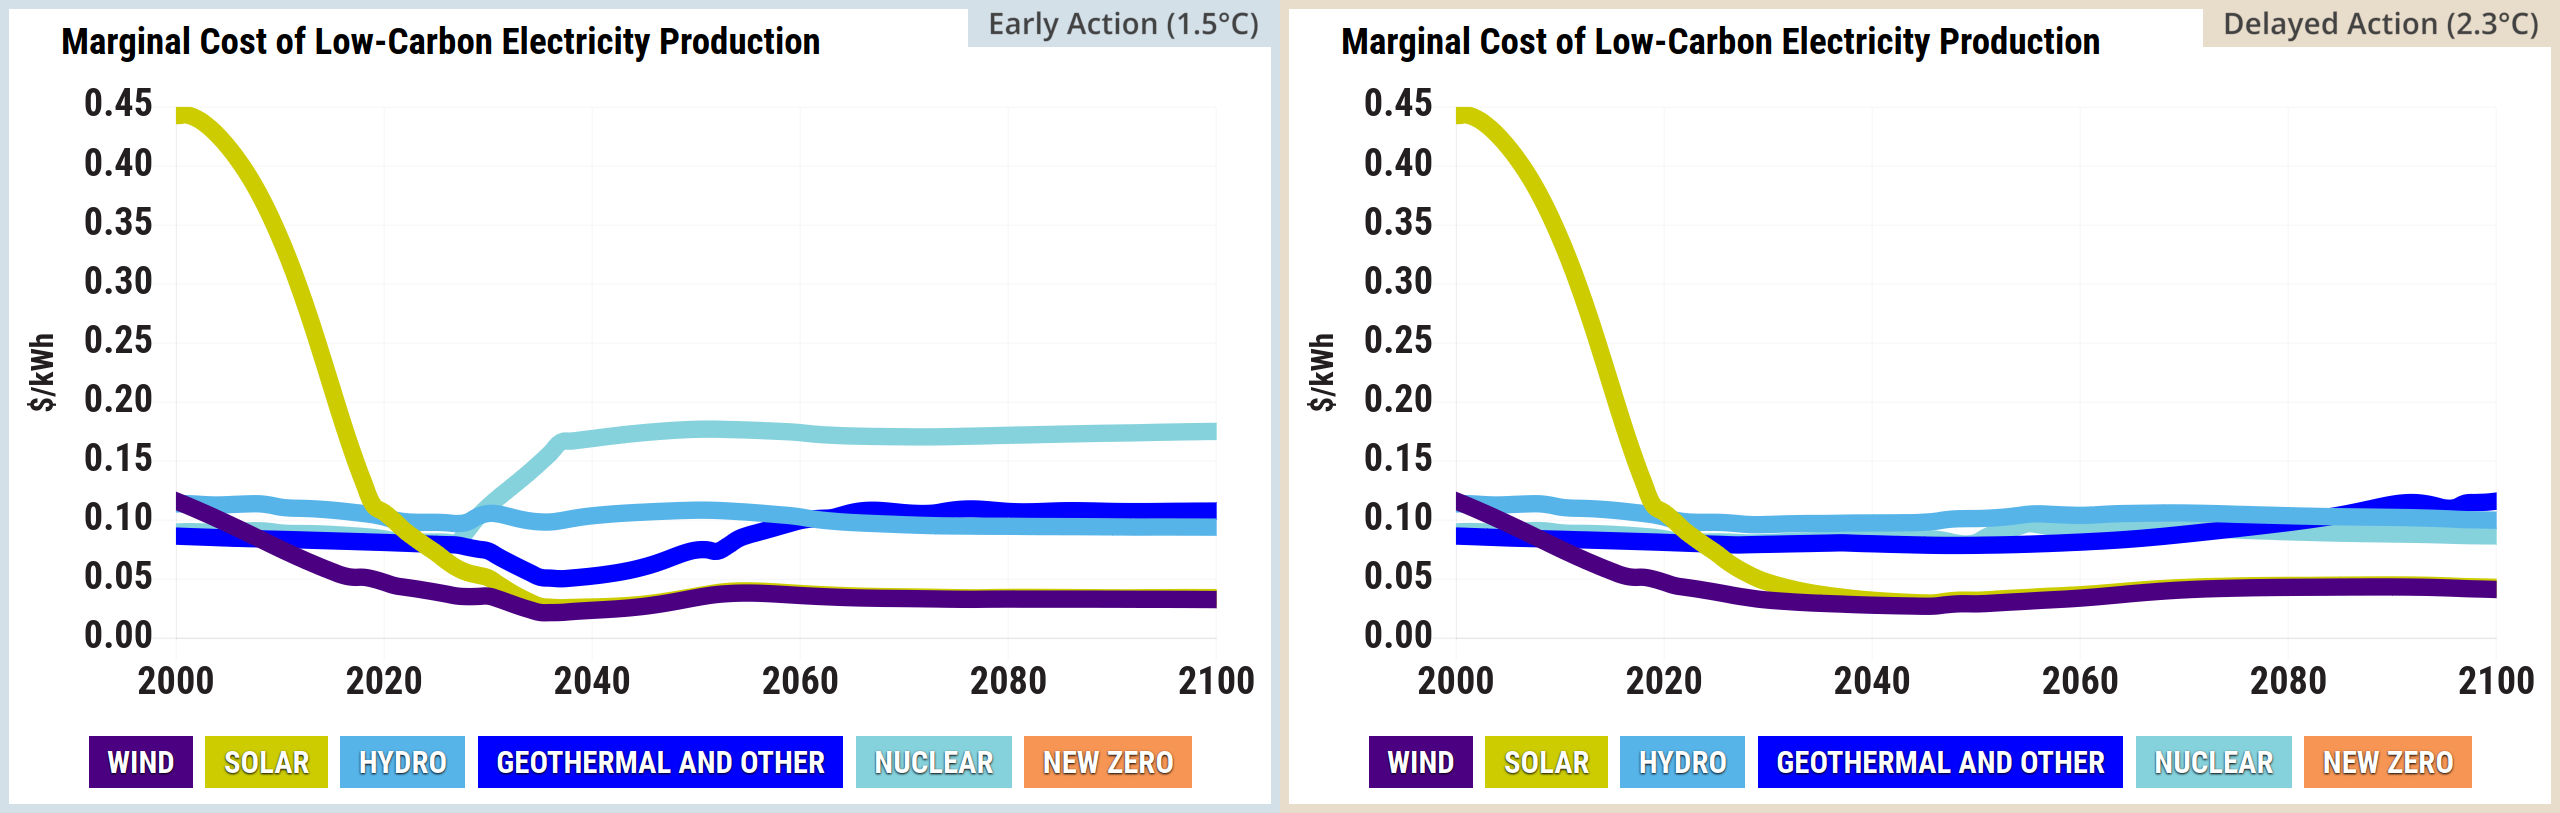
Source: Climate Interactive & MIT Sloan (2026) En-ROADS Simulator (Version 26.8.0)
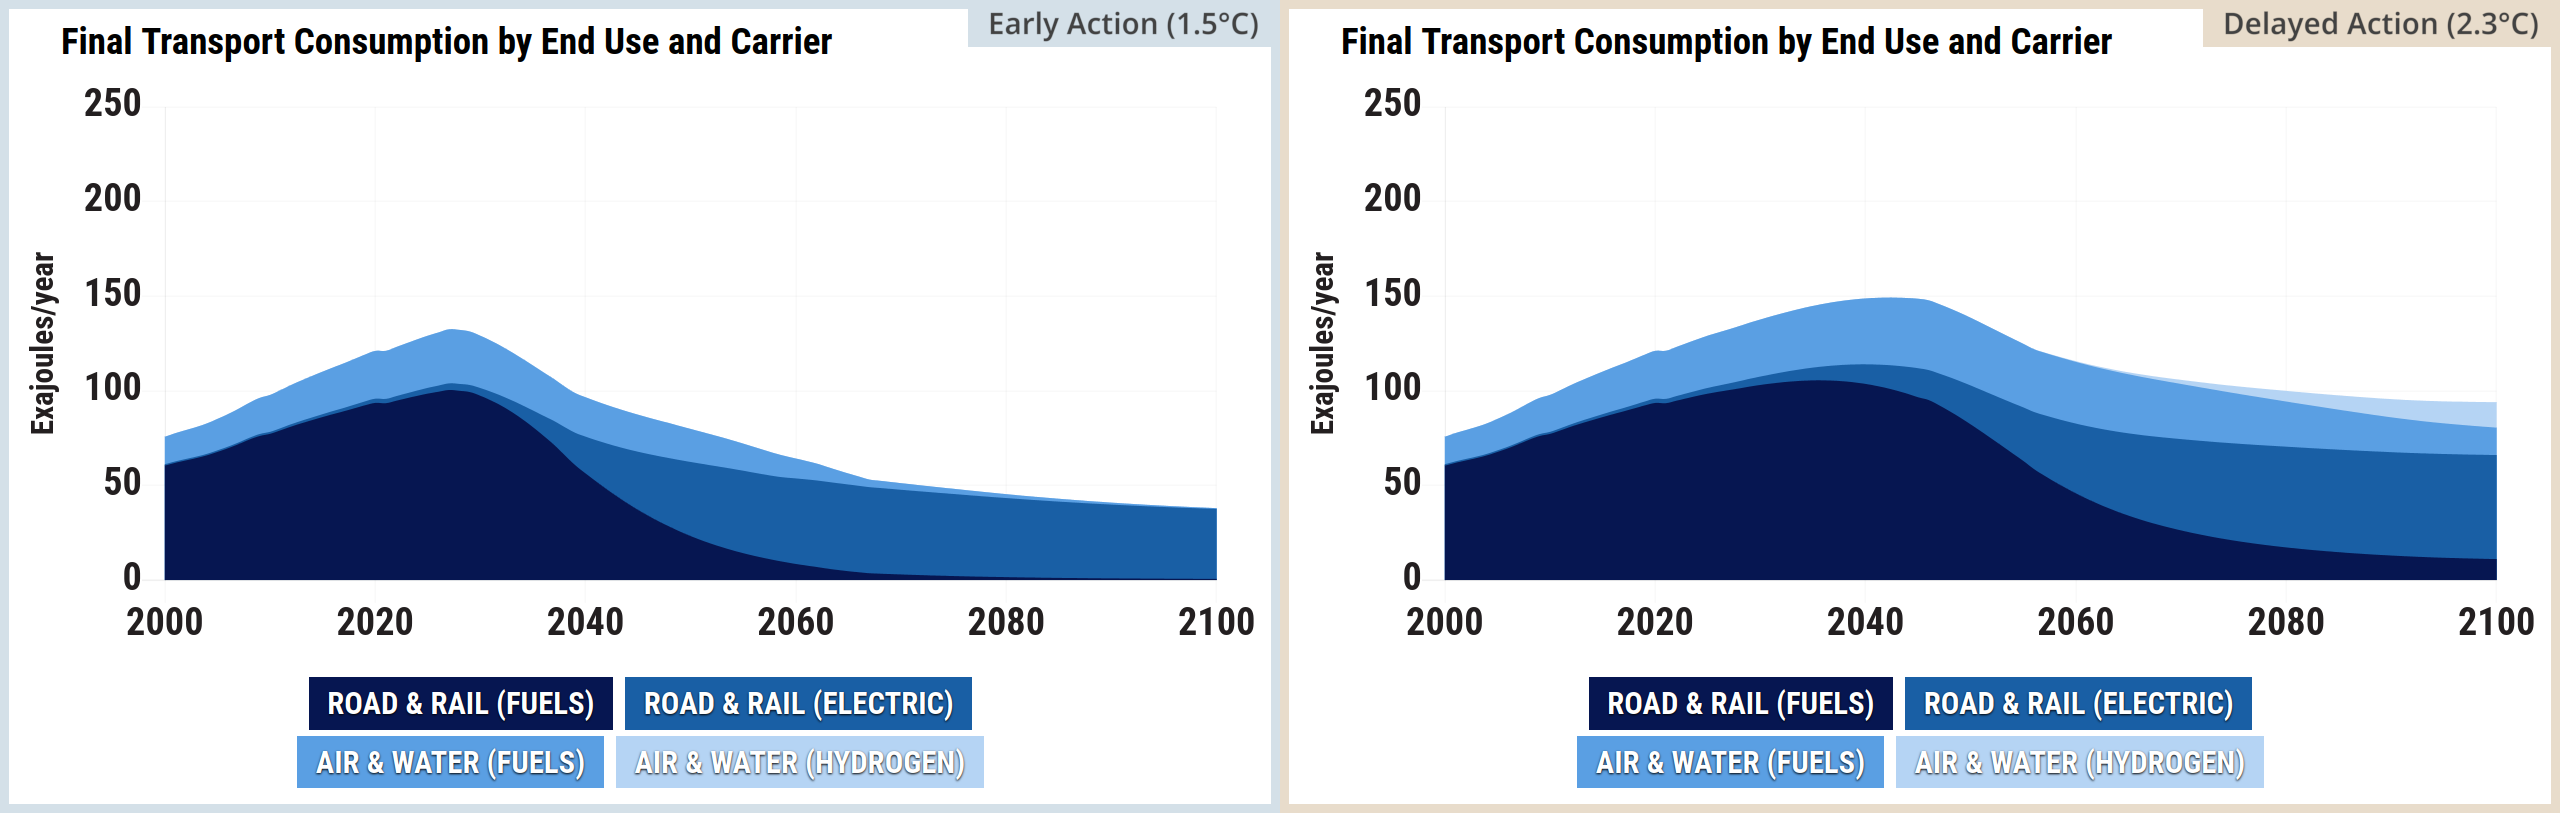
Source: Climate Interactive & MIT Sloan (2026) En-ROADS Simulator (Version 26.8.0)
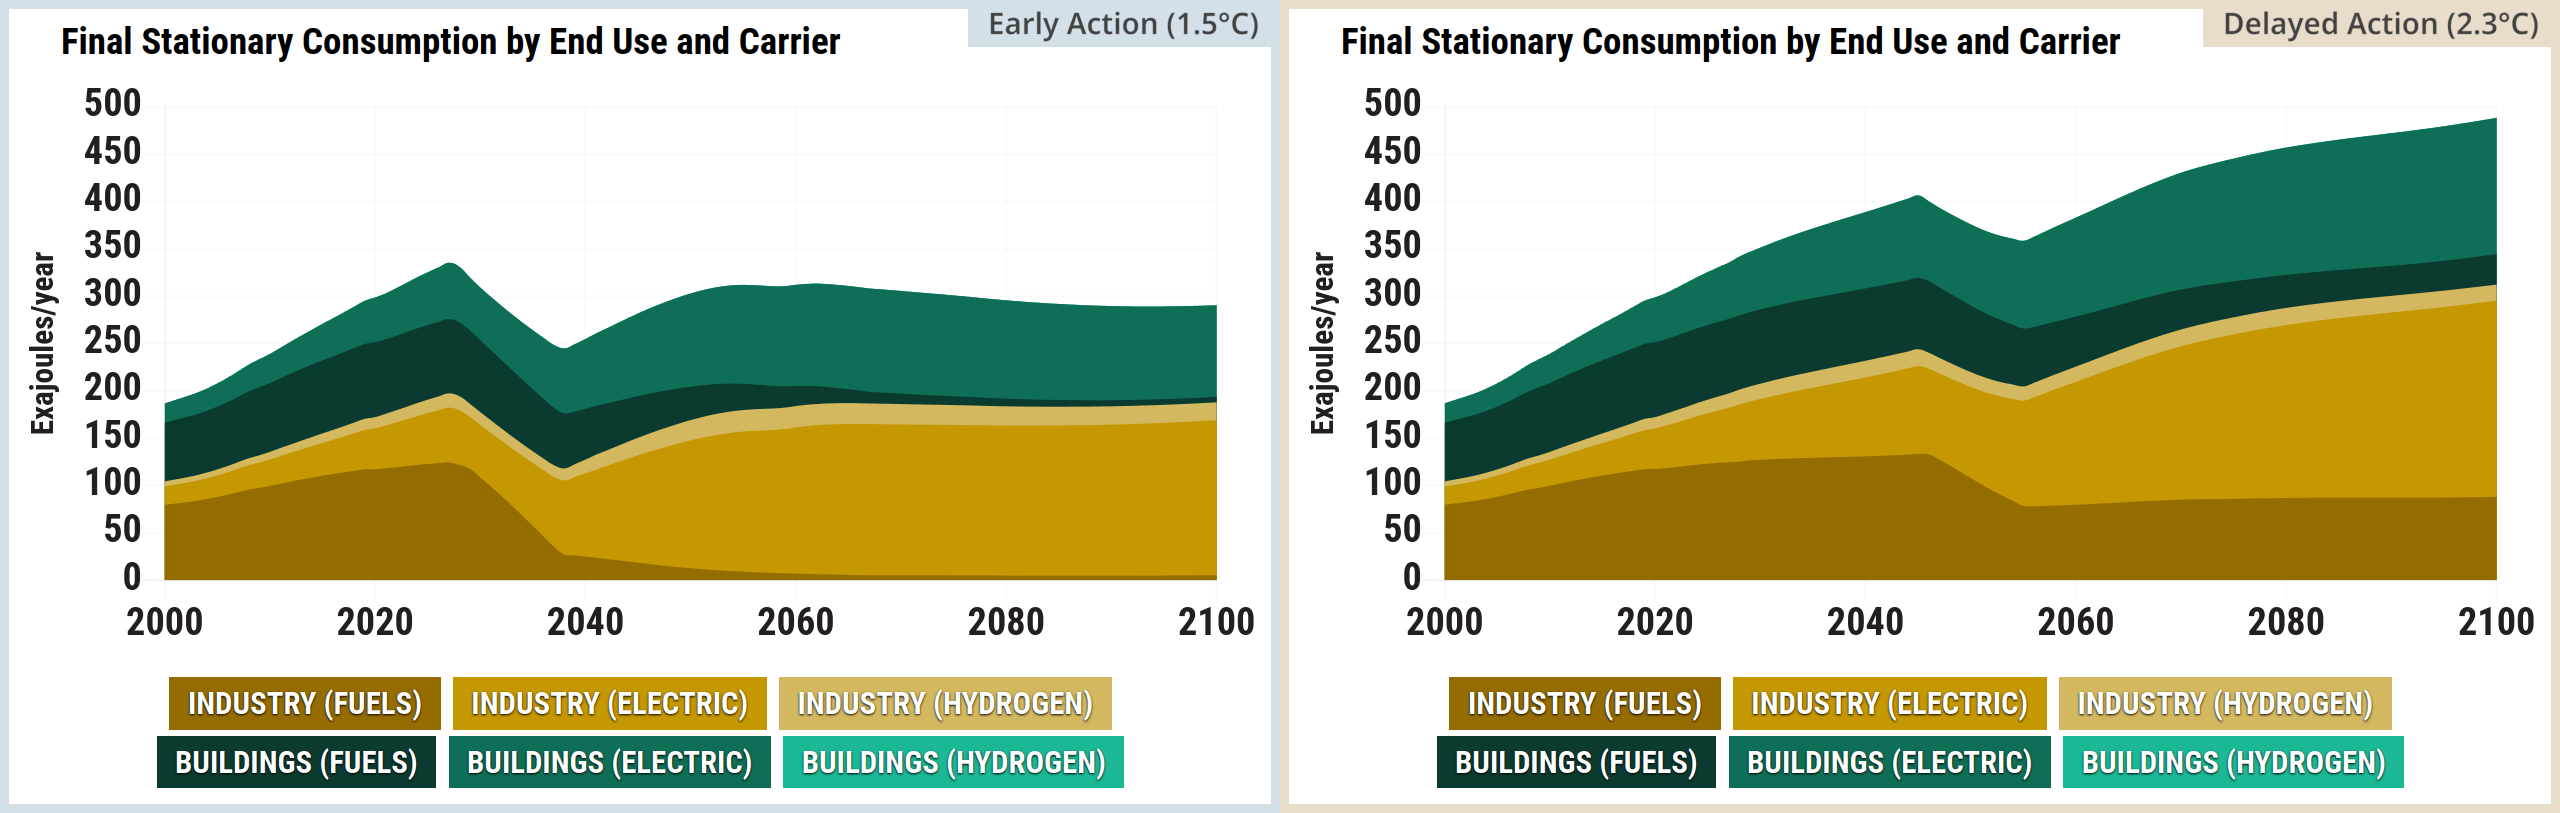
Source: Climate Interactive & MIT Sloan (2026) En-ROADS Simulator (Version 26.8.0)
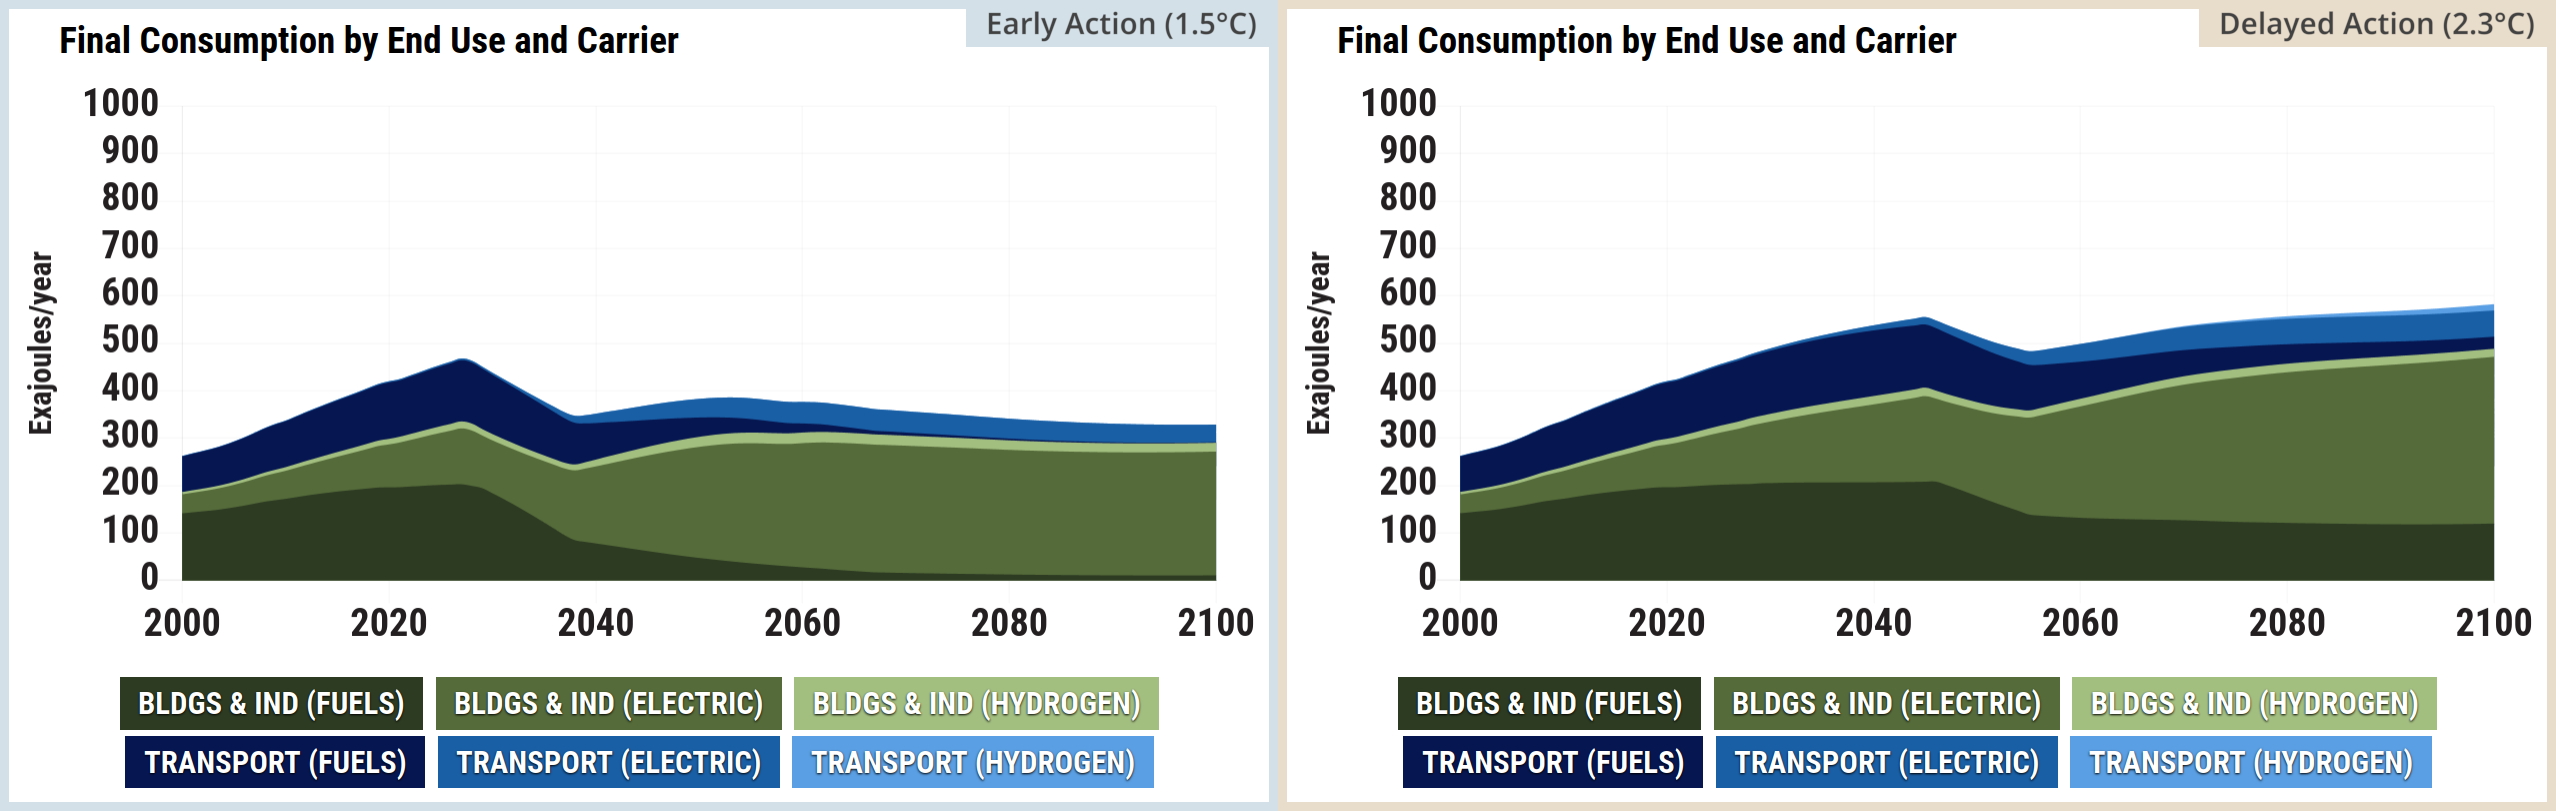
Source: Climate Interactive & MIT Sloan (2026) En-ROADS Simulator (Version 26.8.0)
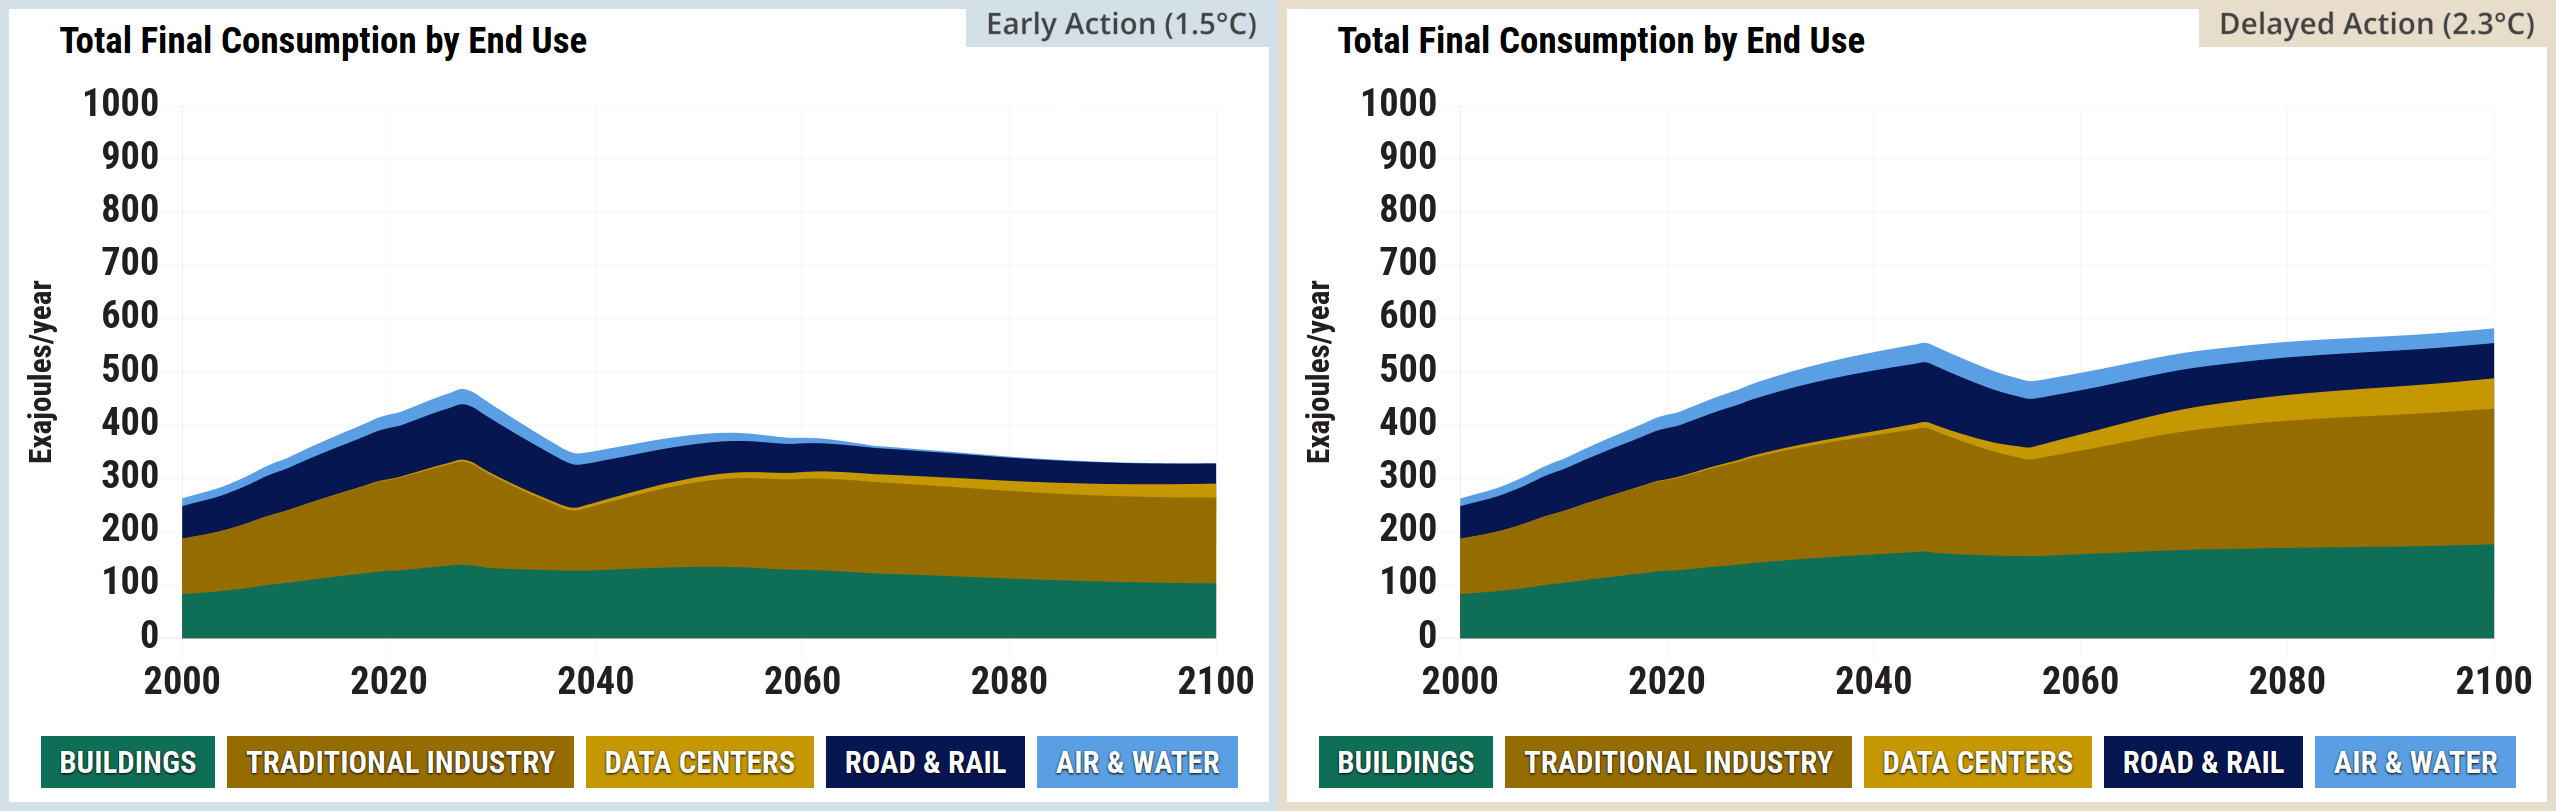
Source: Climate Interactive & MIT Sloan (2026) En-ROADS Simulator (Version 26.8.0)
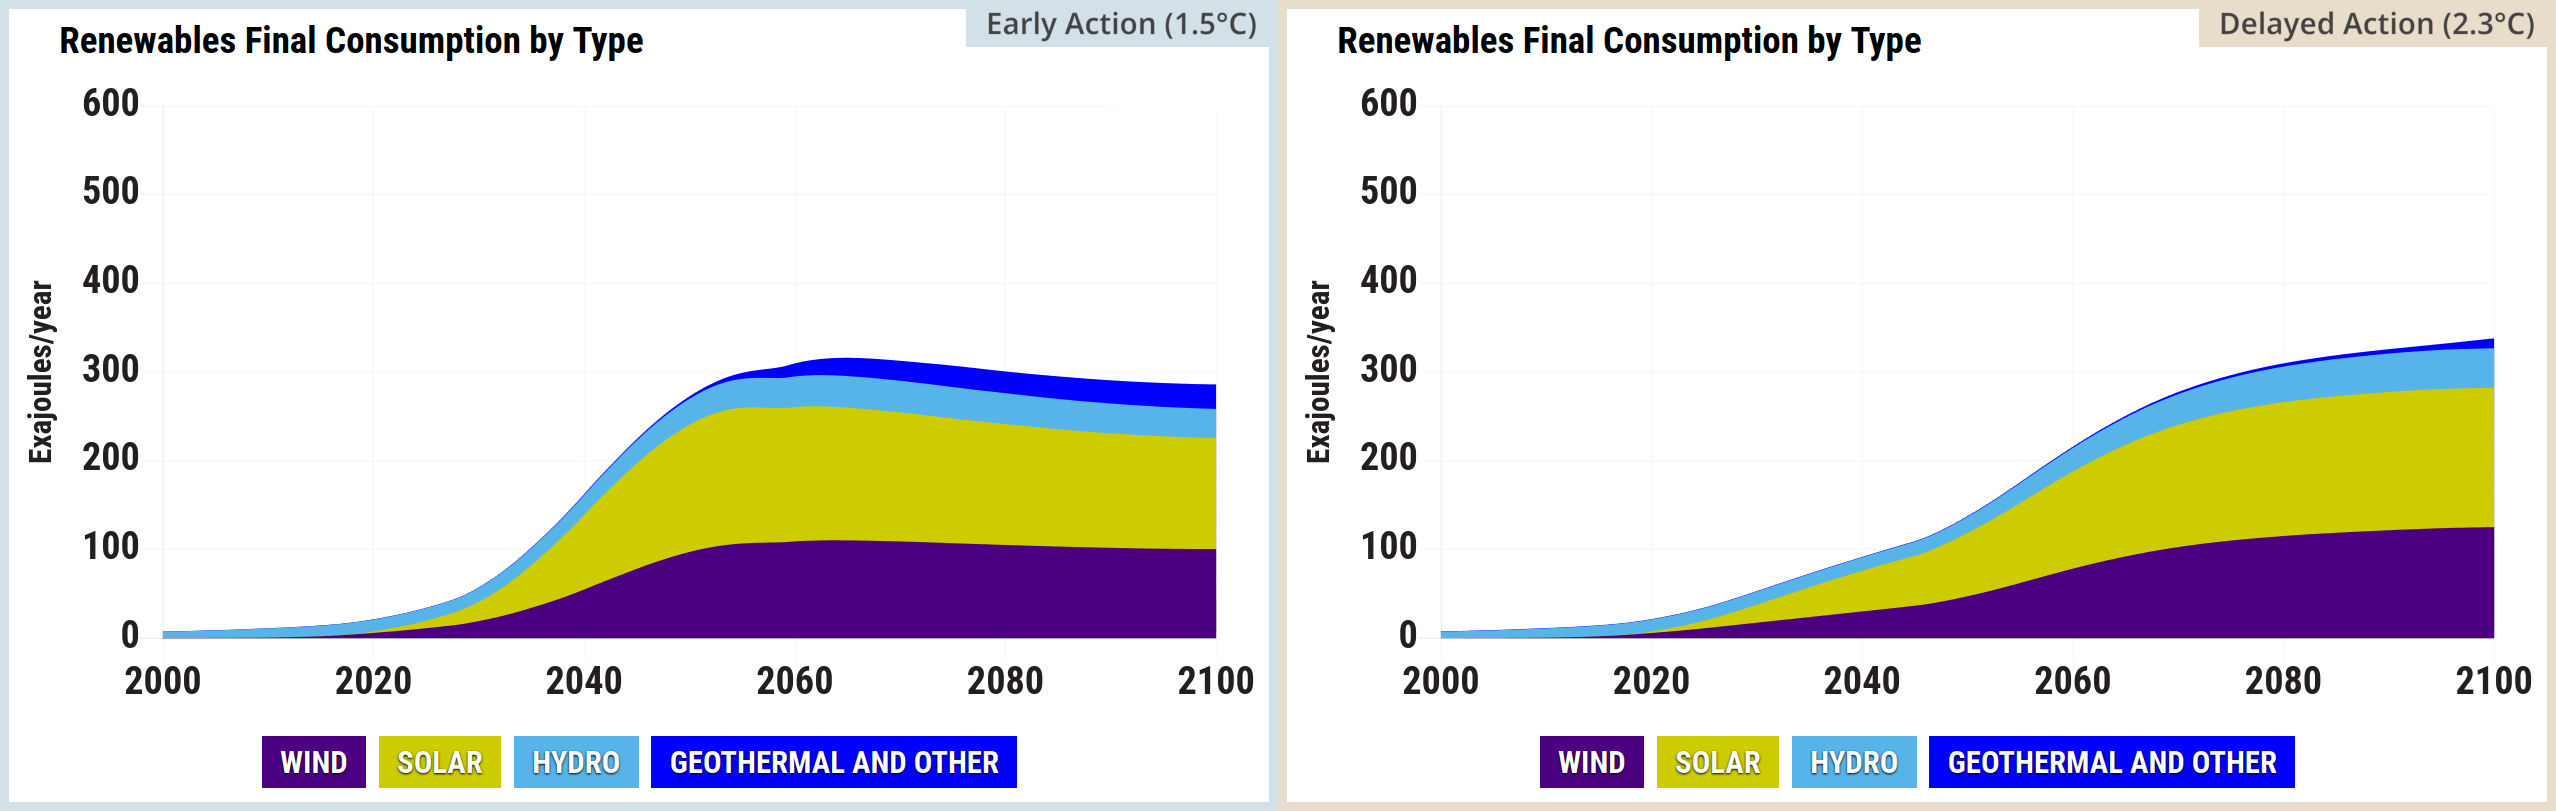
Source: Climate Interactive & MIT Sloan (2026) En-ROADS Simulator (Version 26.8.0)
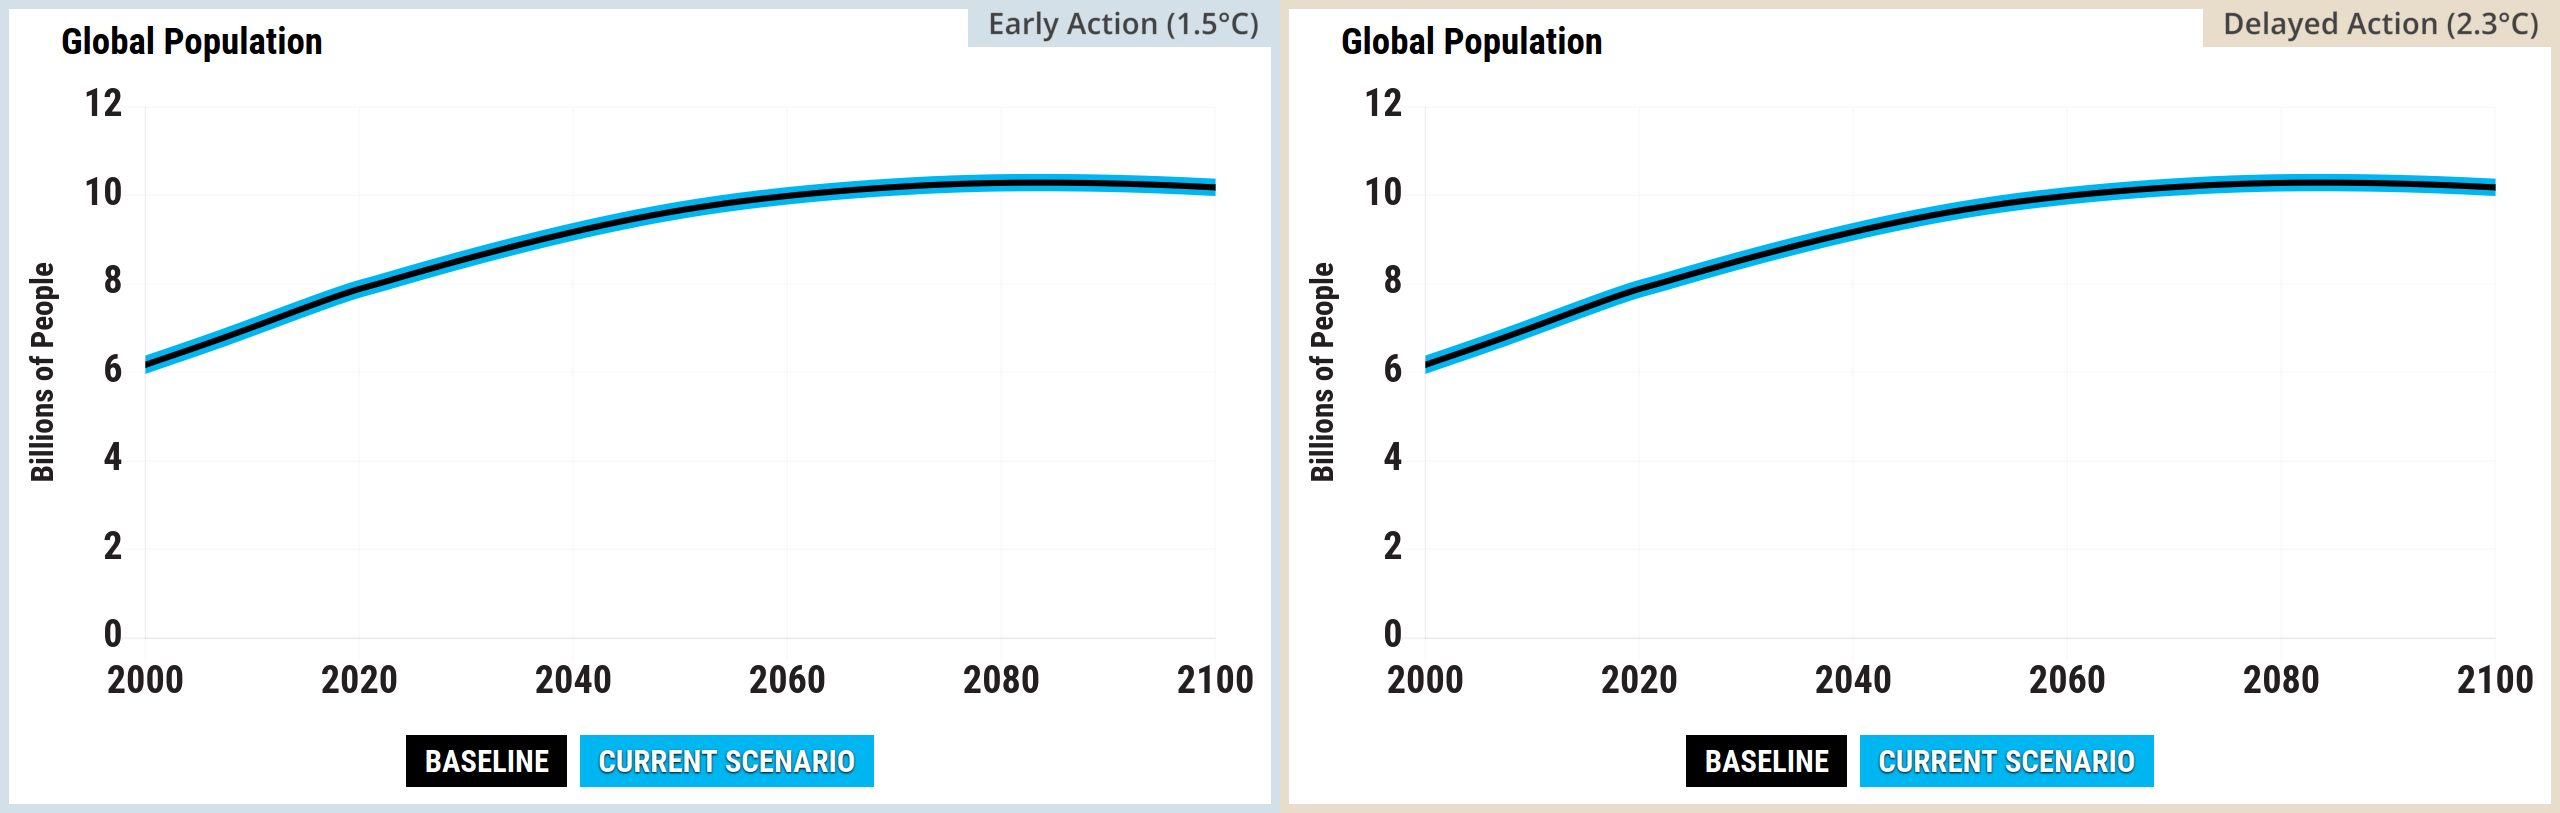
Source: Climate Interactive & MIT Sloan (2026) En-ROADS Simulator (Version 26.8.0)
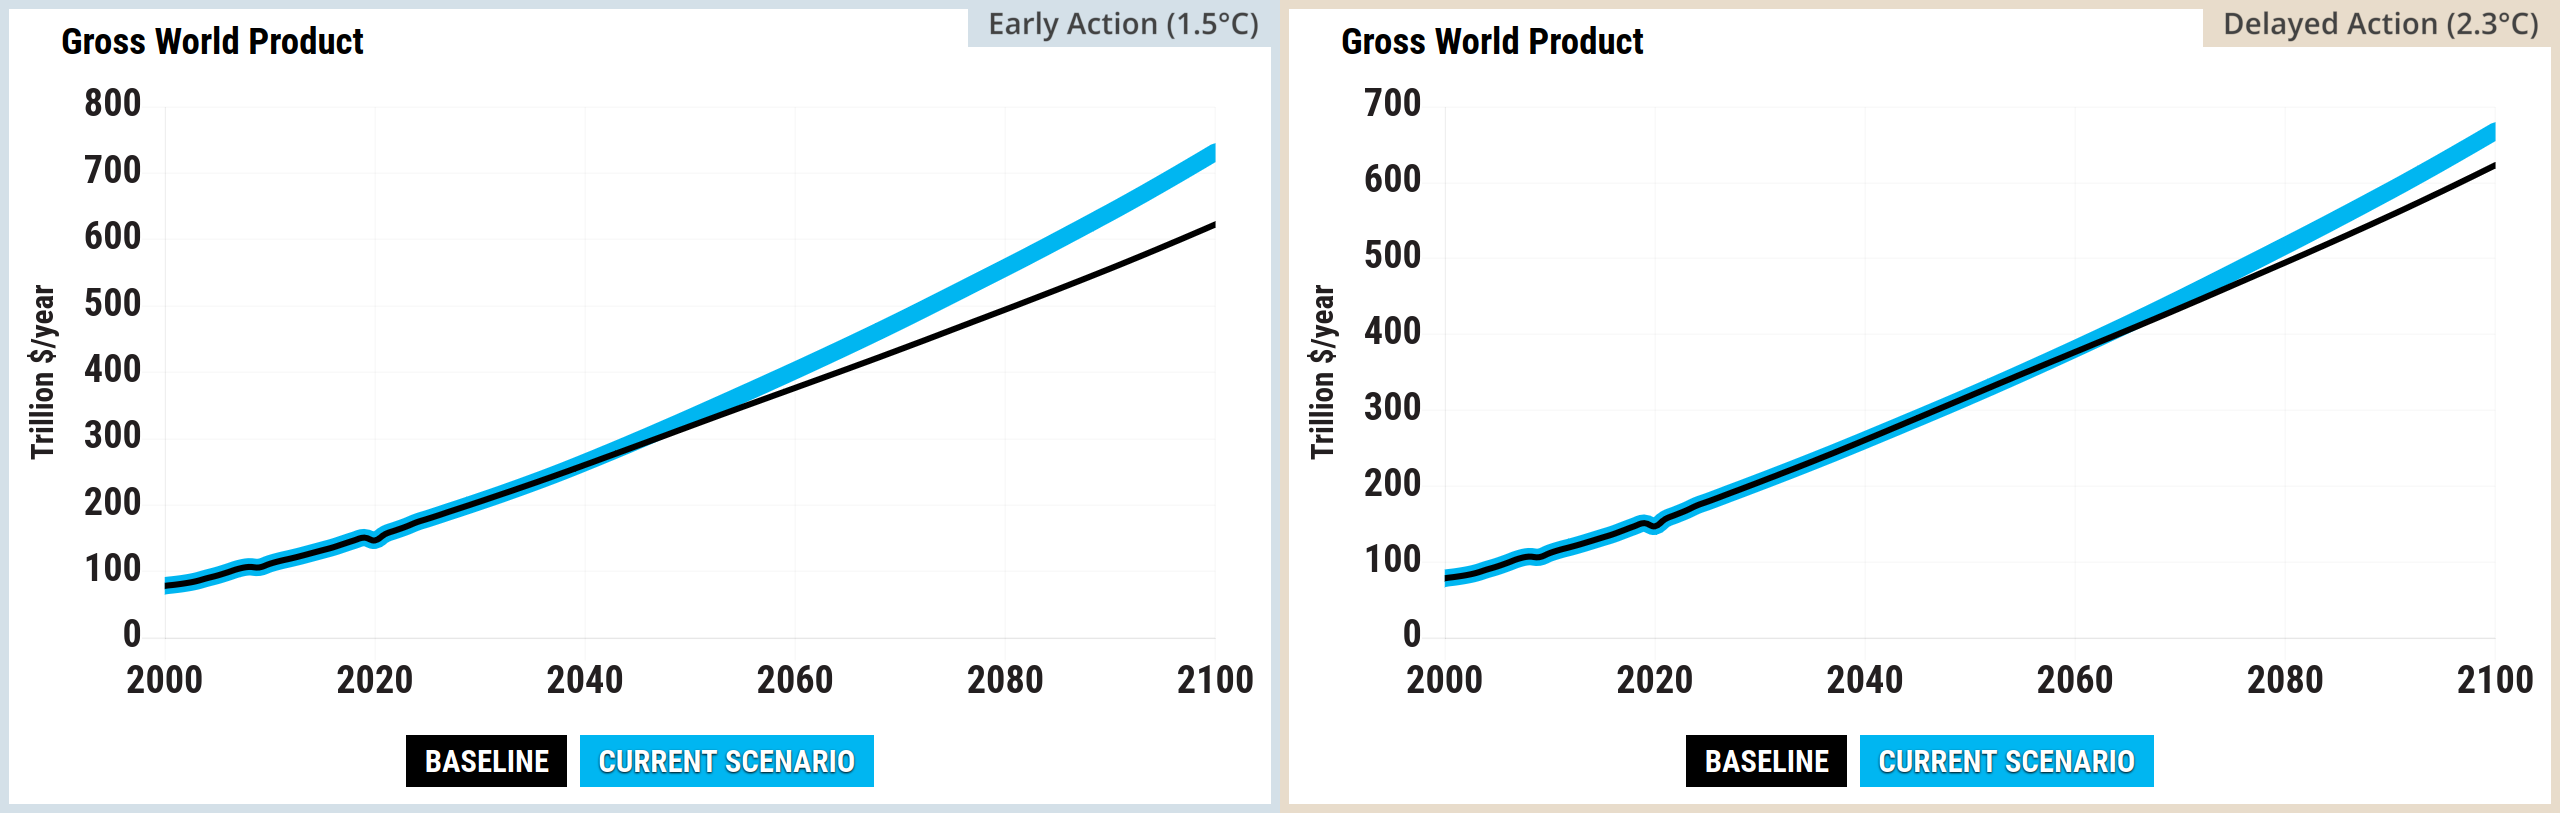
Source: Climate Interactive & MIT Sloan (2026) En-ROADS Simulator (Version 26.8.0)
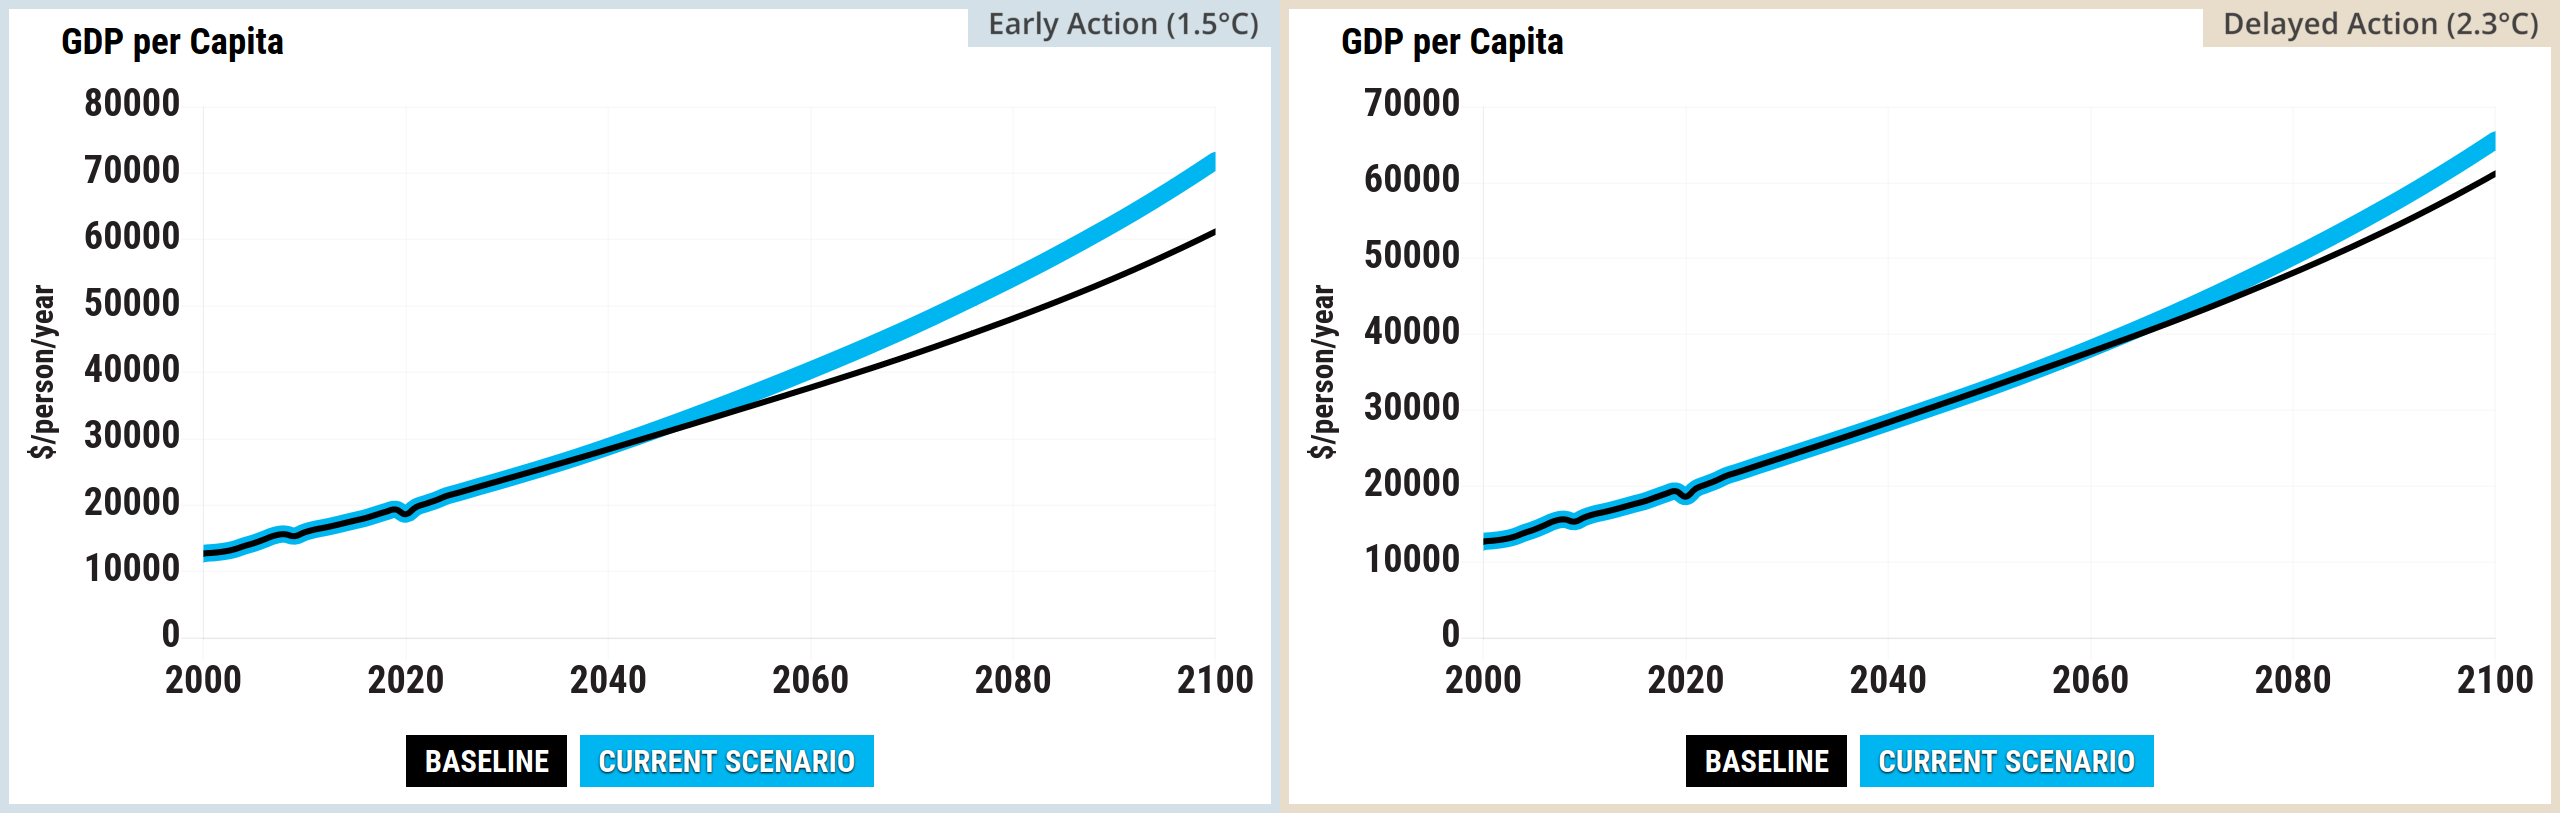
Source: Climate Interactive & MIT Sloan (2026) En-ROADS Simulator (Version 26.8.0)
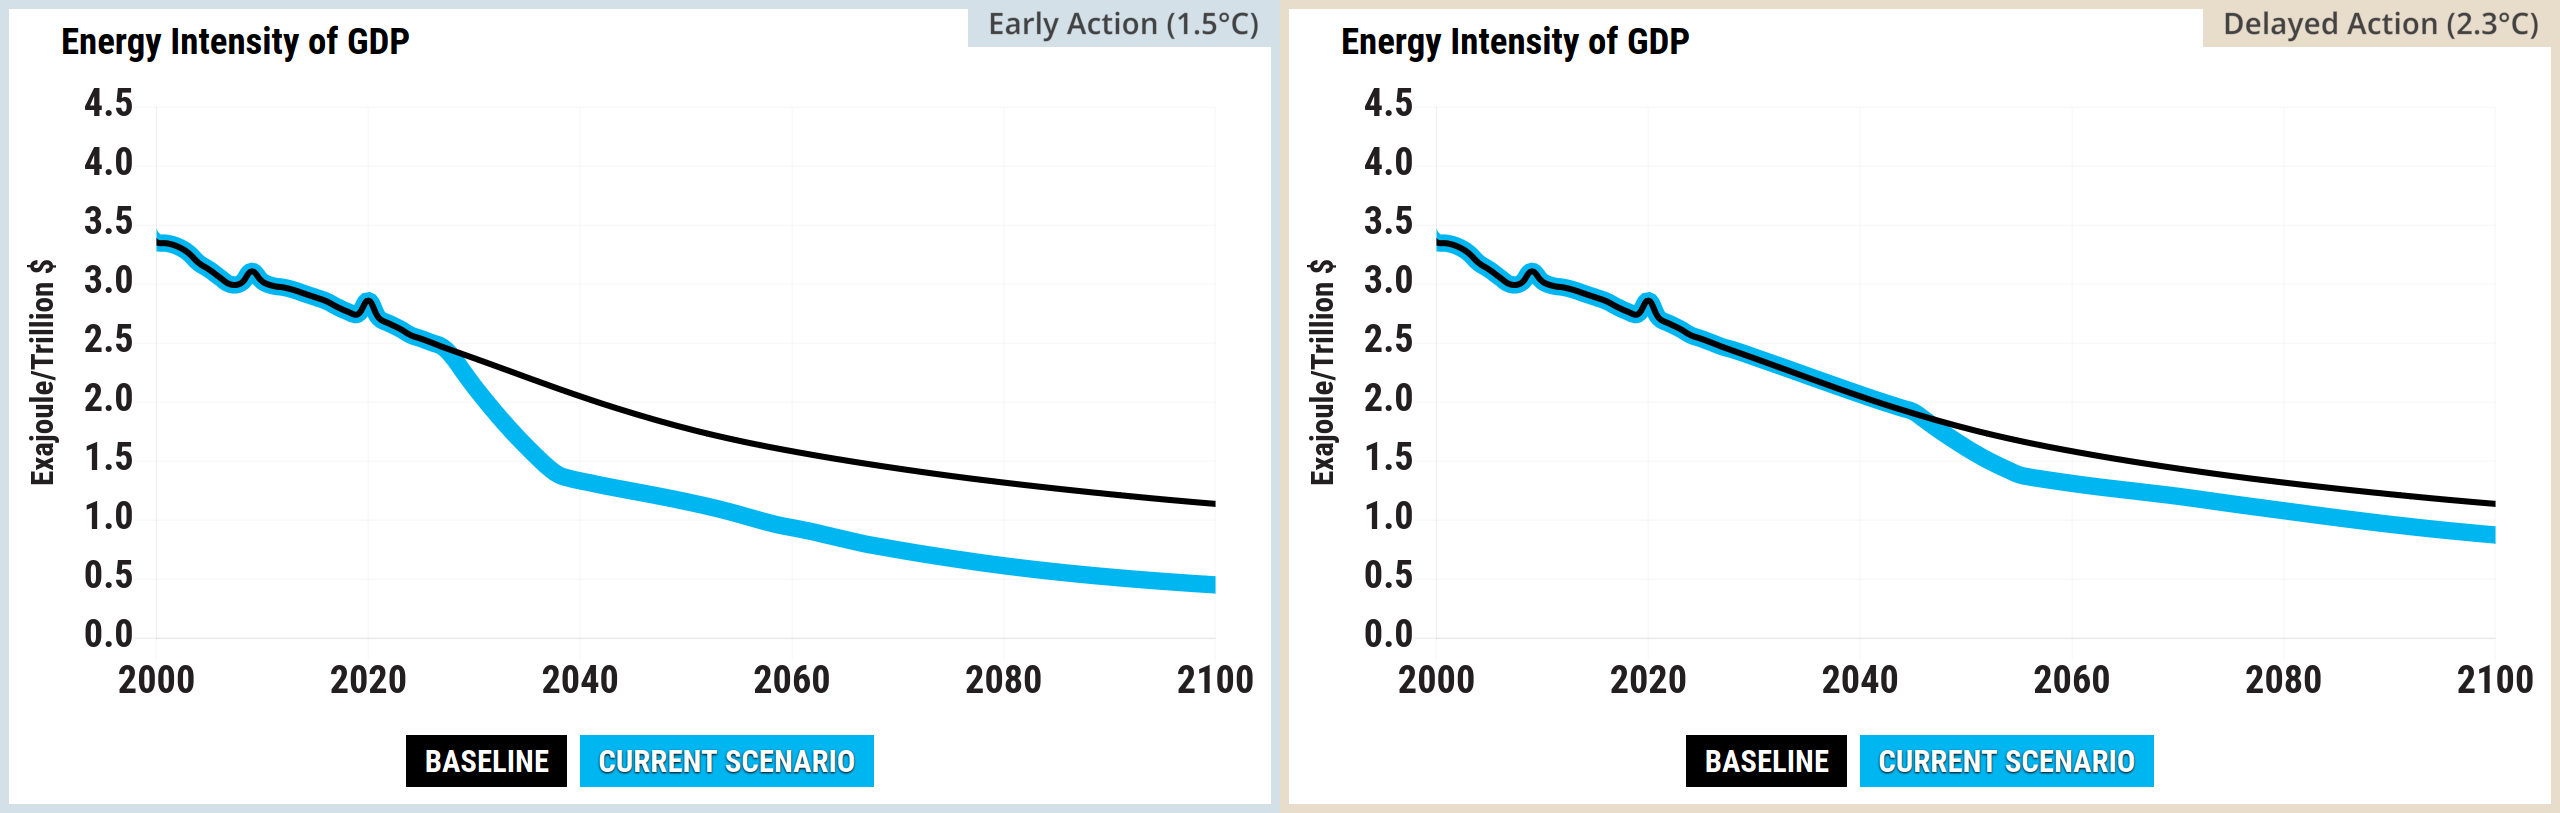
Source: Climate Interactive & MIT Sloan (2026) En-ROADS Simulator (Version 26.8.0)
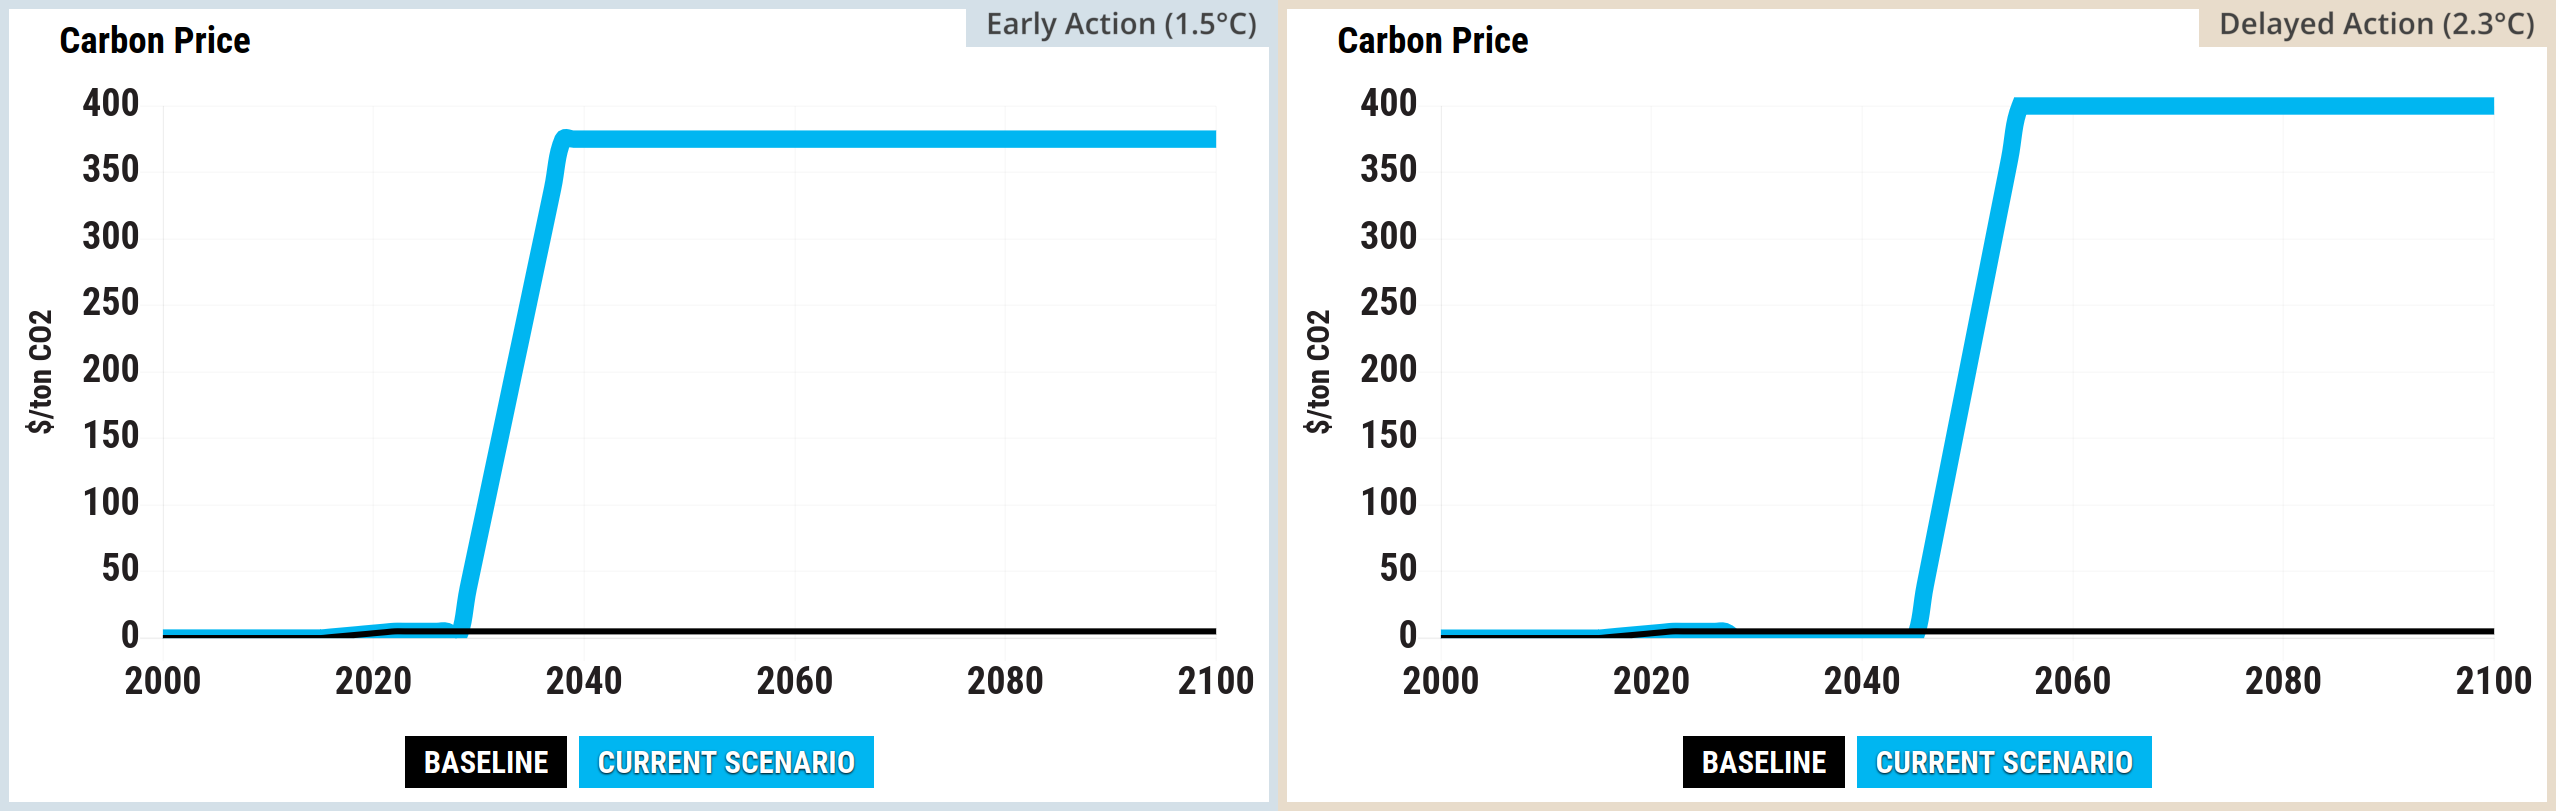
Source: Climate Interactive & MIT Sloan (2026) En-ROADS Simulator (Version 26.8.0)
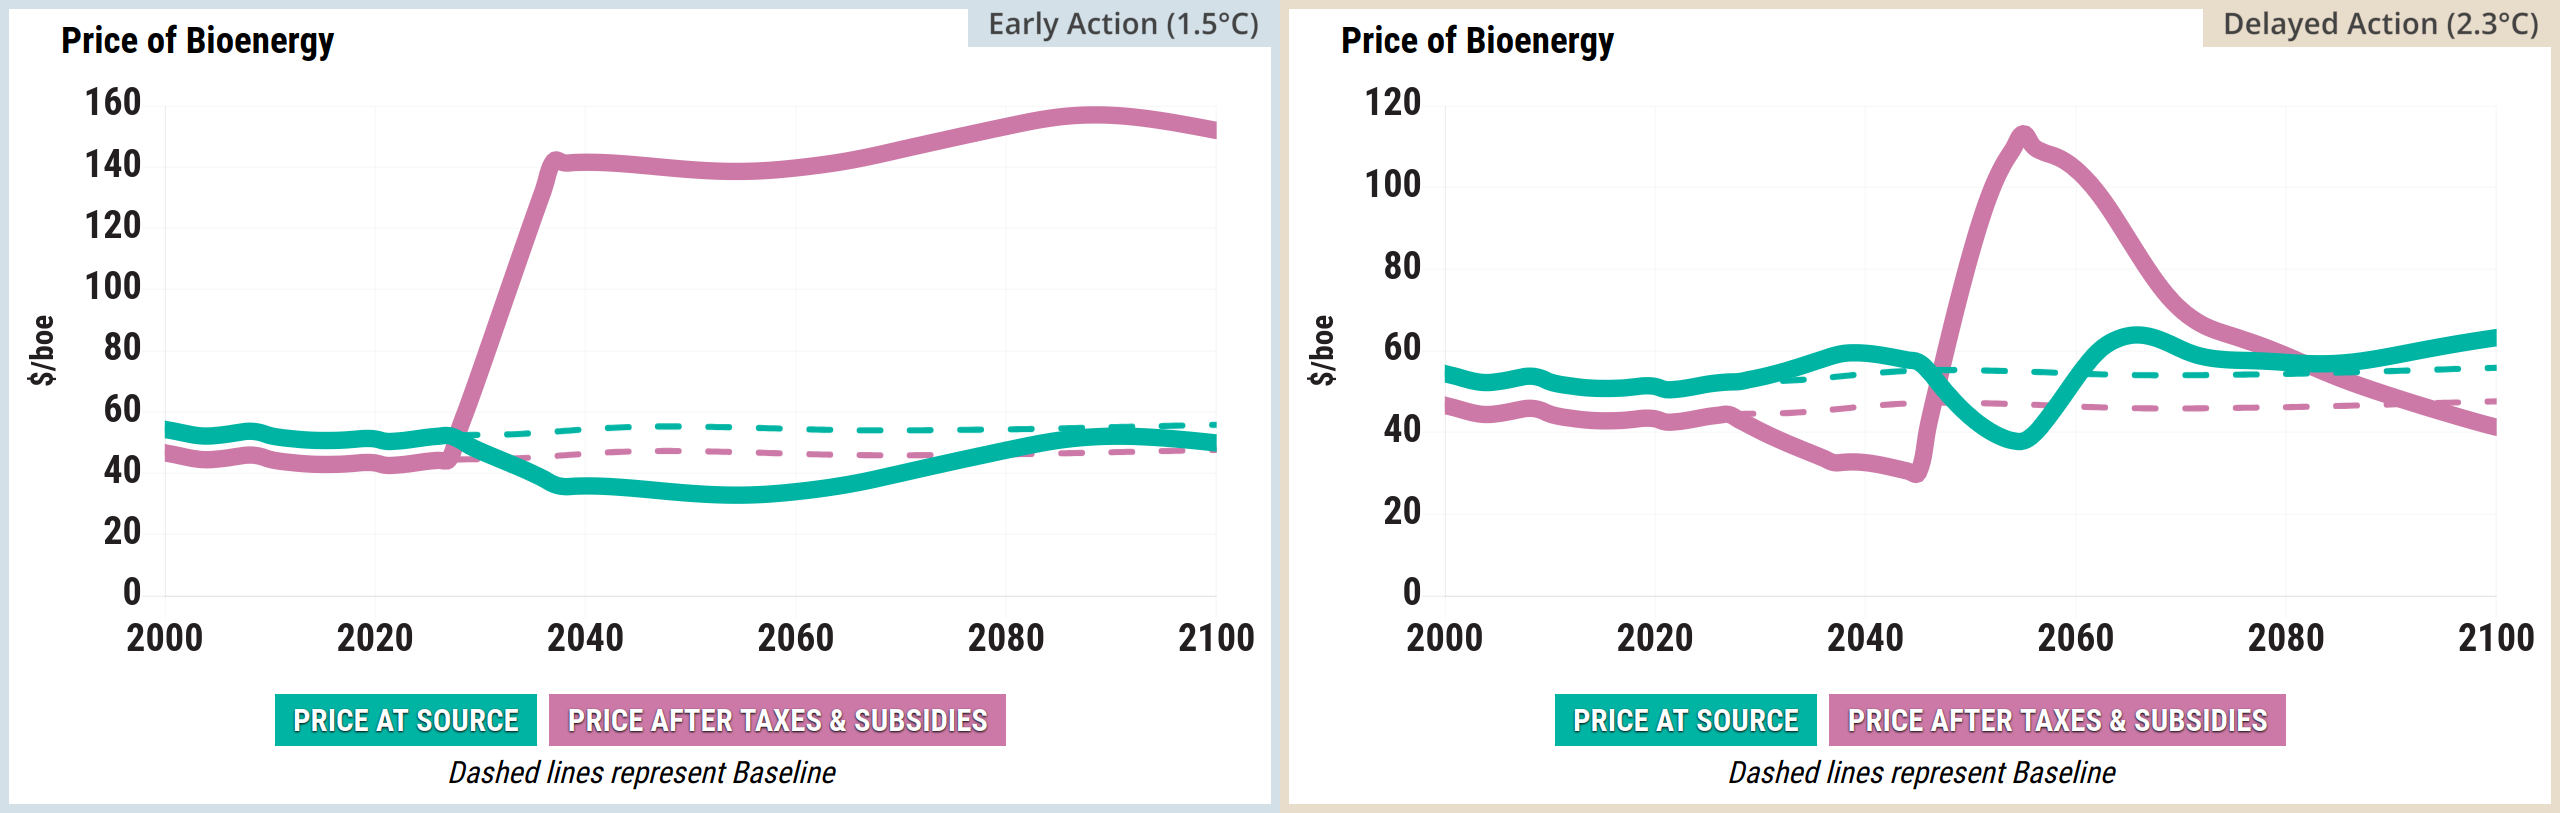
Source: Climate Interactive & MIT Sloan (2026) En-ROADS Simulator (Version 26.8.0)
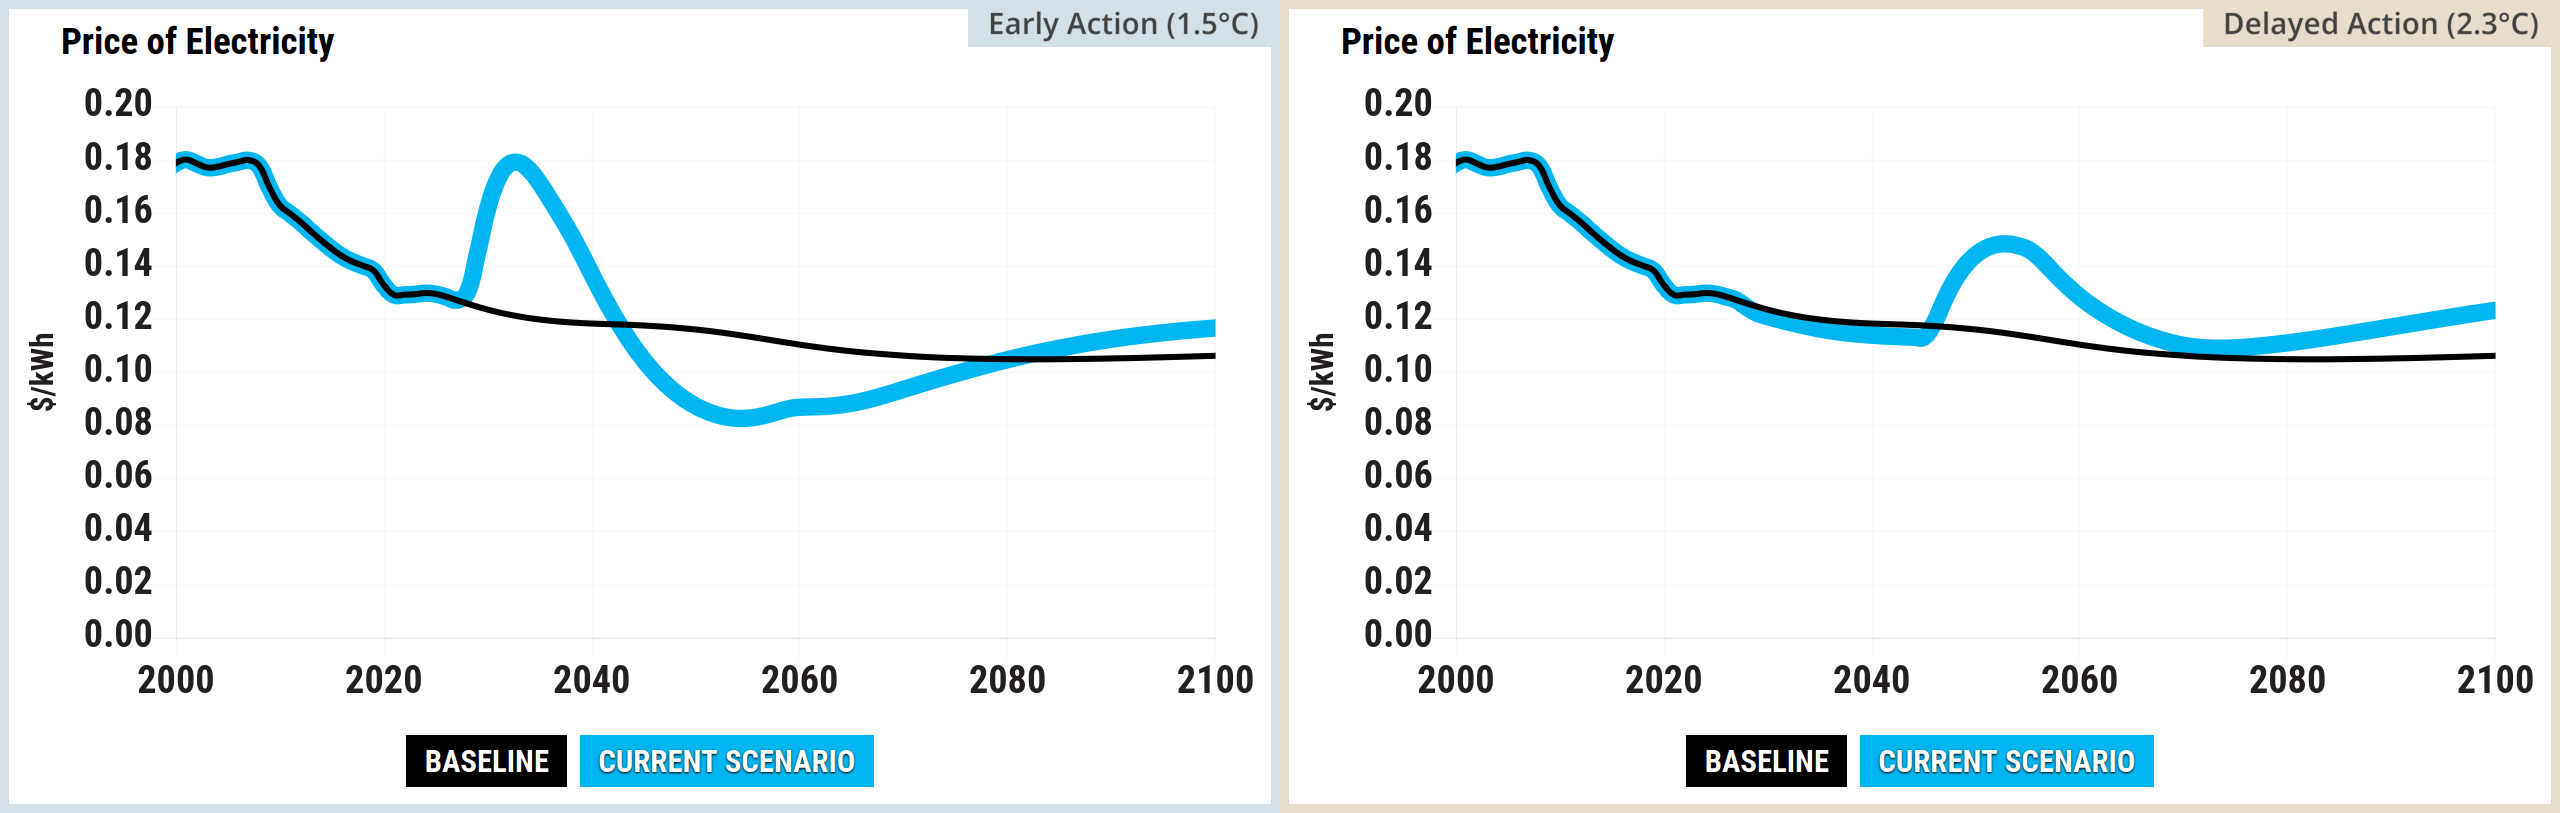
Source: Climate Interactive & MIT Sloan (2026) En-ROADS Simulator (Version 26.8.0)
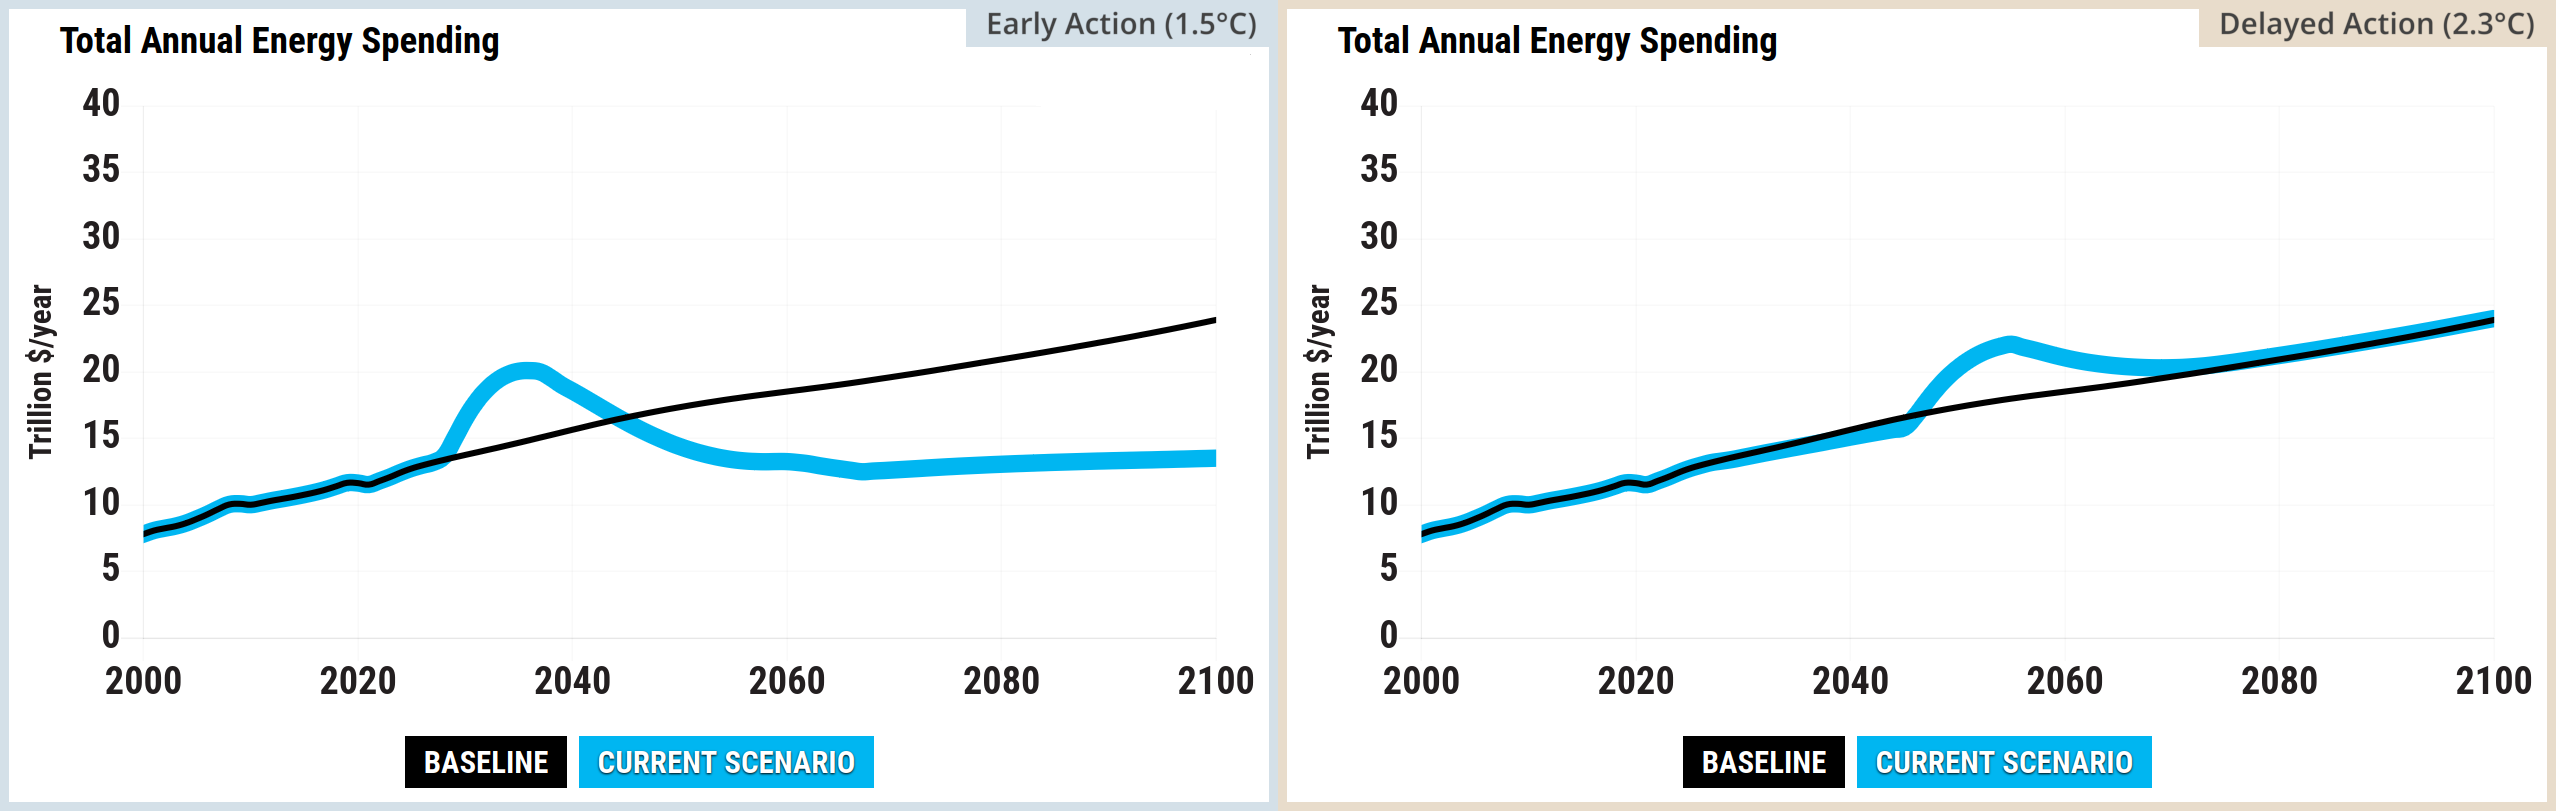
Source: Climate Interactive & MIT Sloan (2026) En-ROADS Simulator (Version 26.8.0)
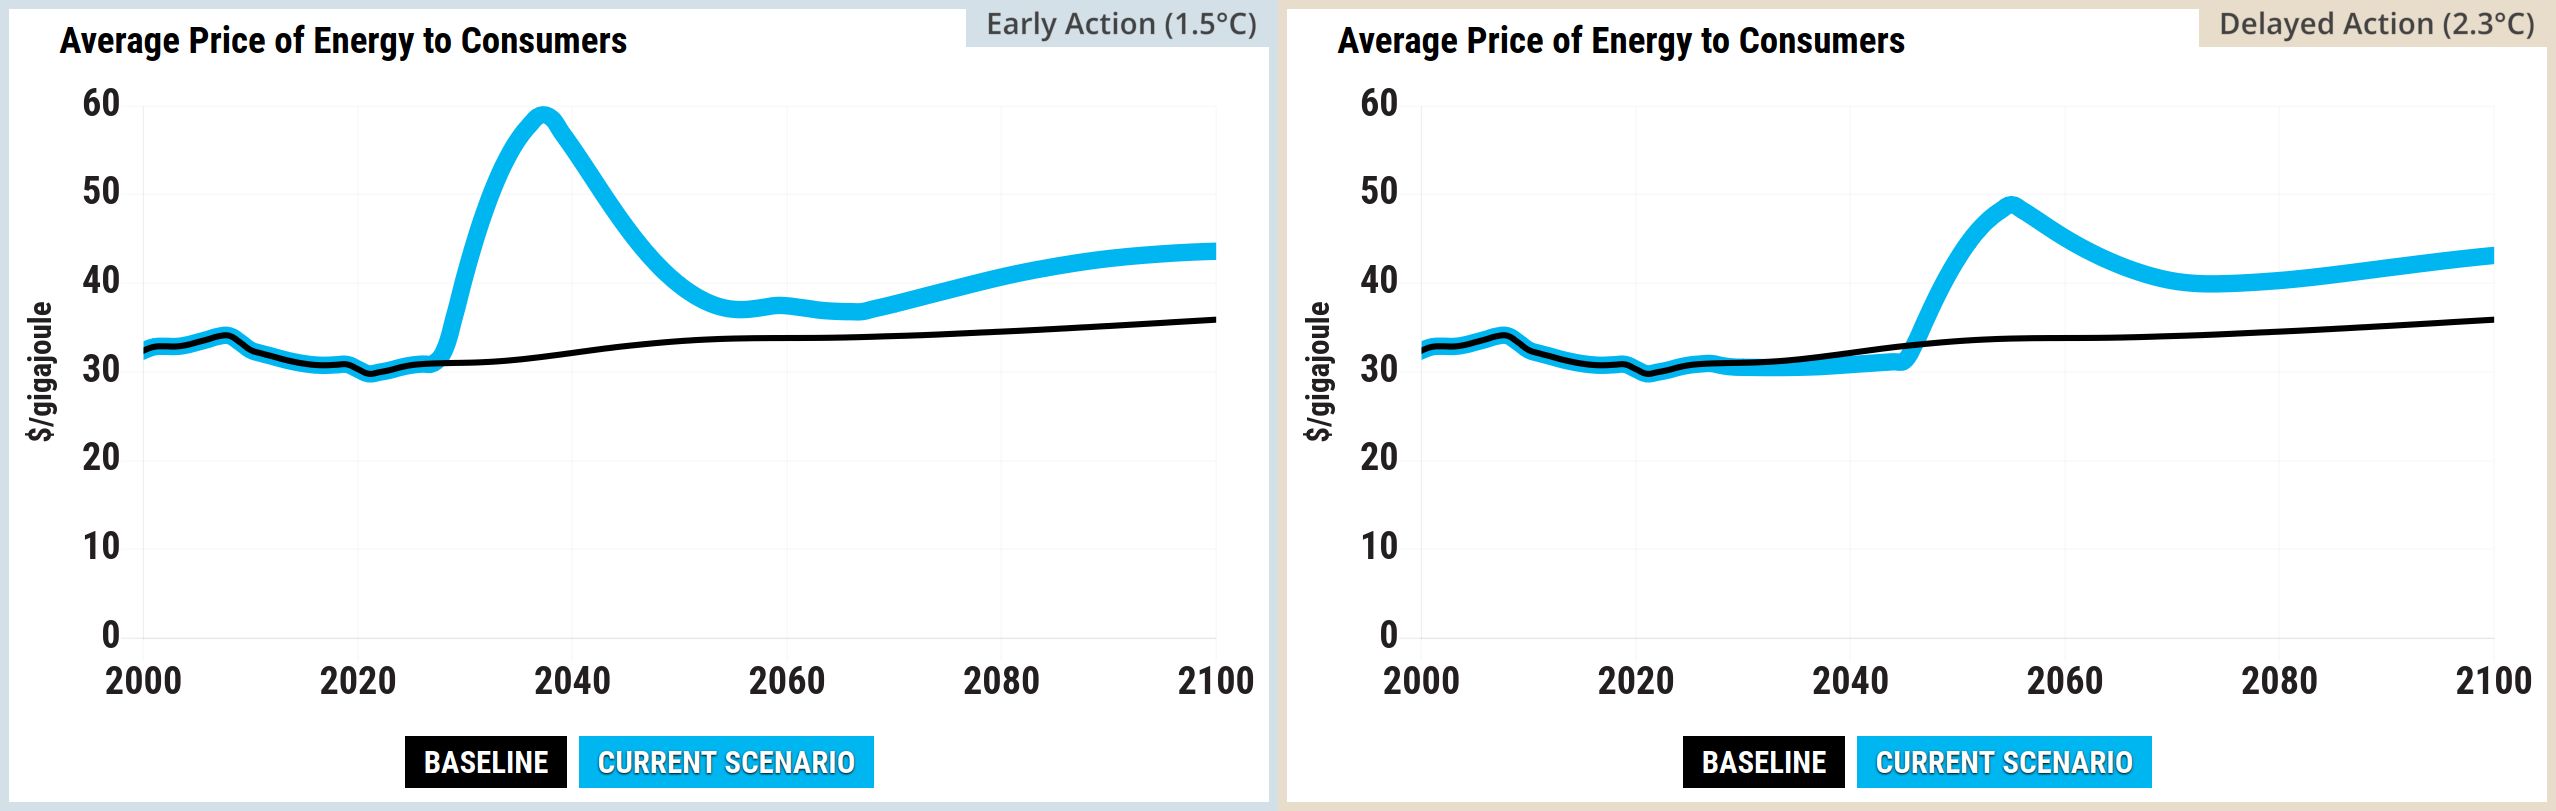
Source: Climate Interactive & MIT Sloan (2026) En-ROADS Simulator (Version 26.8.0)
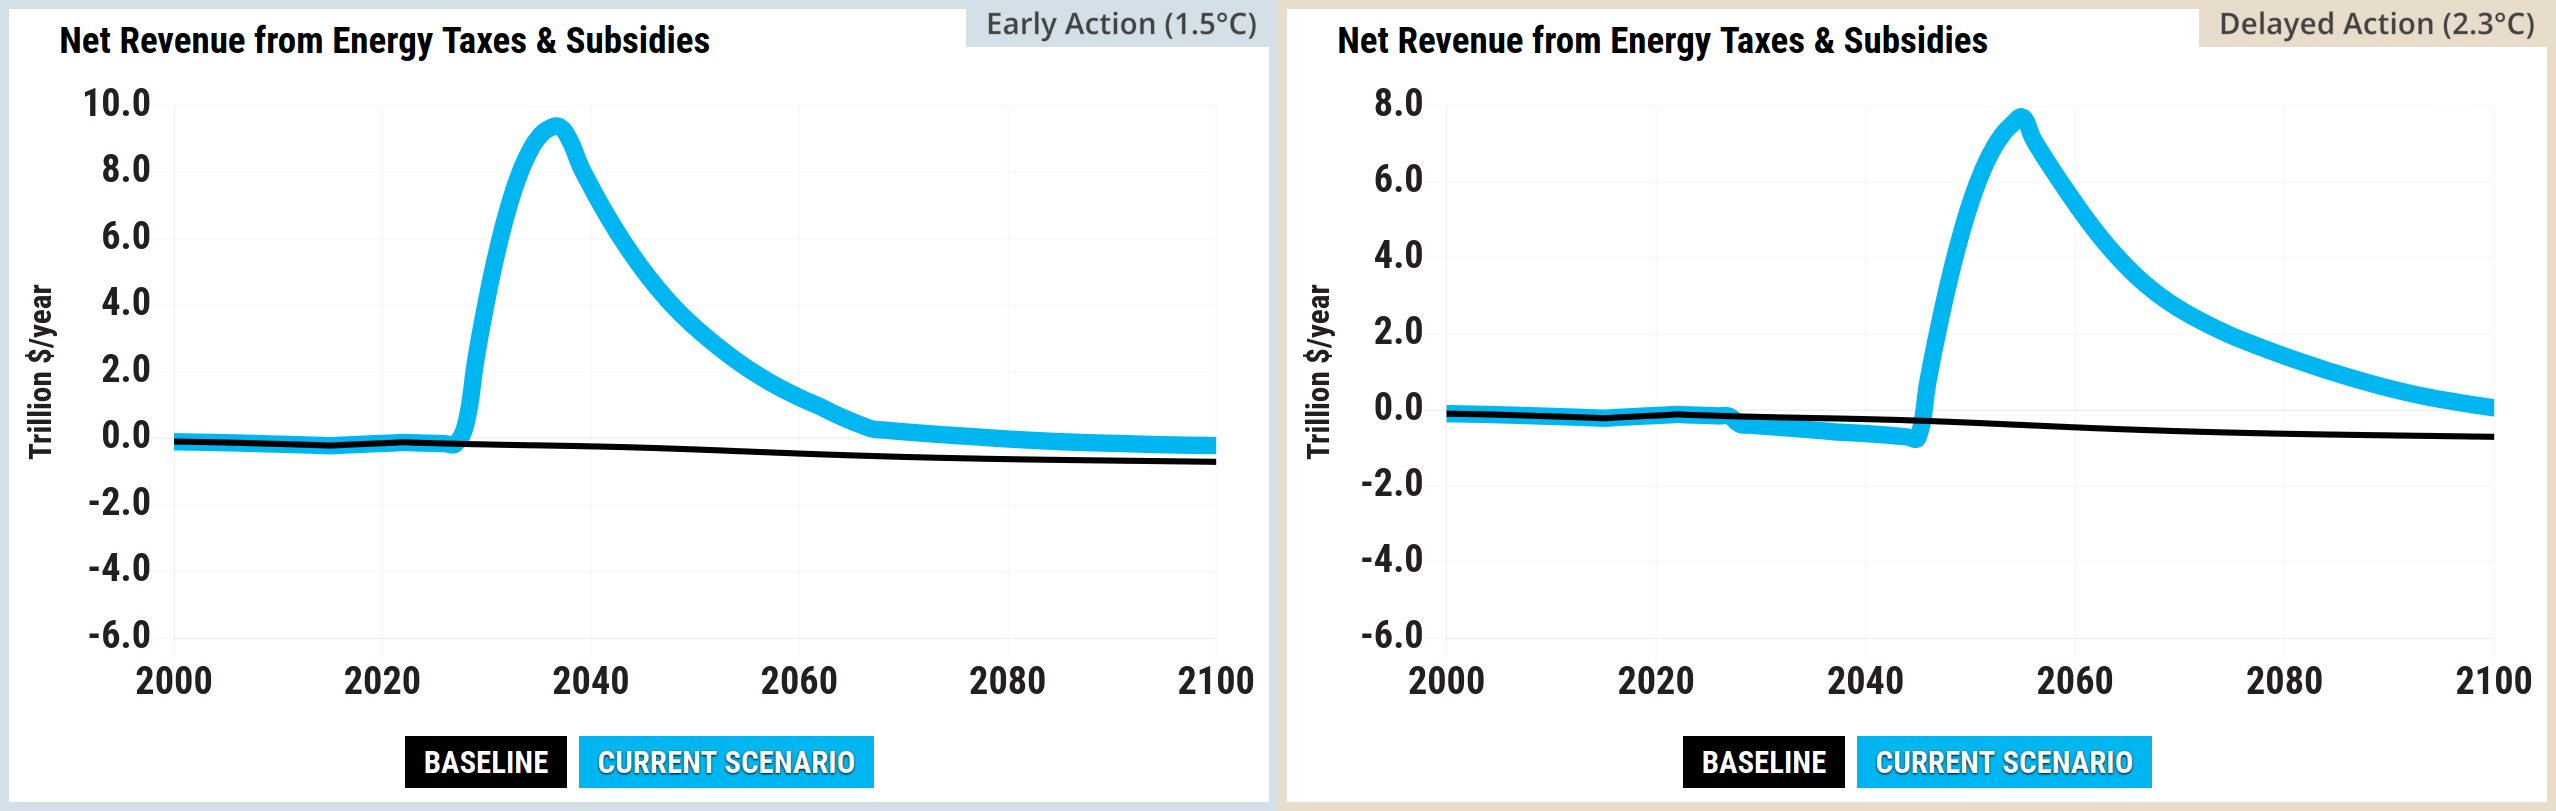
Source: Climate Interactive & MIT Sloan (2026) En-ROADS Simulator (Version 26.8.0)
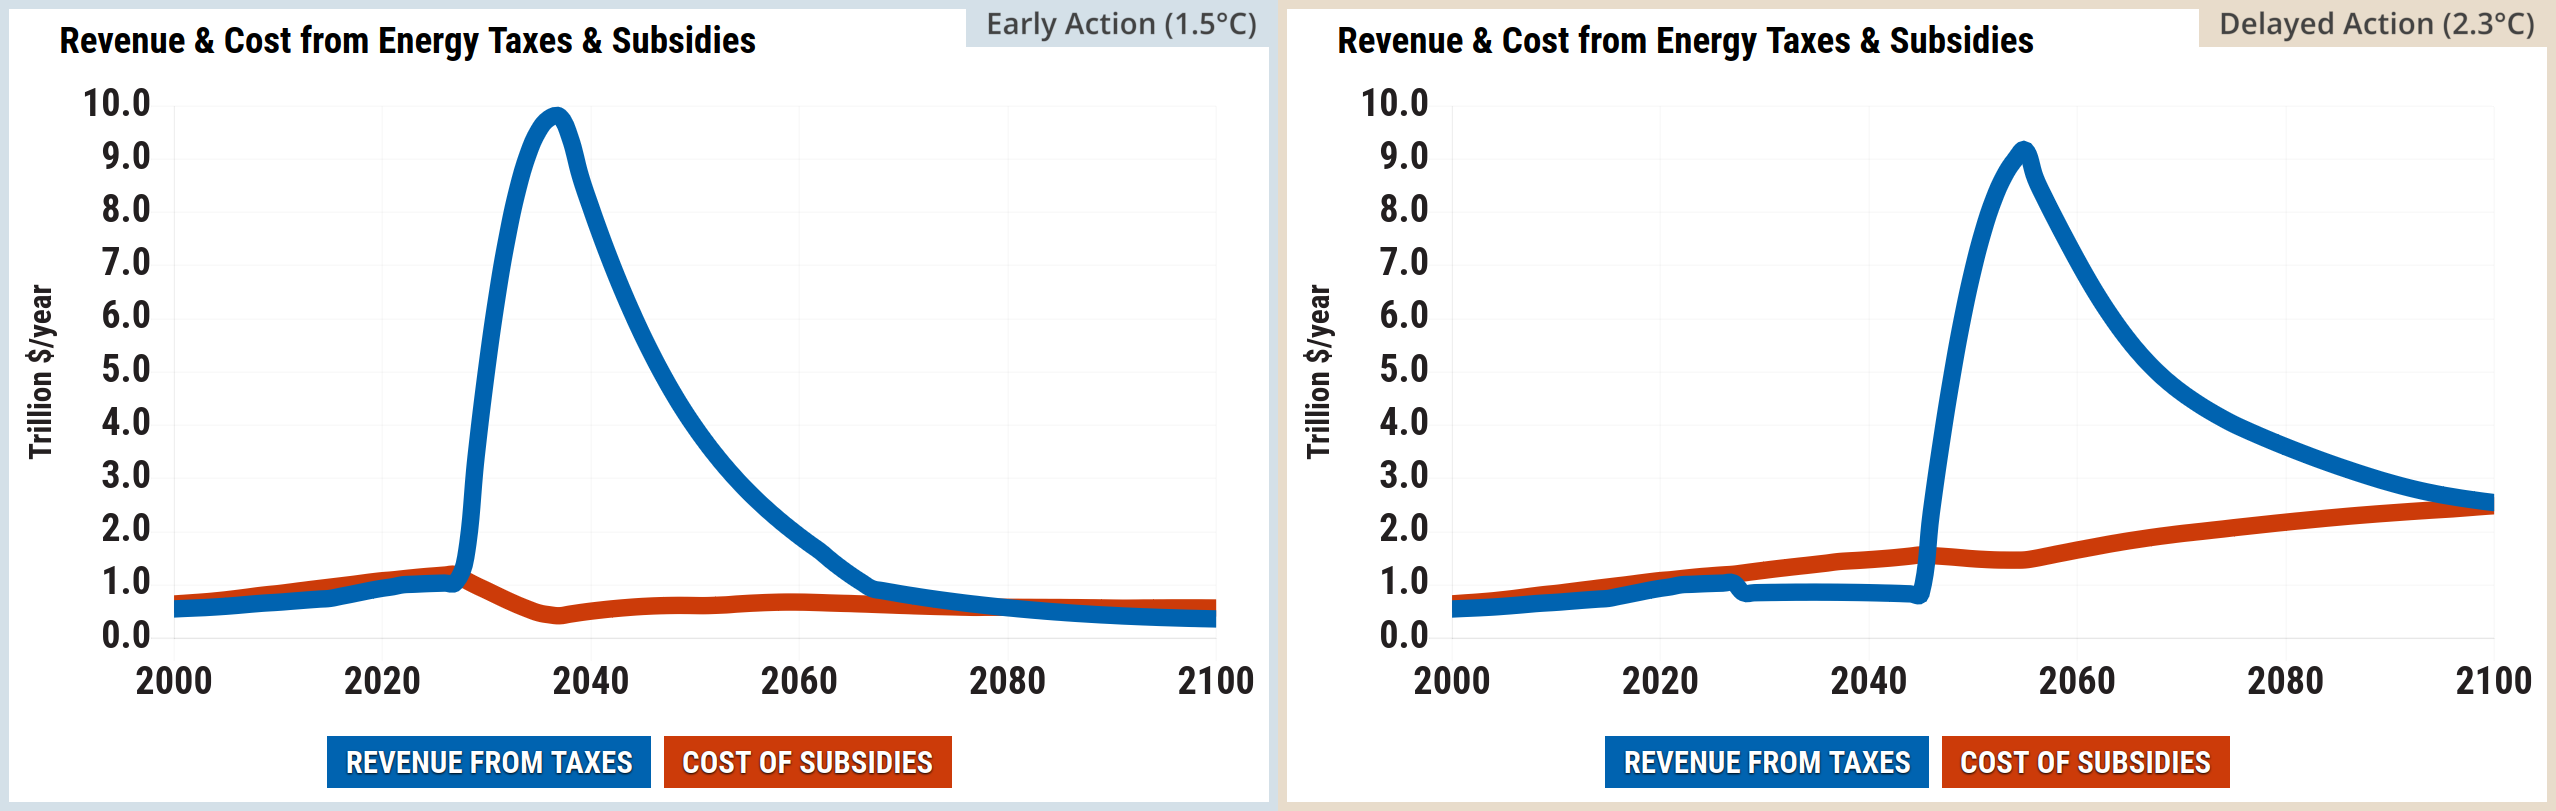
Source: Climate Interactive & MIT Sloan (2026) En-ROADS Simulator (Version 26.8.0)
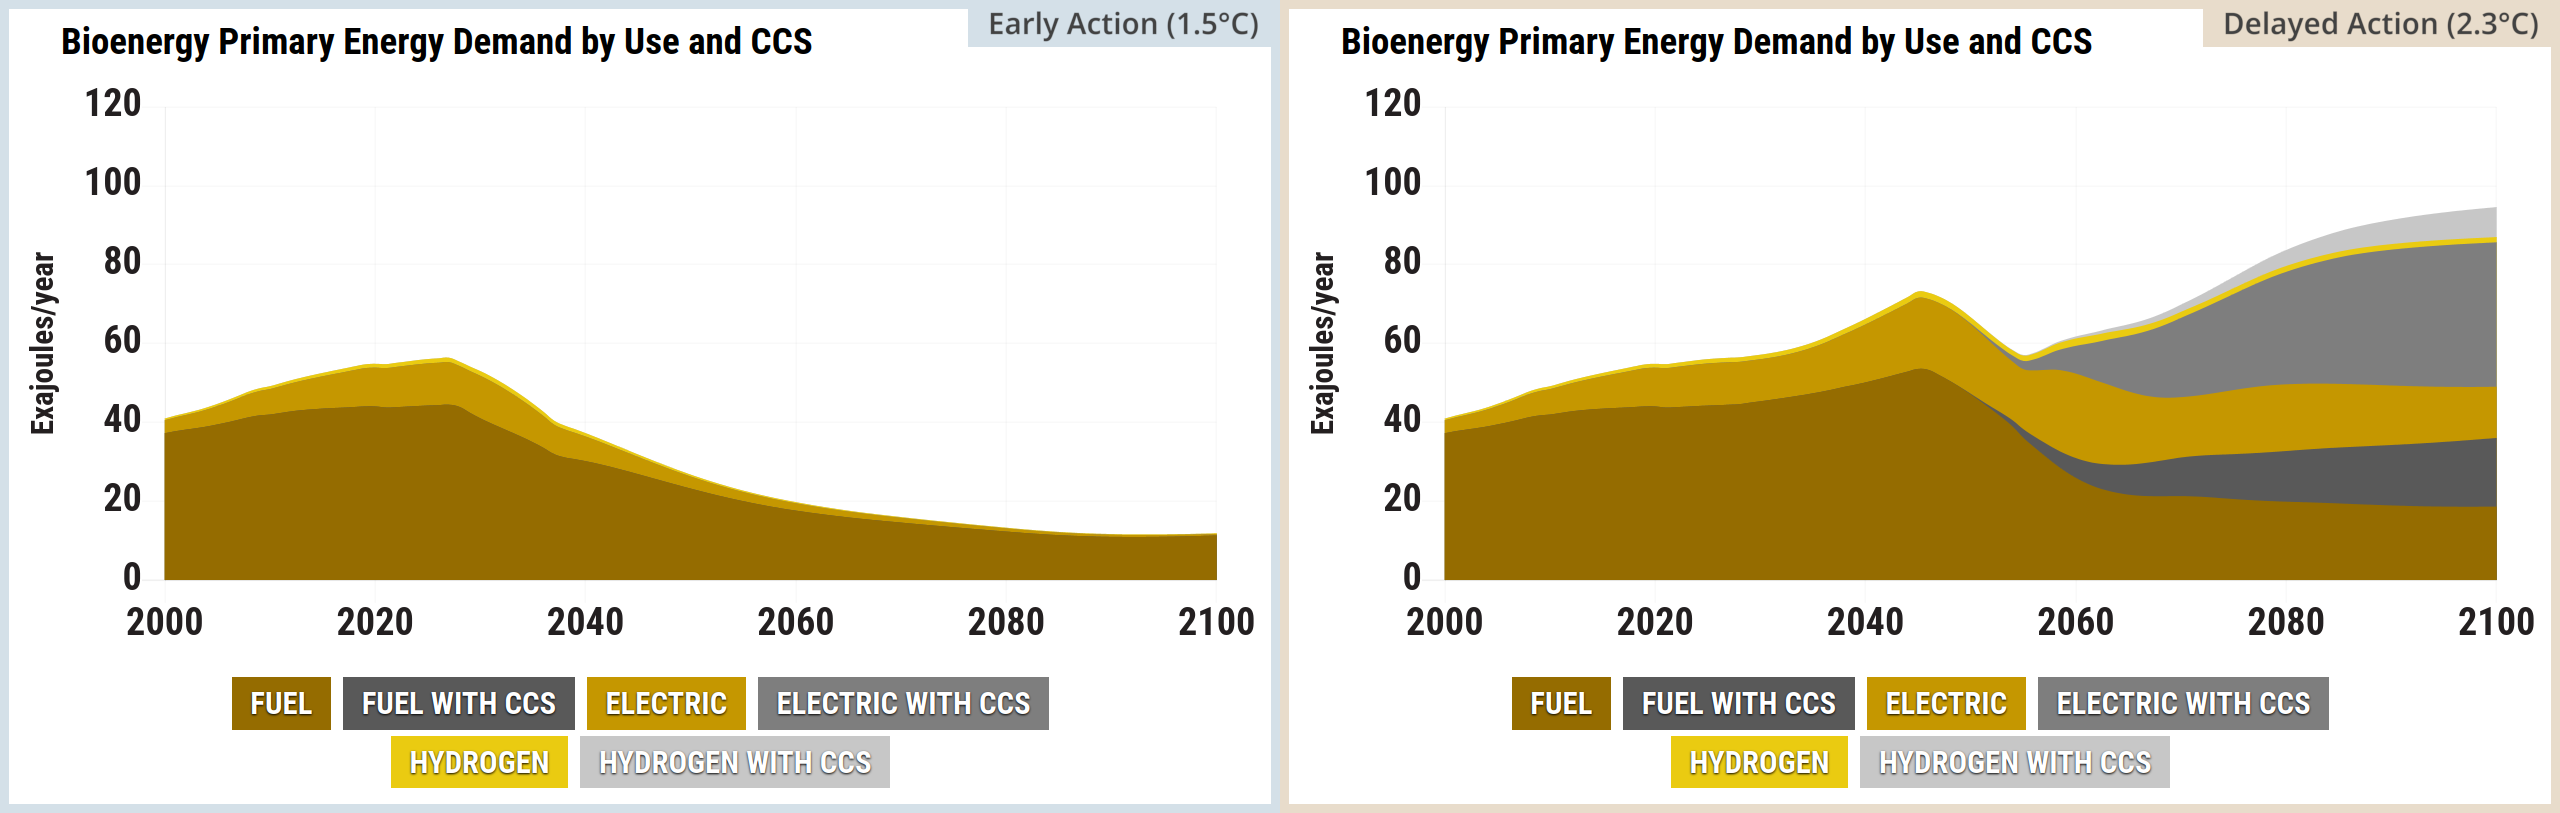
Source: Climate Interactive & MIT Sloan (2026) En-ROADS Simulator (Version 26.8.0)
Direct impacts to people
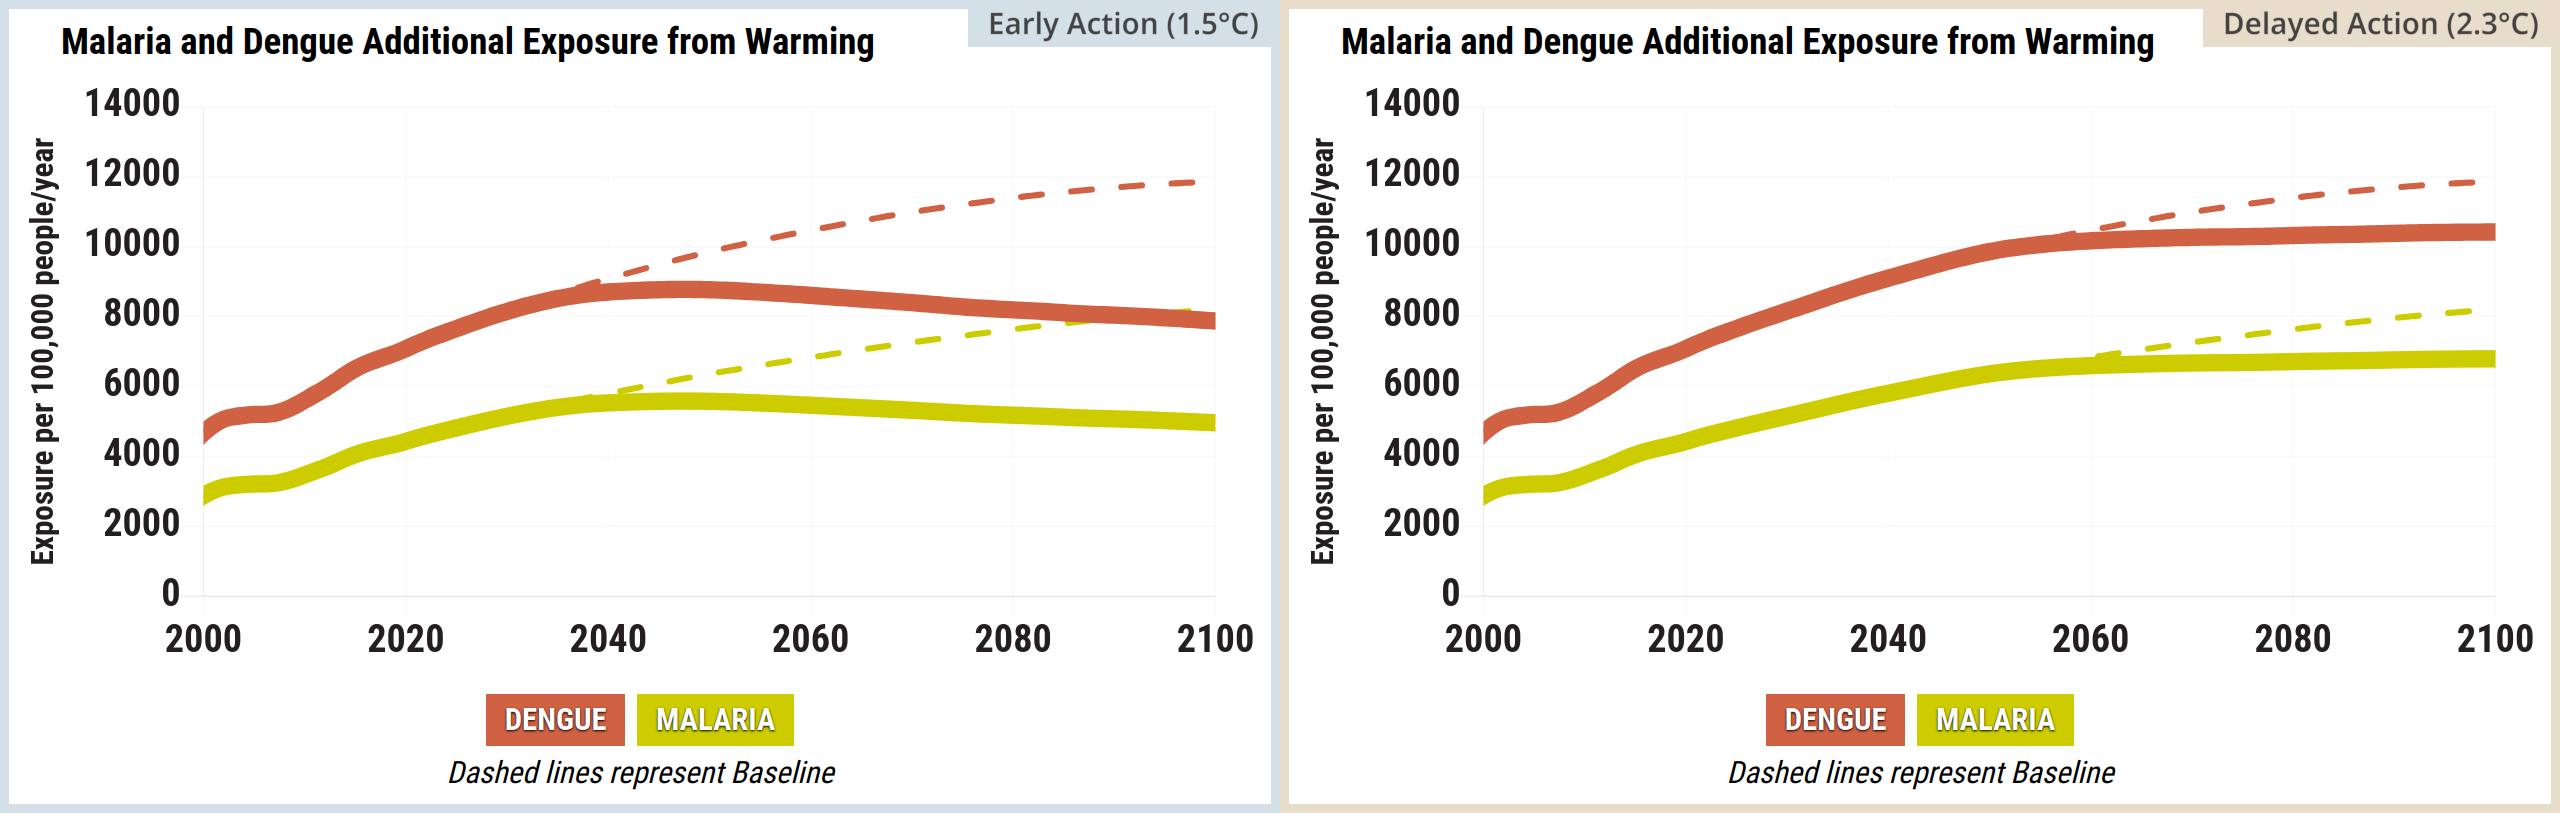
Source: Climate Interactive & MIT Sloan (2026) En-ROADS Simulator (Version 26.8.0)
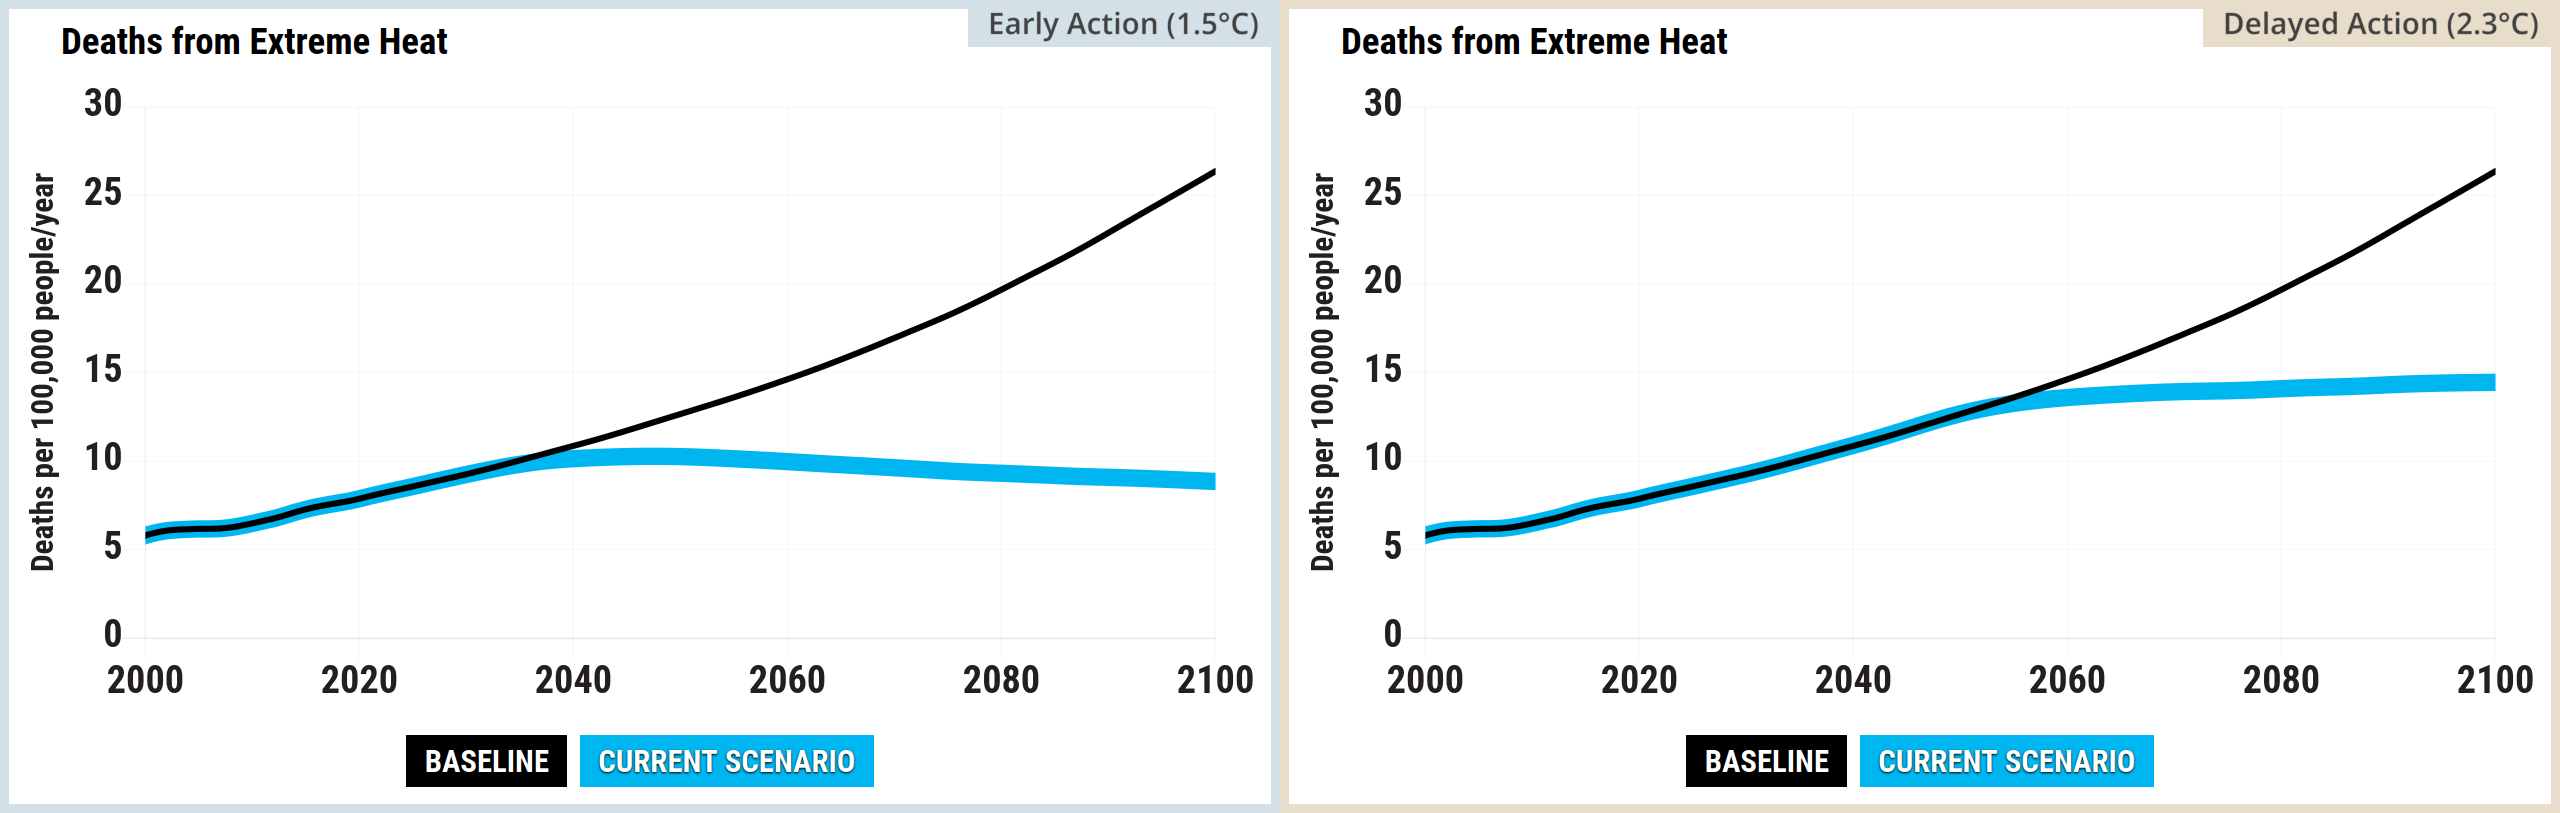
Source: Climate Interactive & MIT Sloan (2026) En-ROADS Simulator (Version 26.8.0)
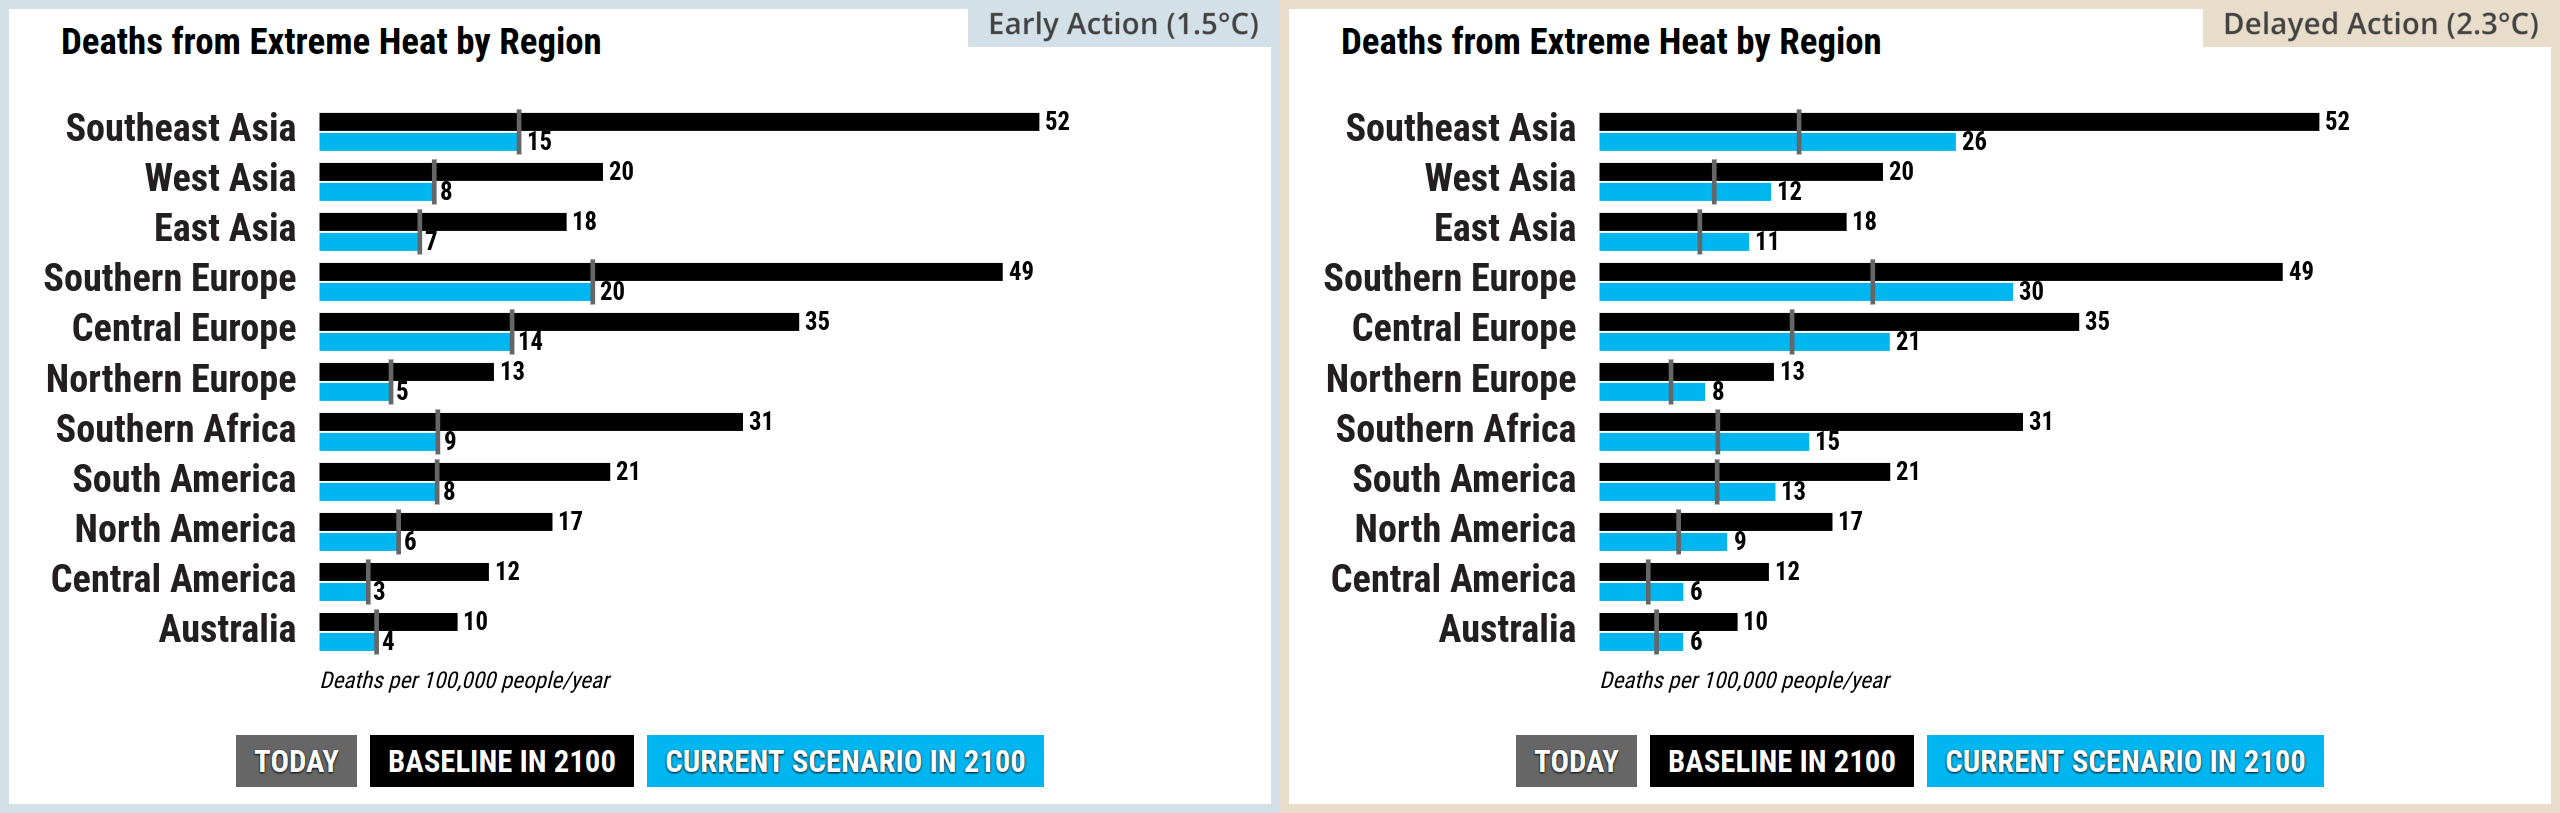
Source: Climate Interactive & MIT Sloan (2026) En-ROADS Simulator (Version 26.8.0)
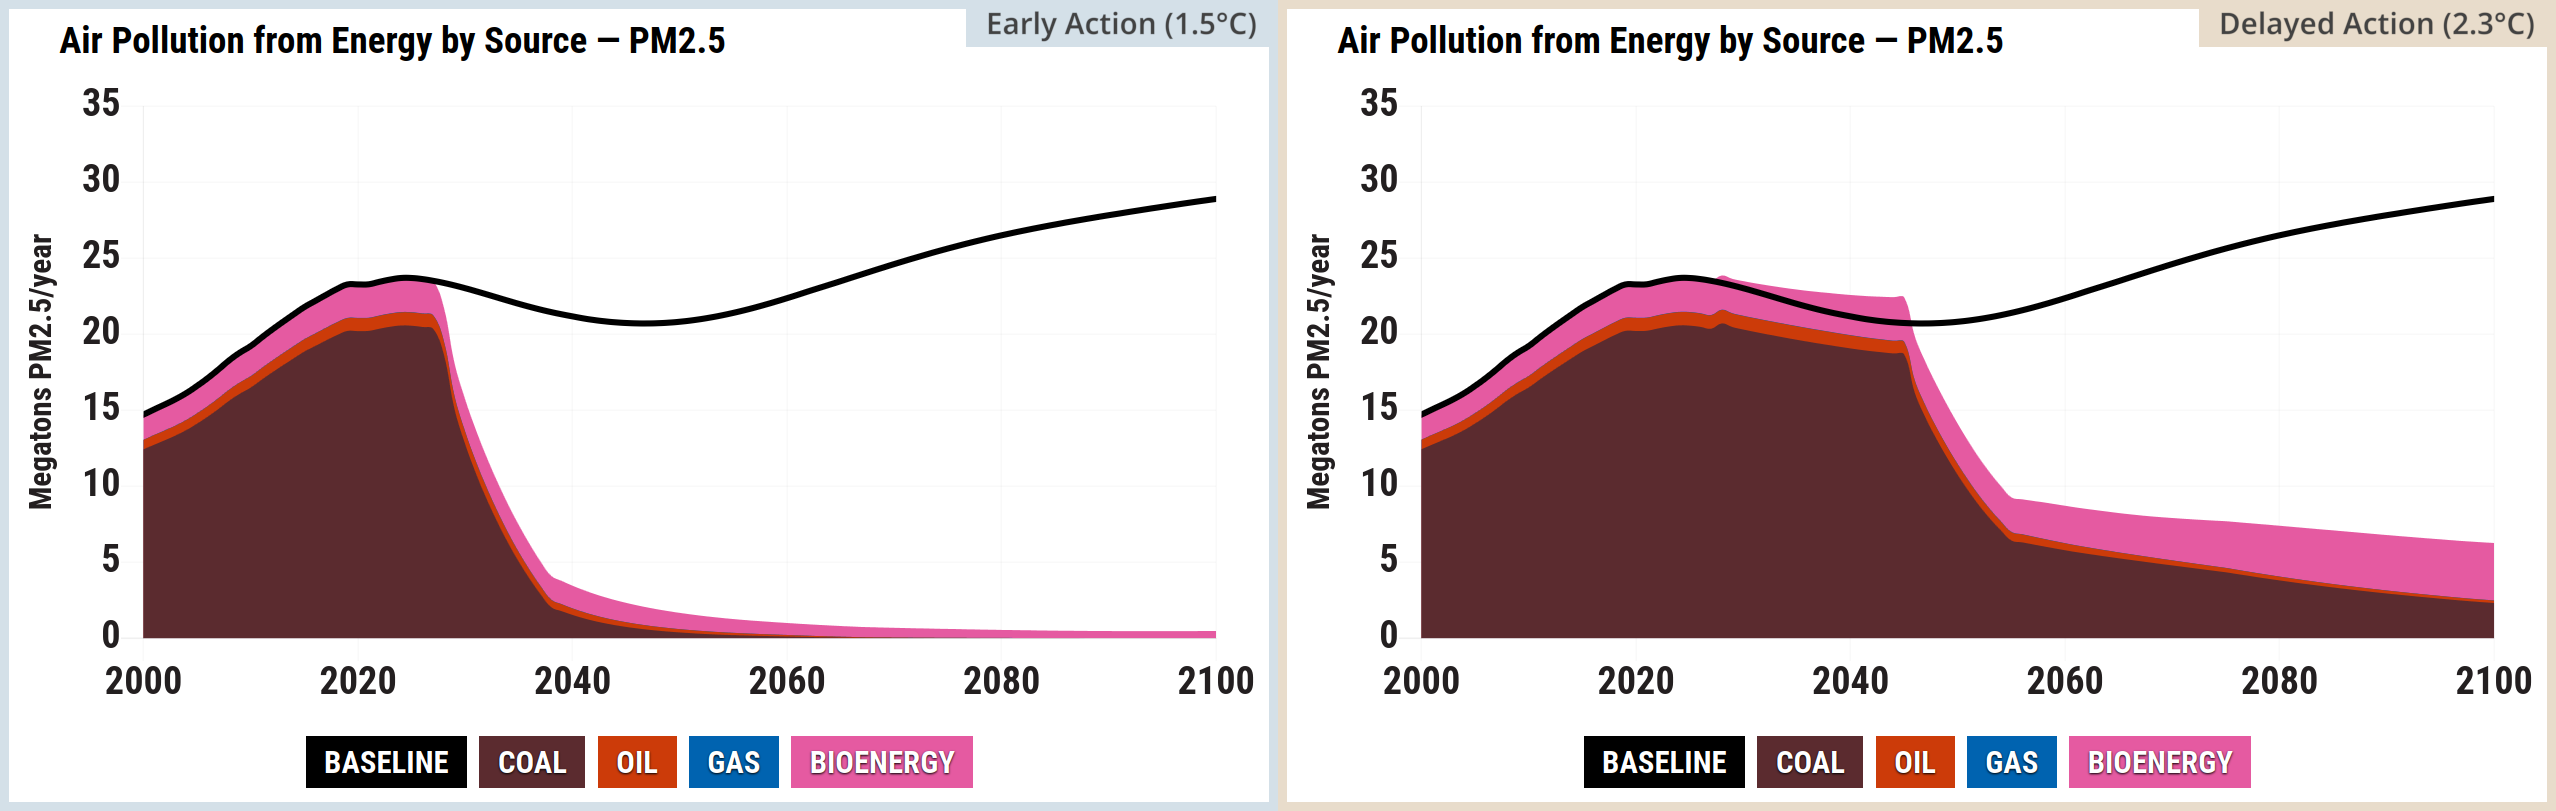
Source: Climate Interactive & MIT Sloan (2026) En-ROADS Simulator (Version 26.8.0)
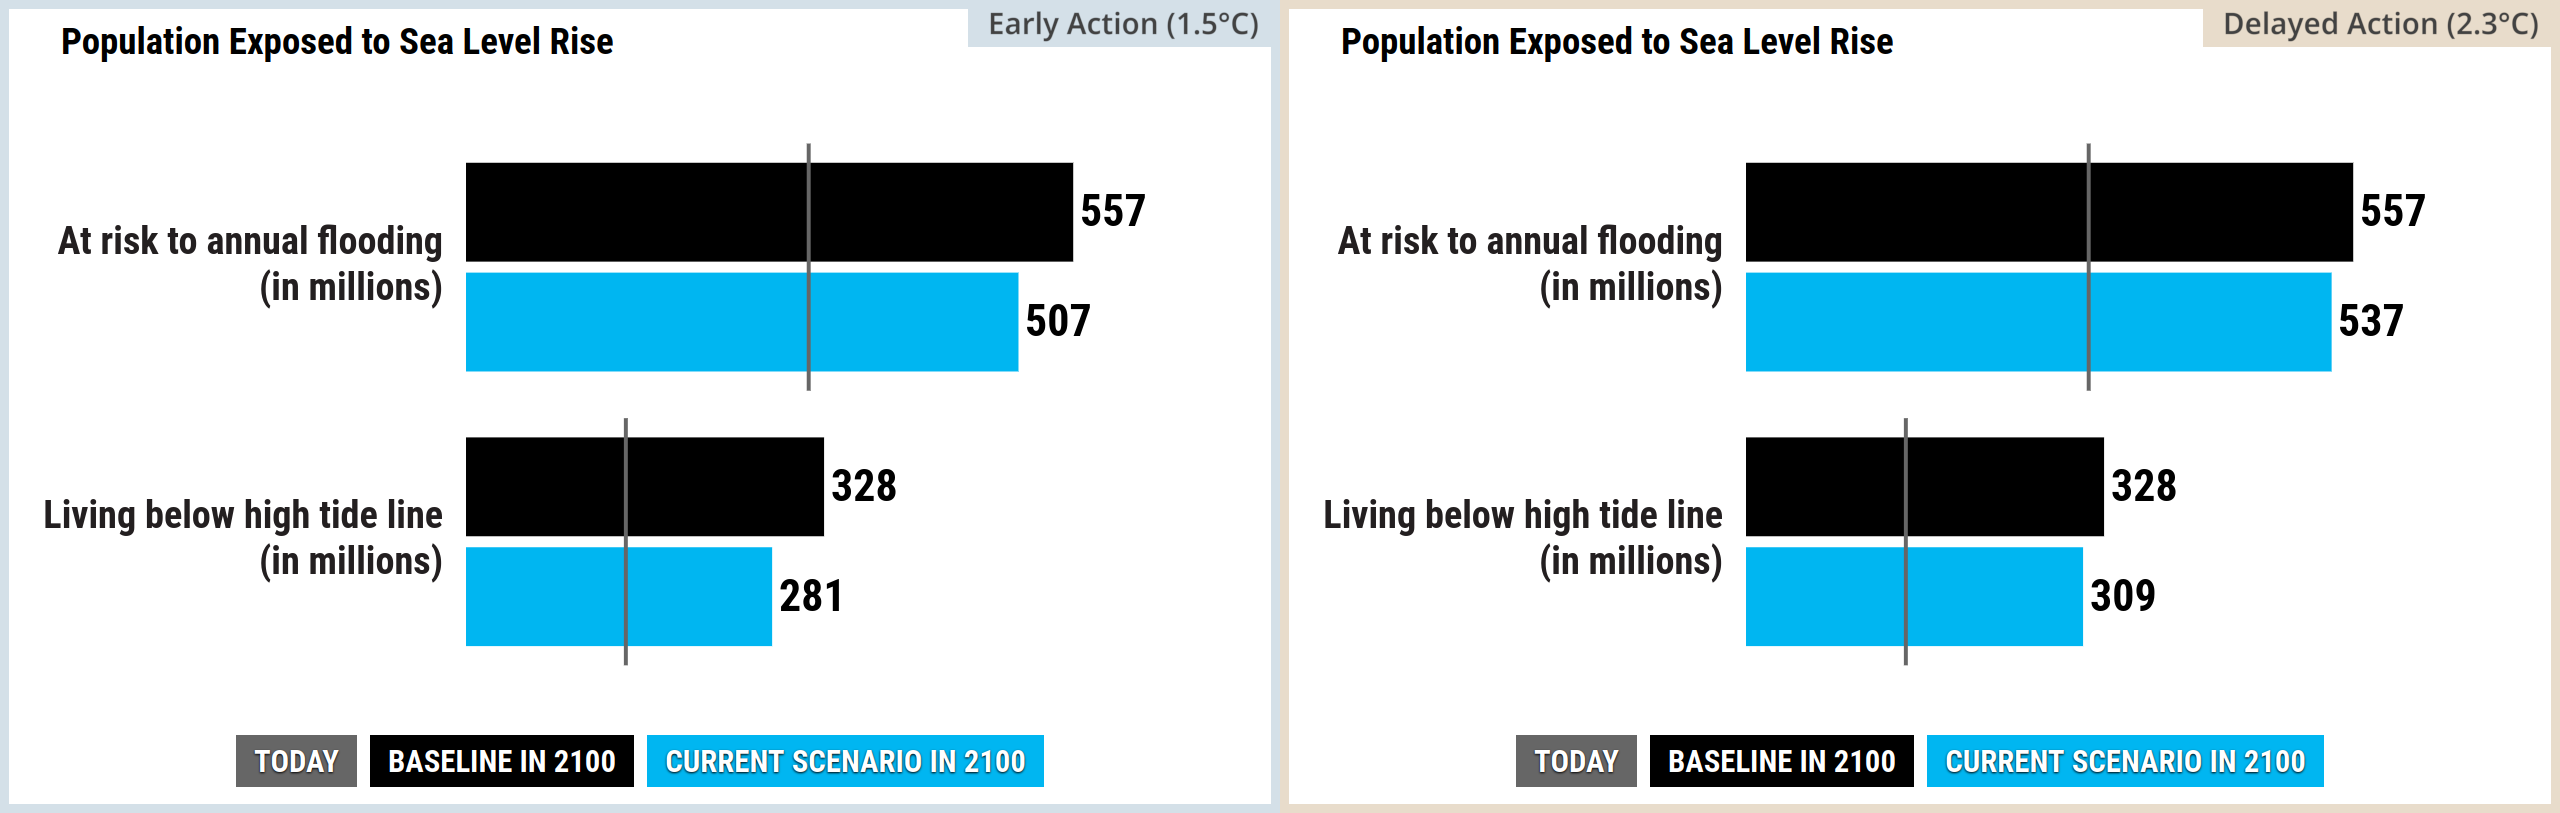
Source: Climate Interactive & MIT Sloan (2026) En-ROADS Simulator (Version 26.8.0)
Environmental impacts
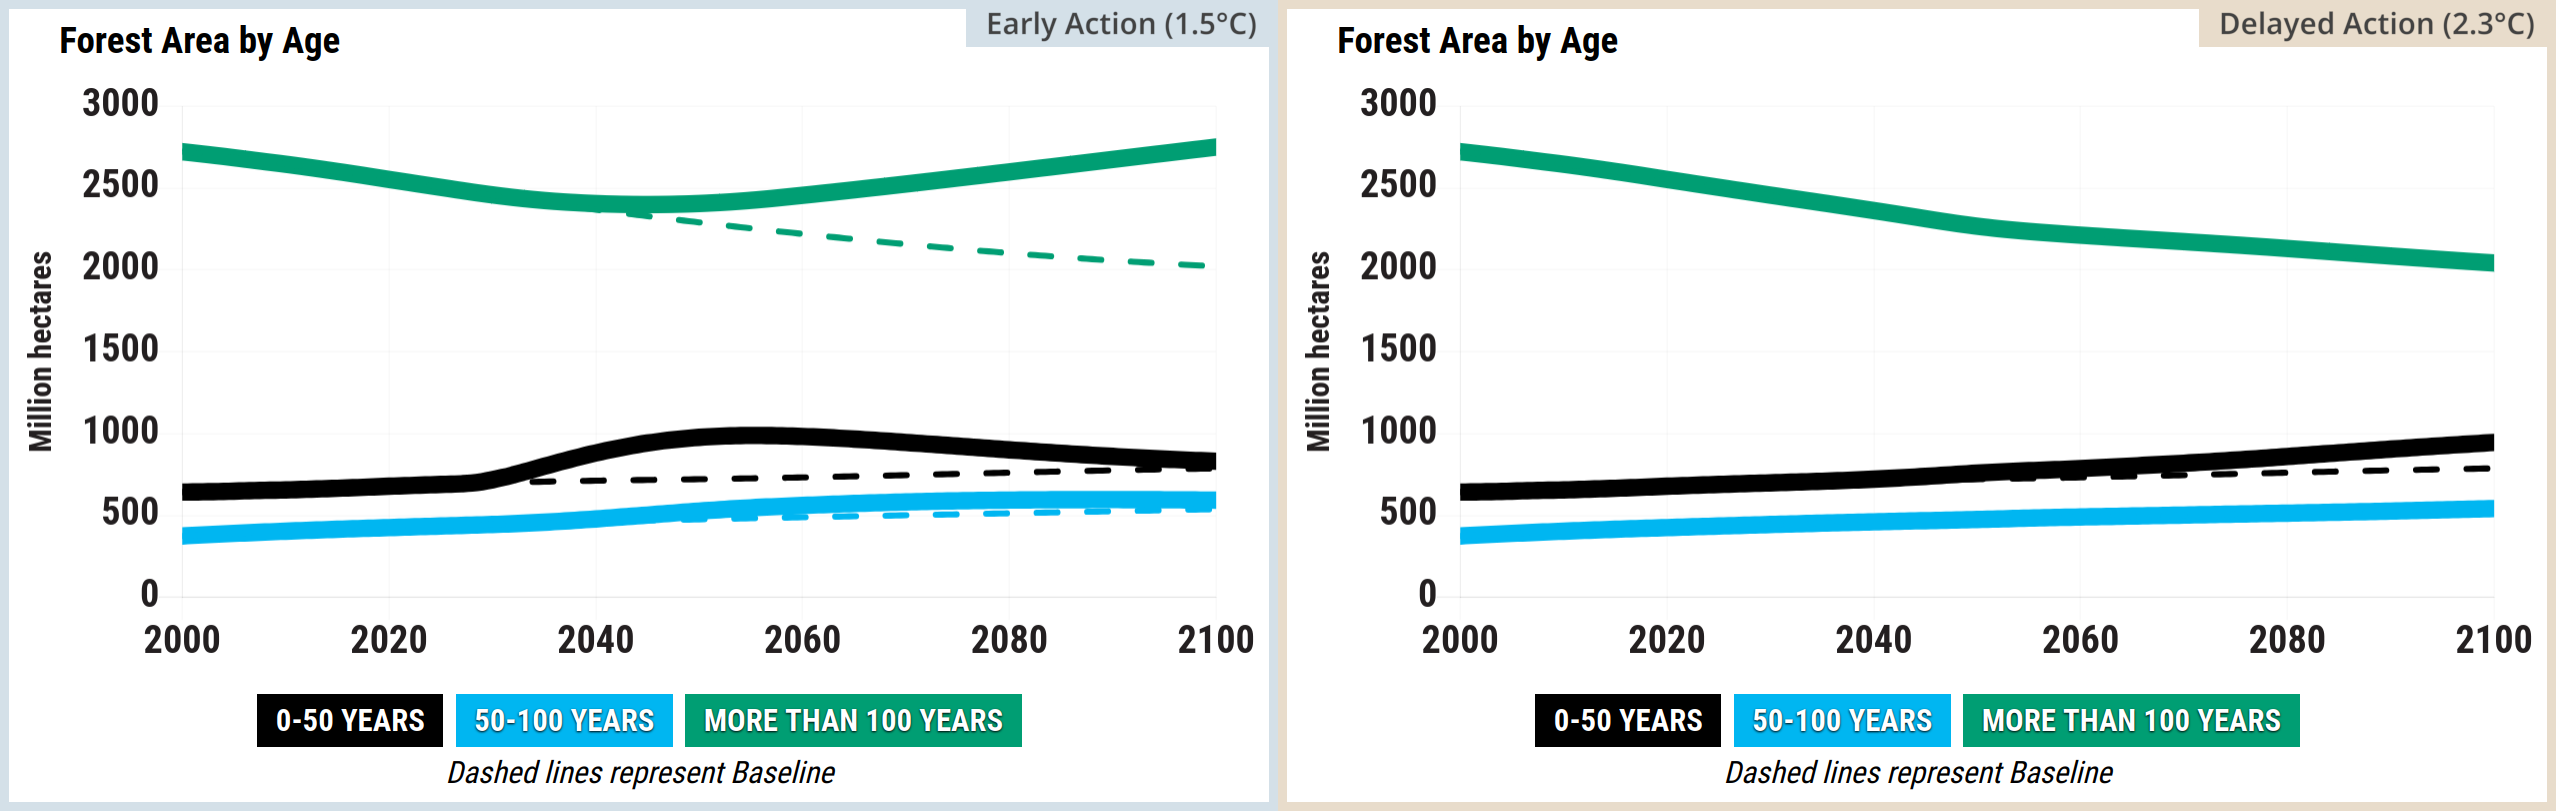
Source: Climate Interactive & MIT Sloan (2026) En-ROADS Simulator (Version 26.8.0)
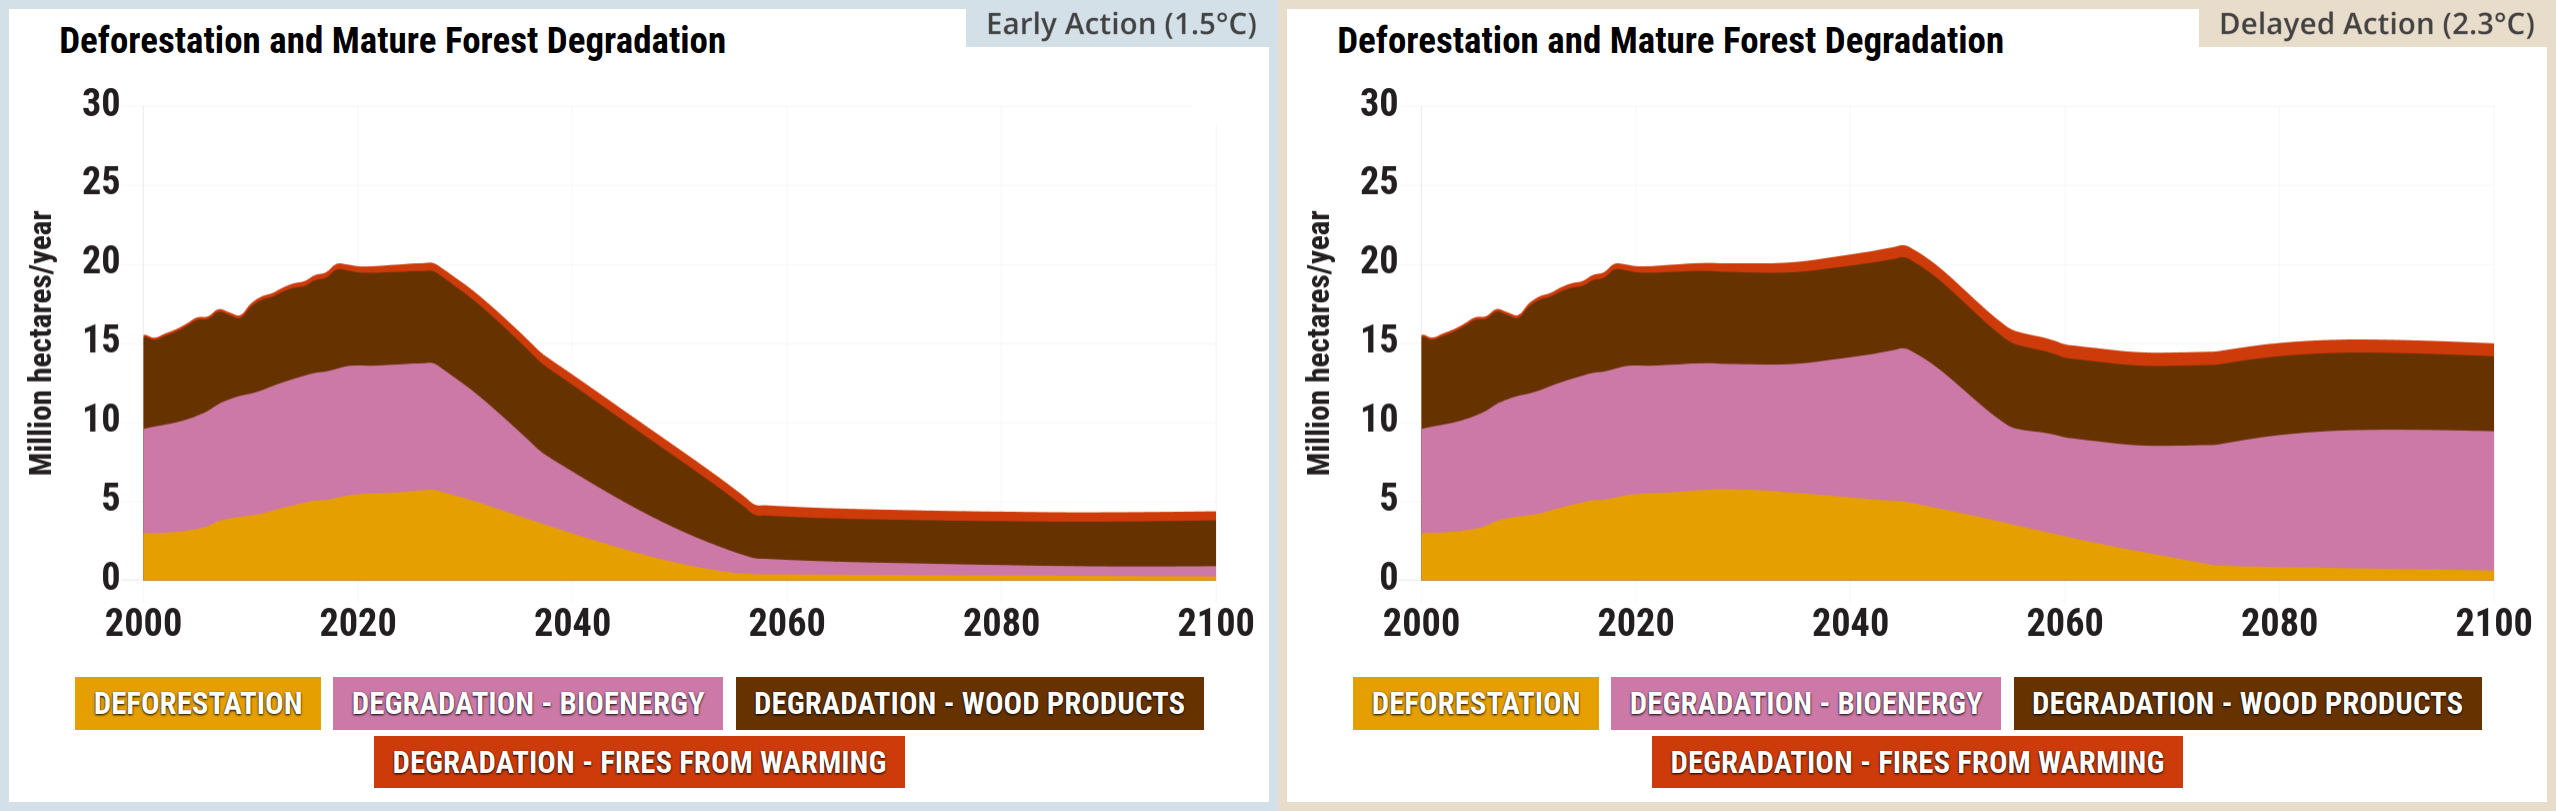
Source: Climate Interactive & MIT Sloan (2026) En-ROADS Simulator (Version 26.8.0)
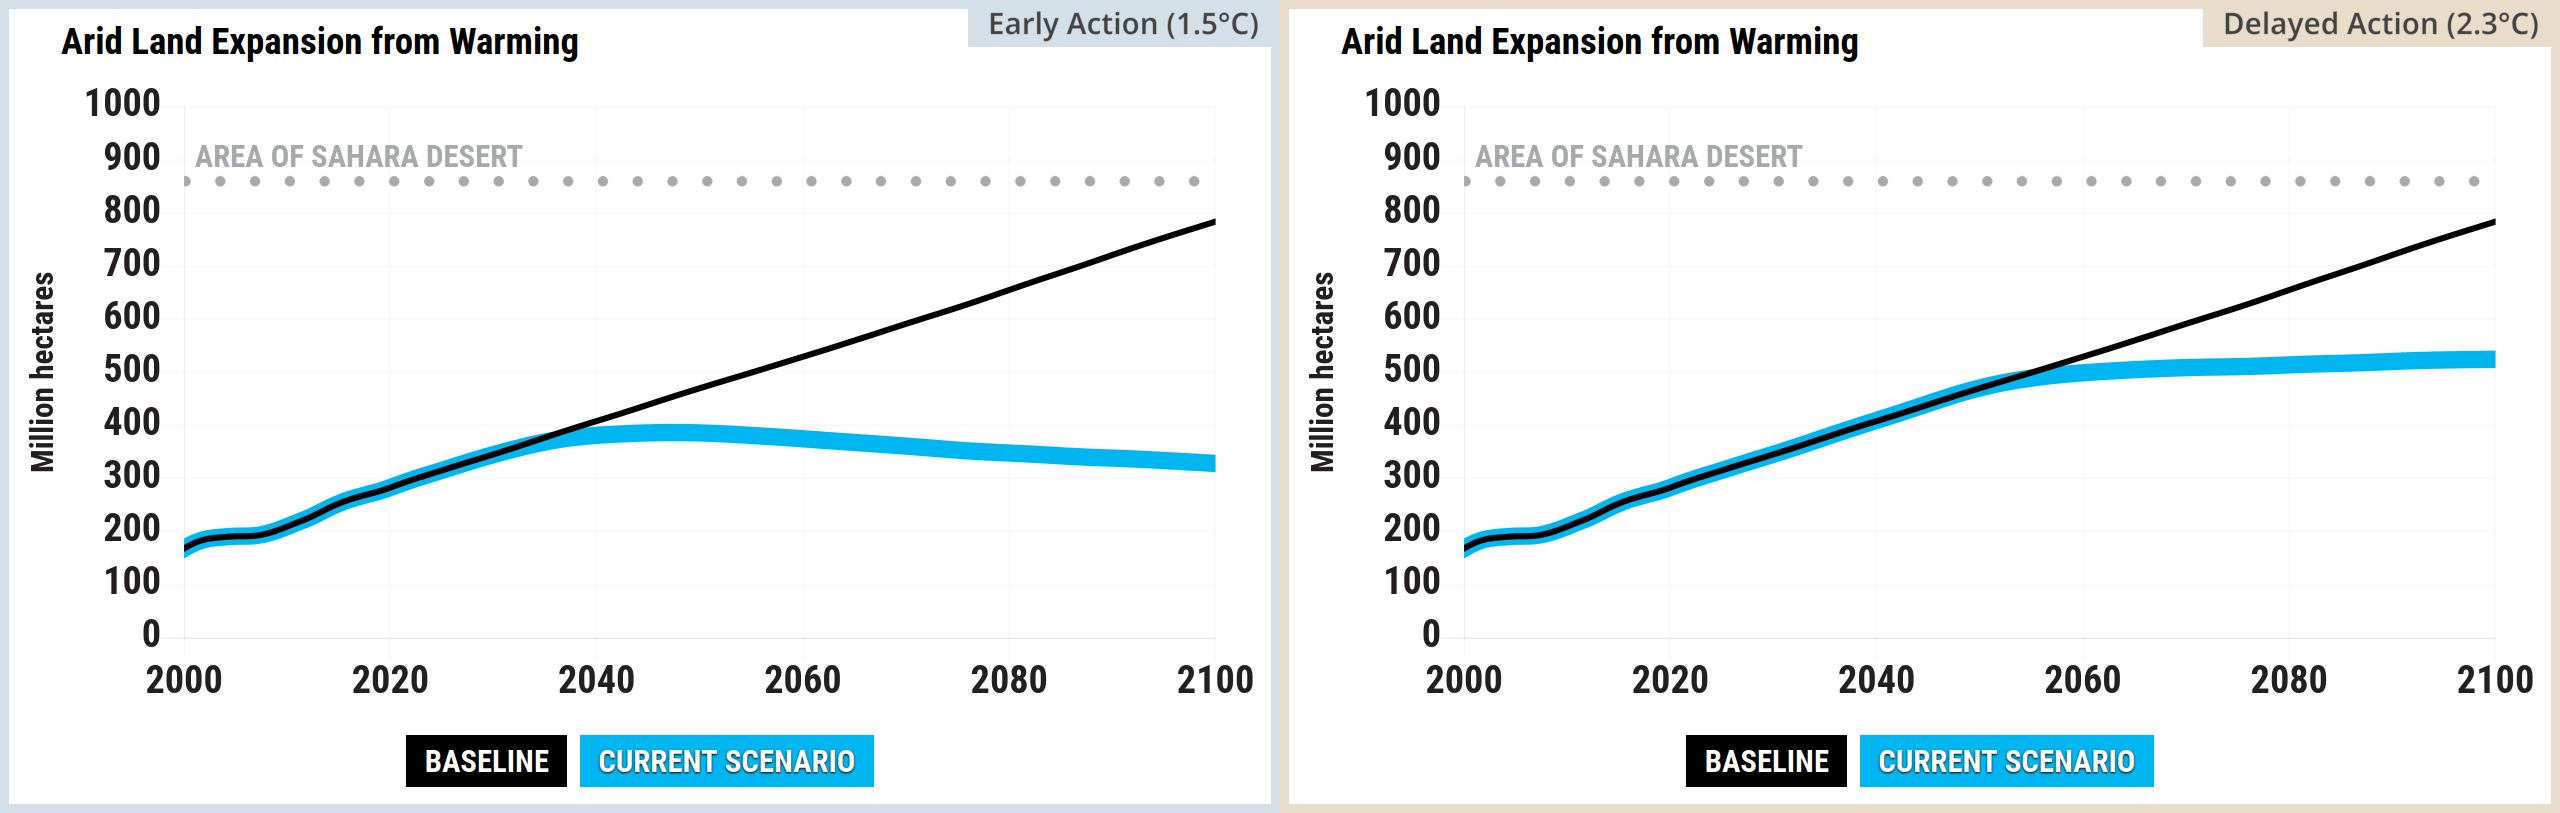
Source: Climate Interactive & MIT Sloan (2026) En-ROADS Simulator (Version 26.8.0)
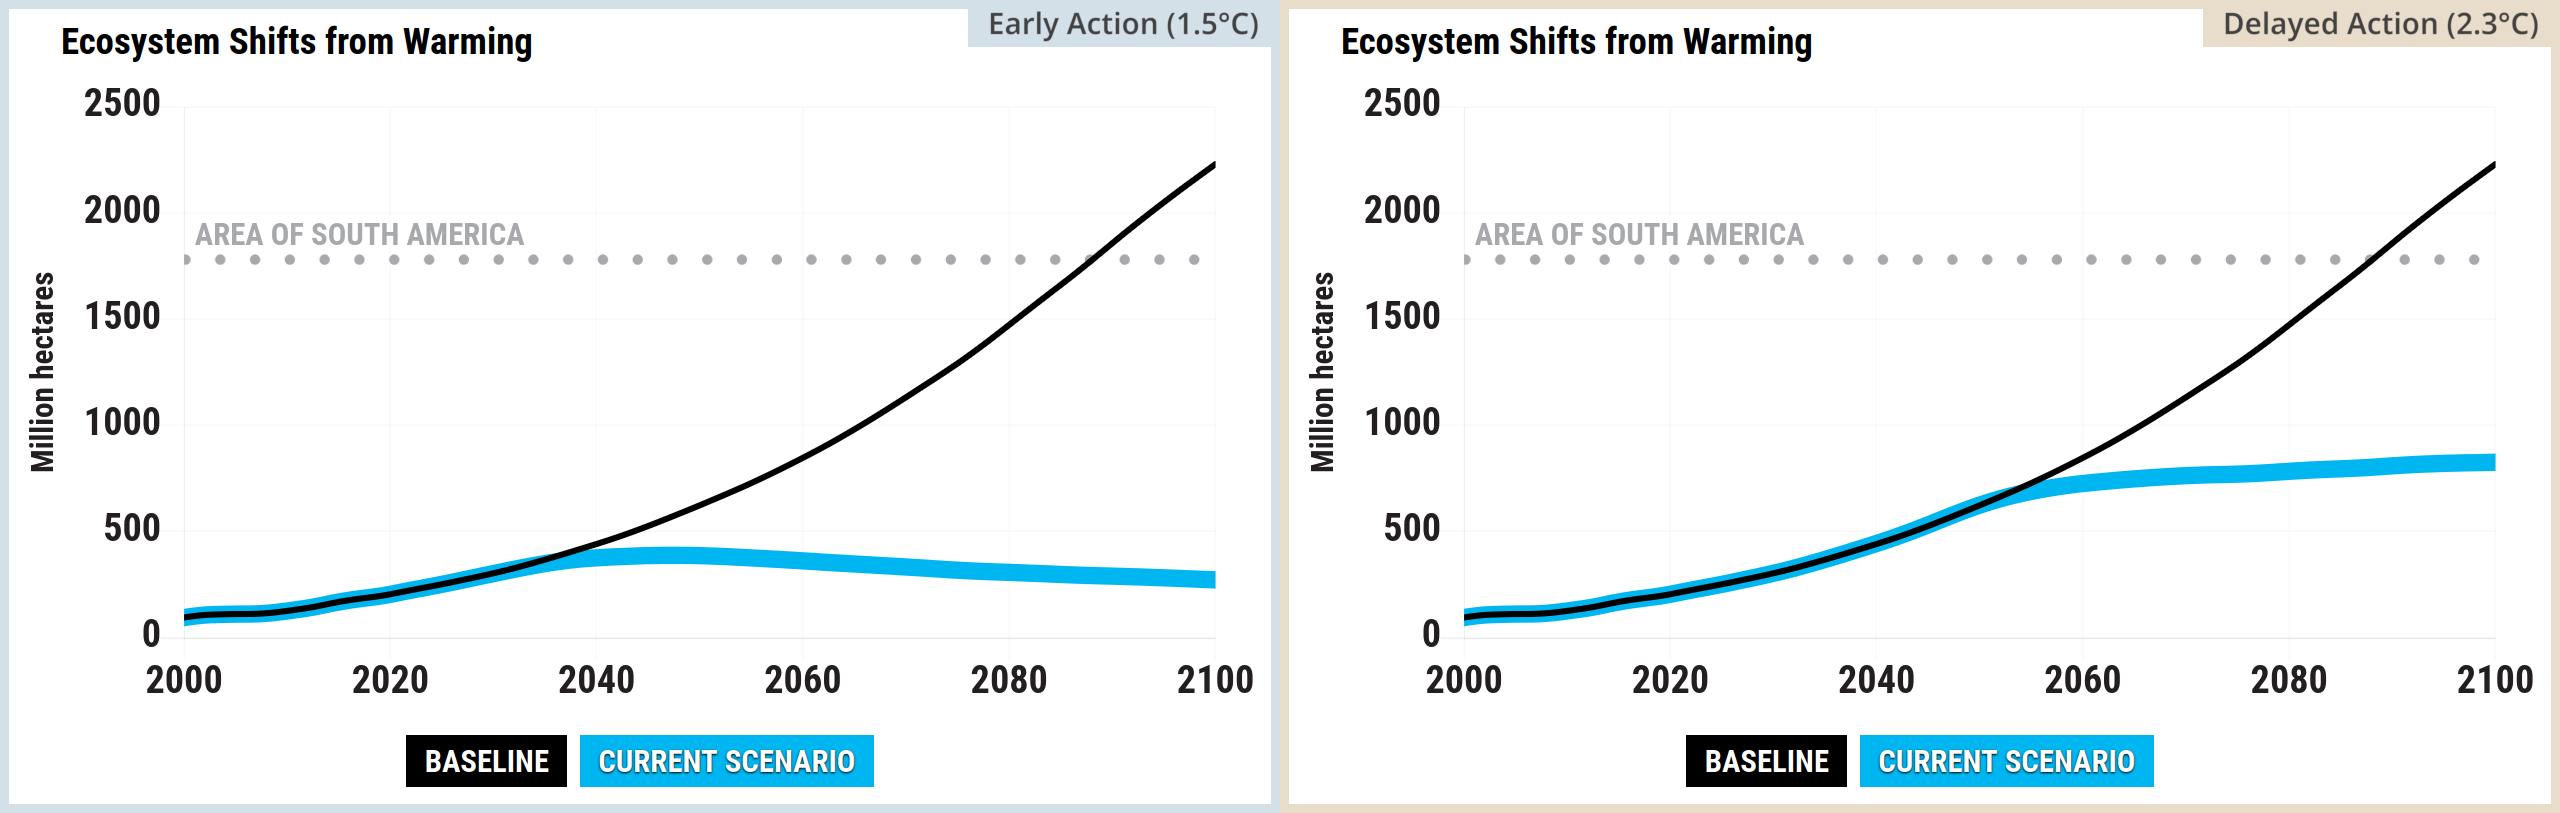
Source: Climate Interactive & MIT Sloan (2026) En-ROADS Simulator (Version 26.8.0)
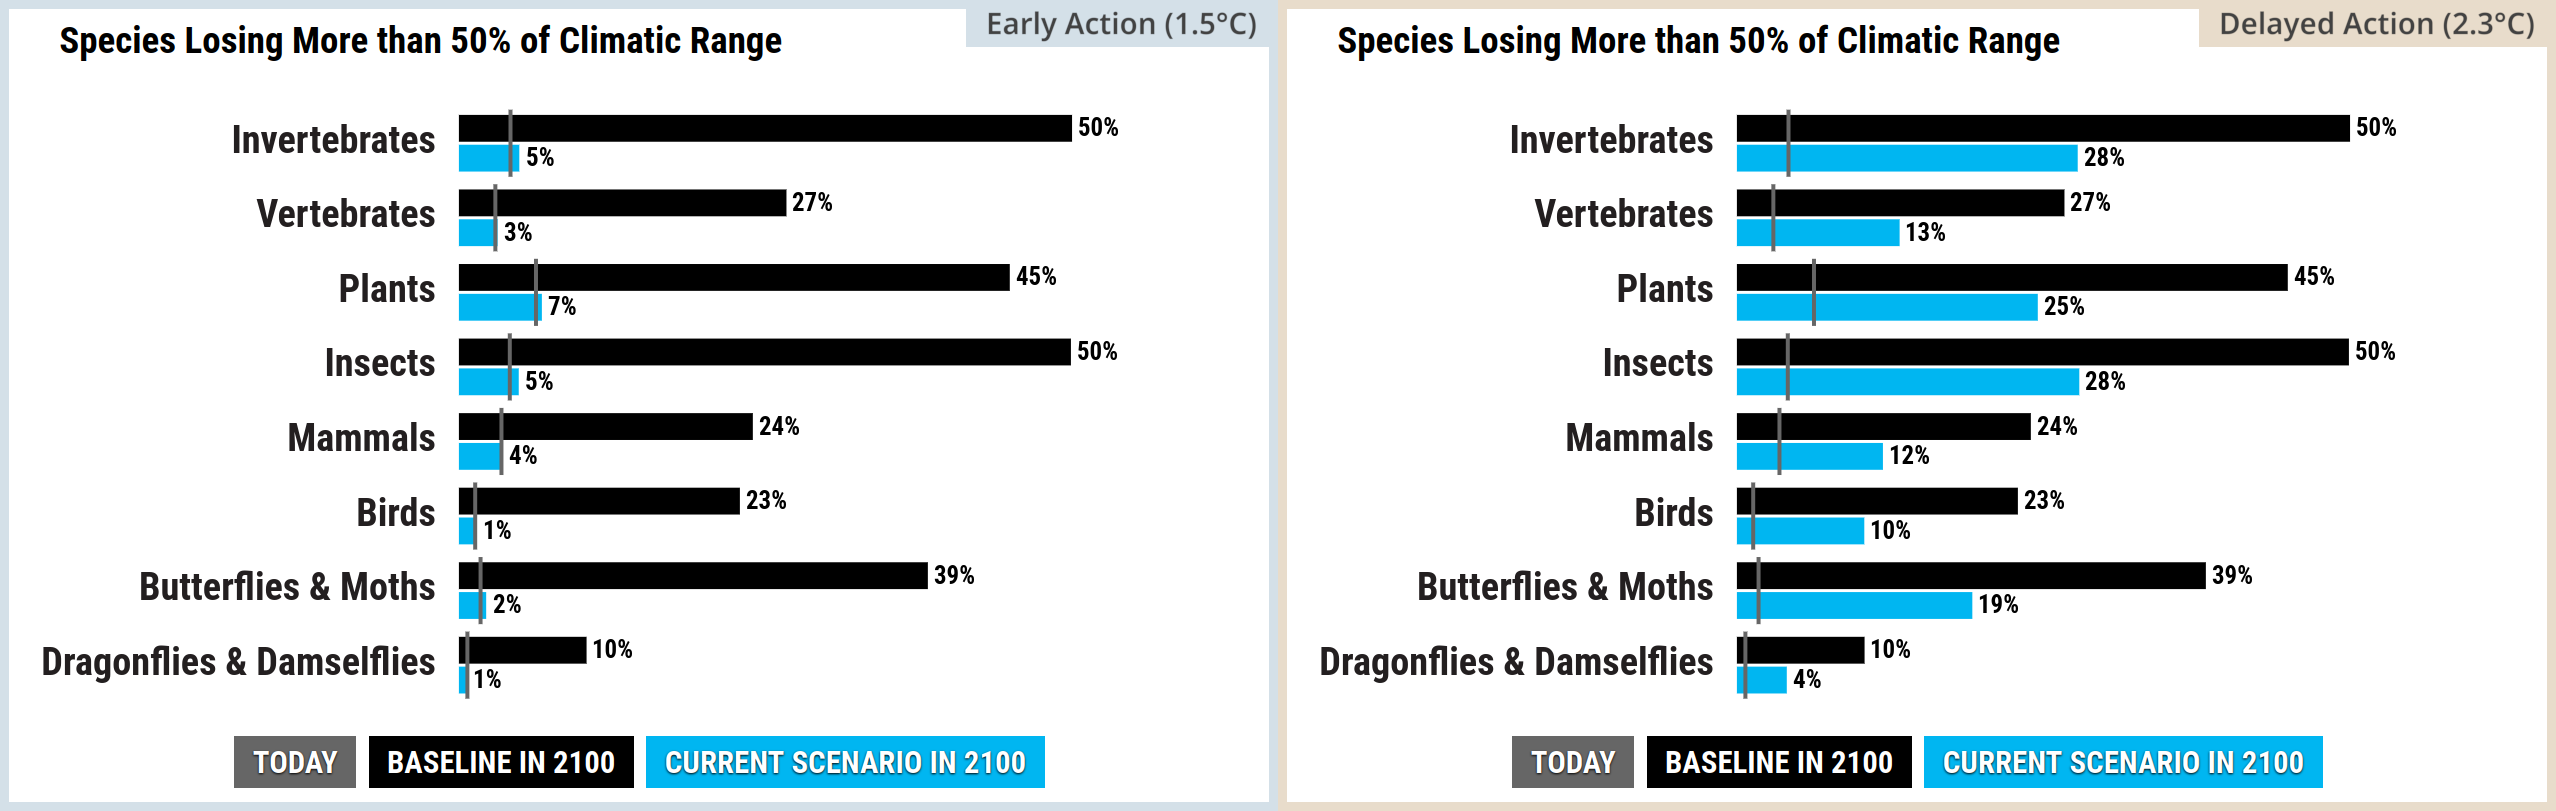
Source: Climate Interactive & MIT Sloan (2026) En-ROADS Simulator (Version 26.8.0)
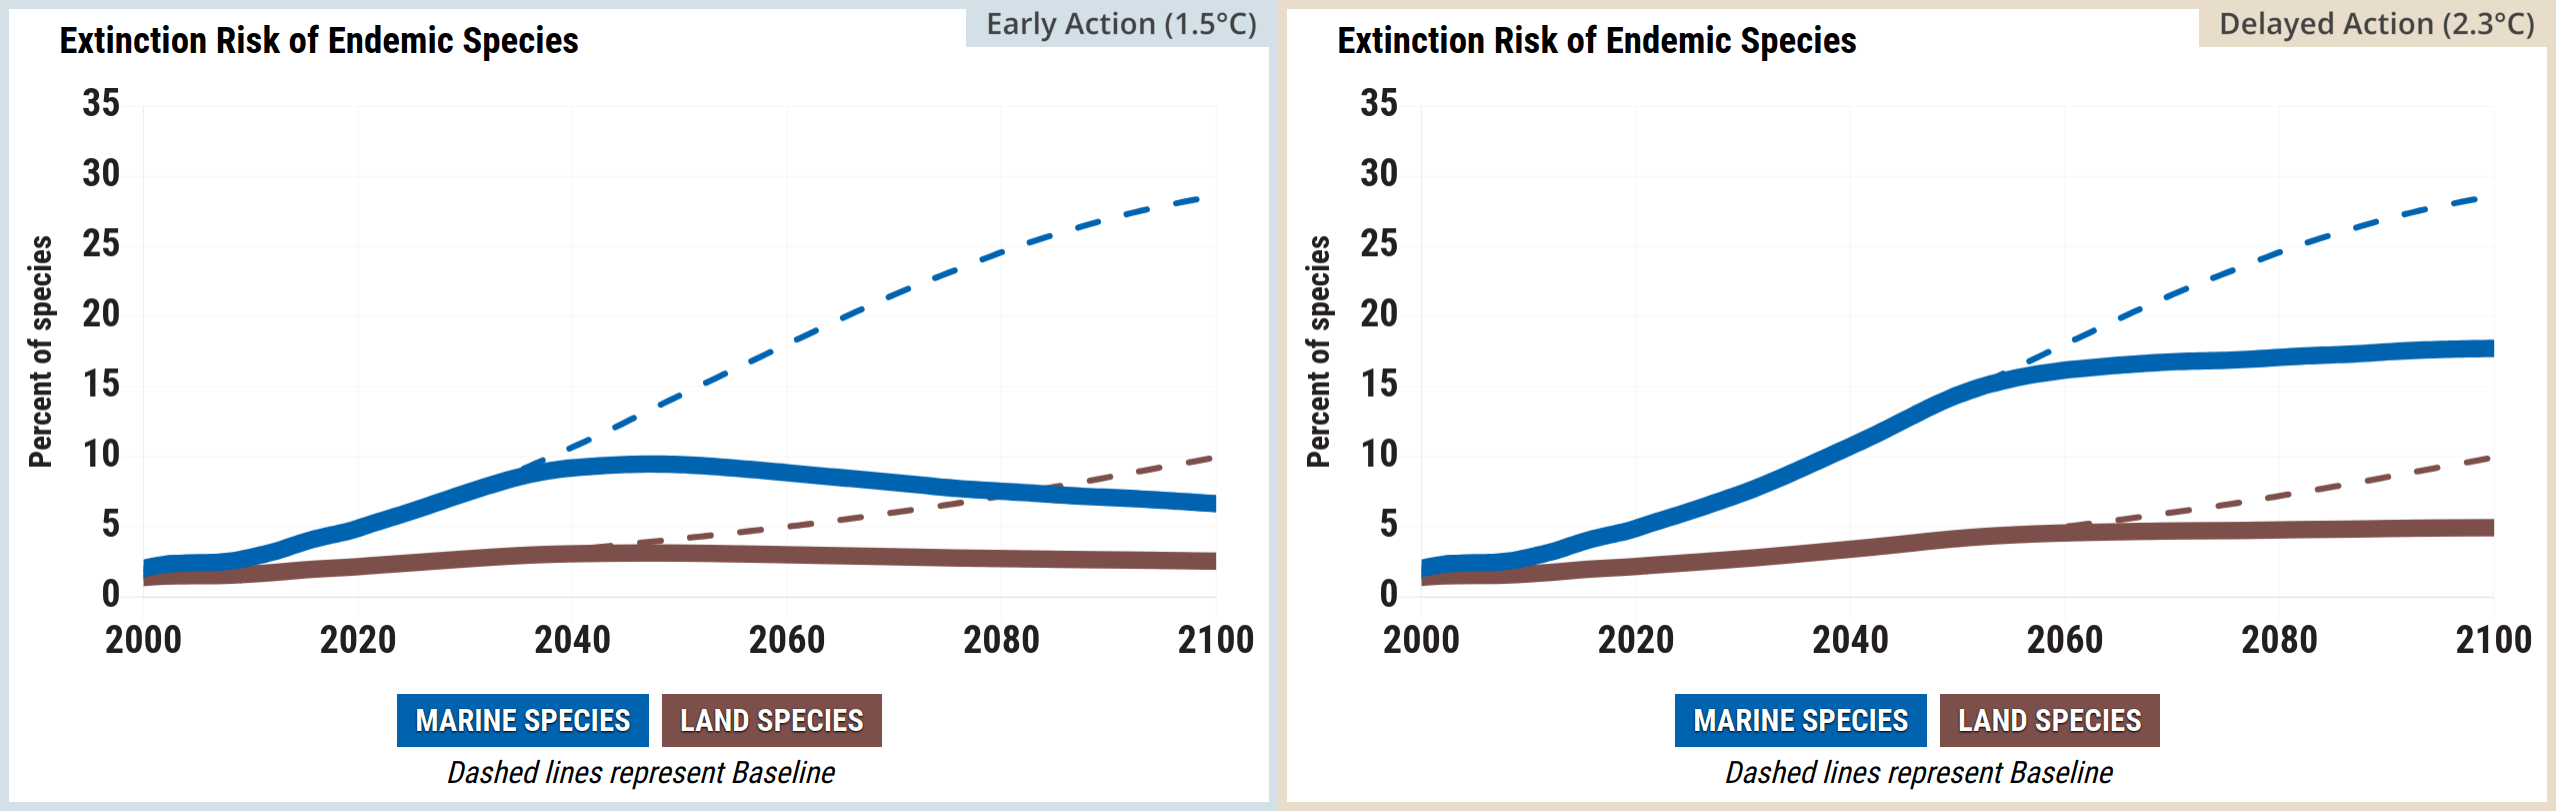
Source: Climate Interactive & MIT Sloan (2026) En-ROADS Simulator (Version 26.8.0)
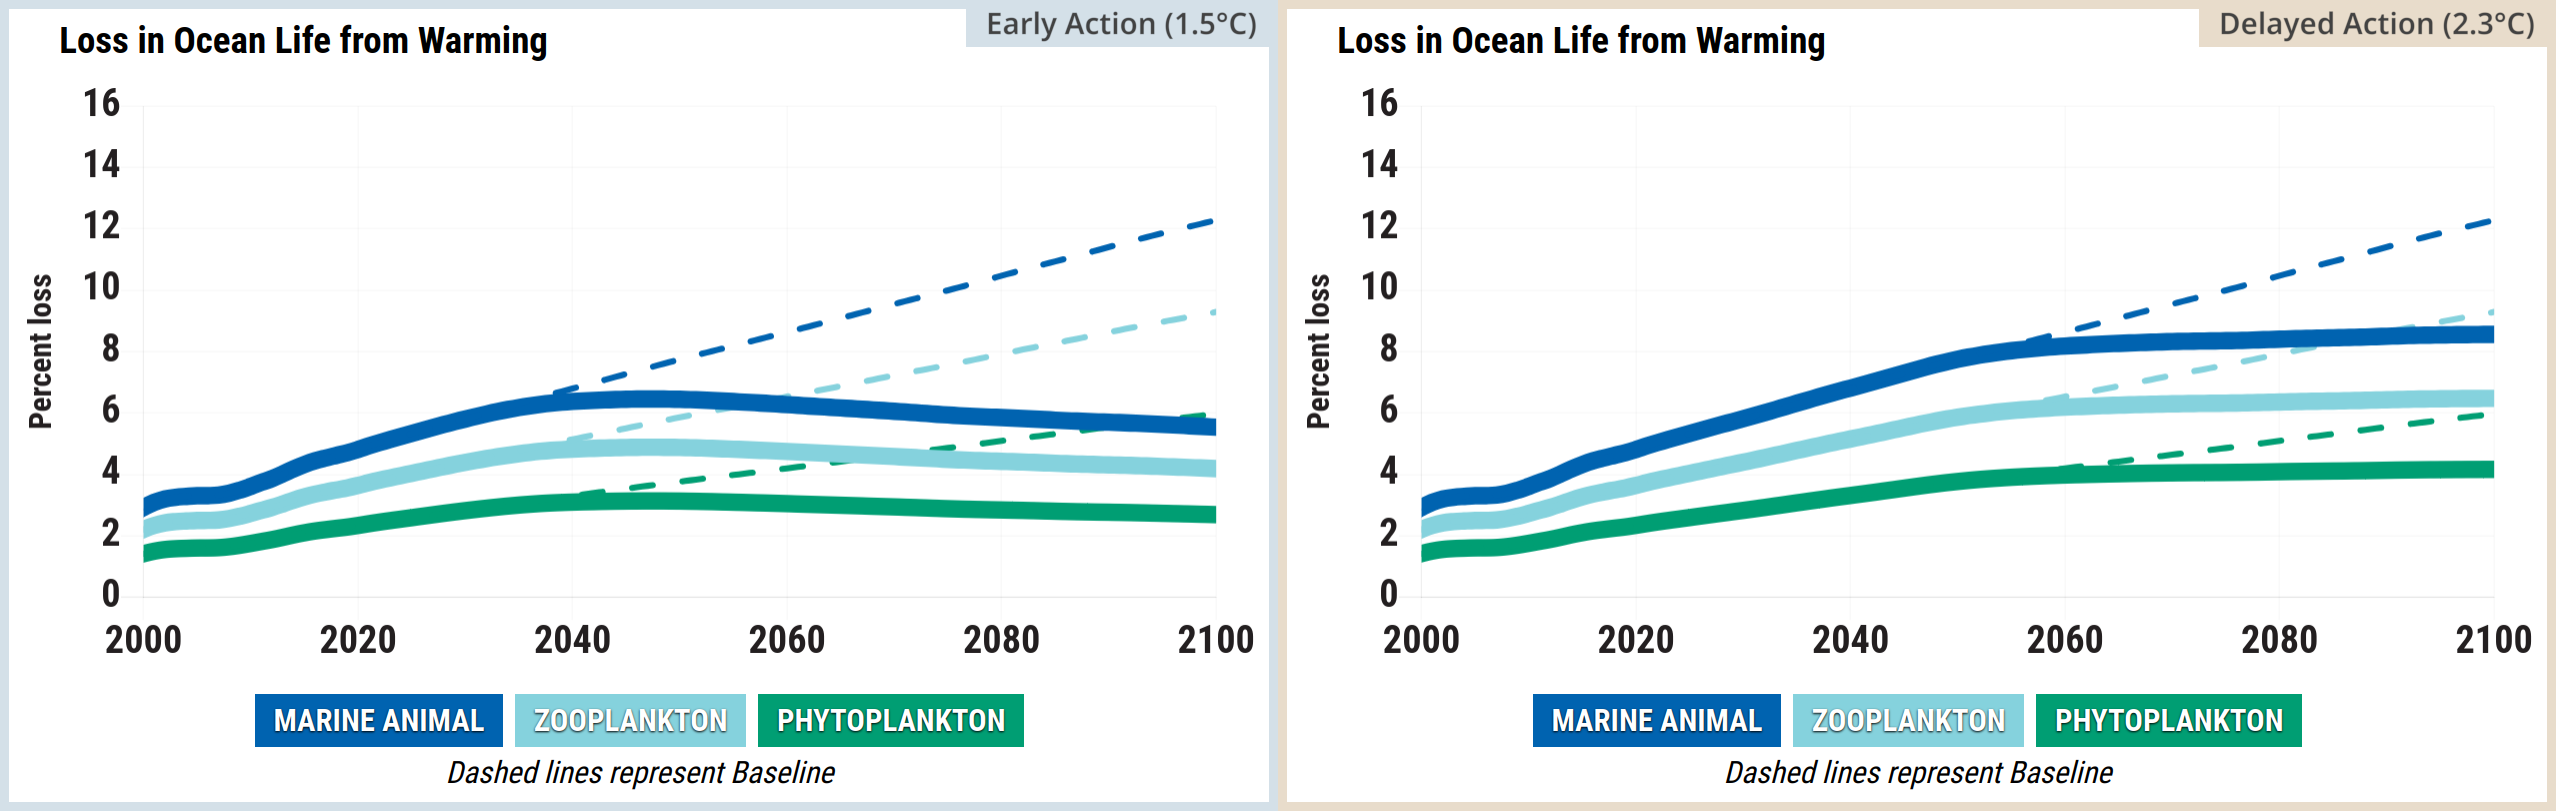
Source: Climate Interactive & MIT Sloan (2026) En-ROADS Simulator (Version 26.8.0)
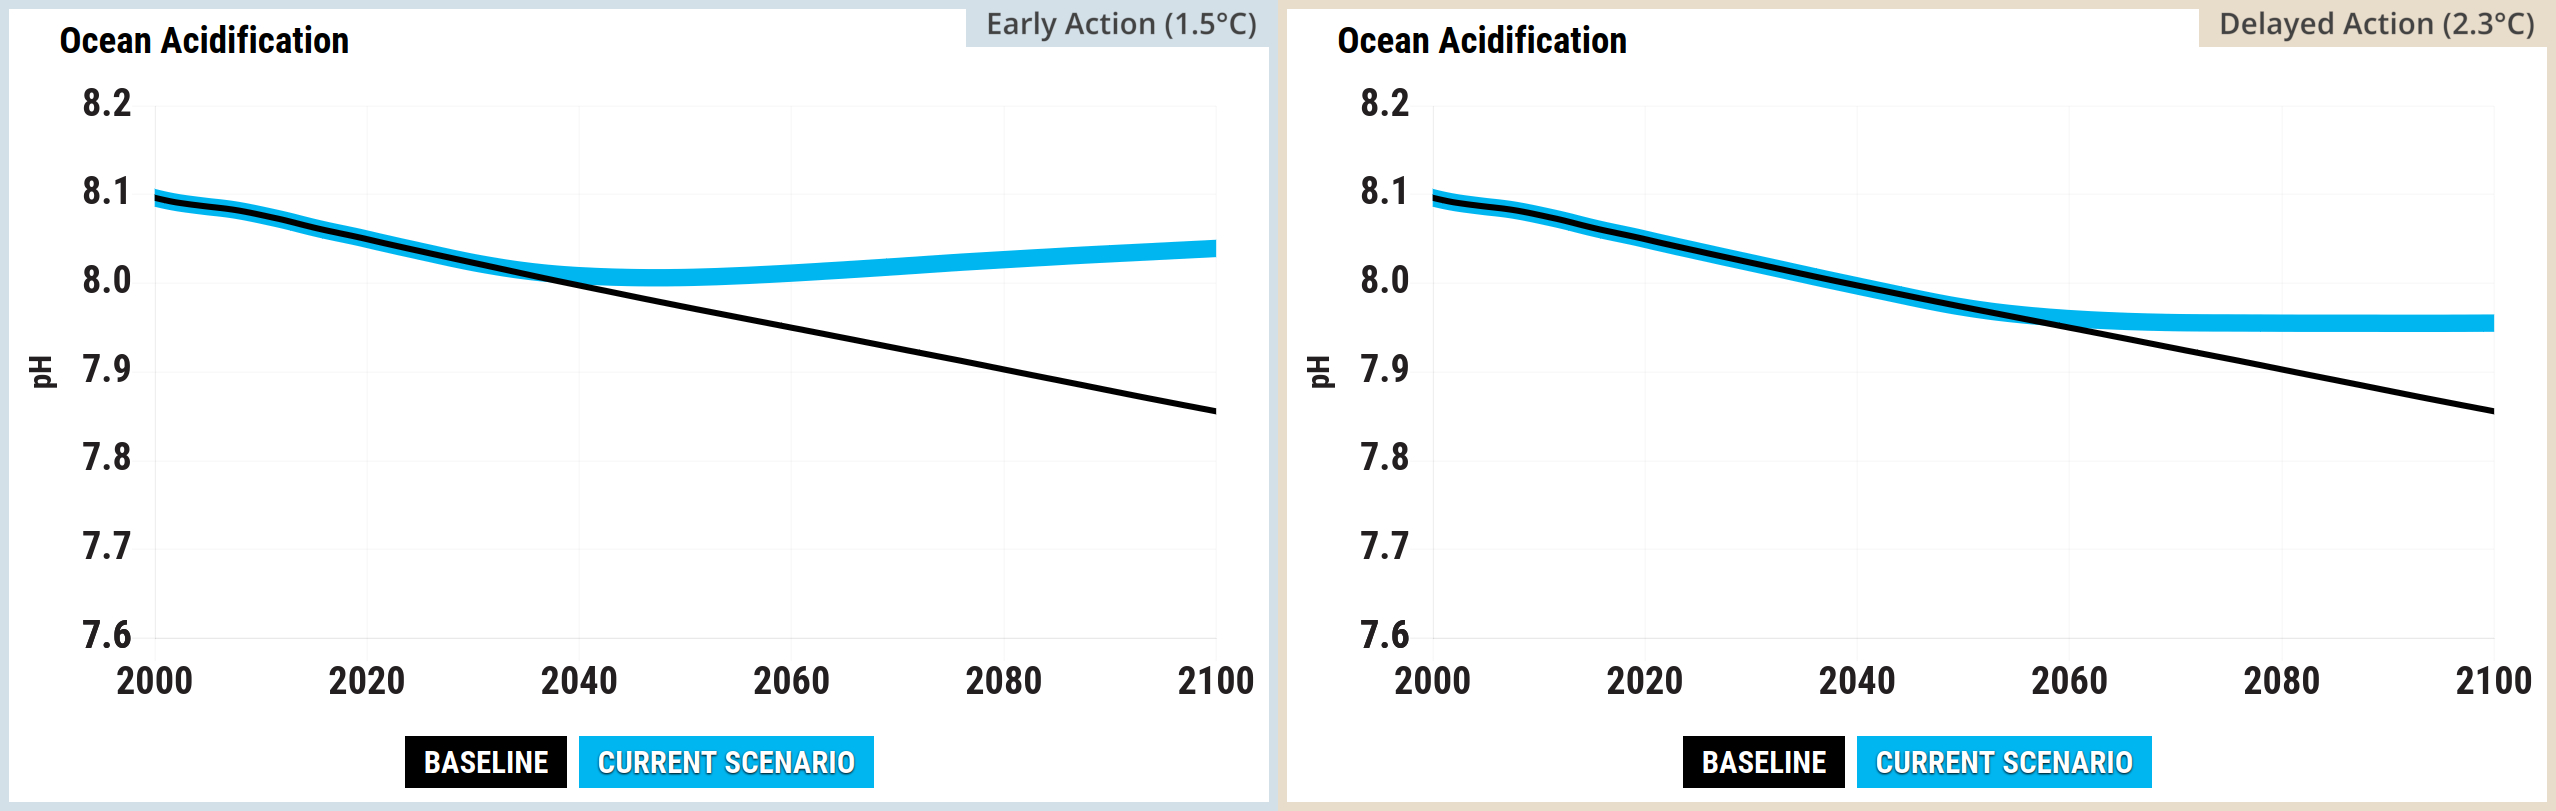
Source: Climate Interactive & MIT Sloan (2026) En-ROADS Simulator (Version 26.8.0)
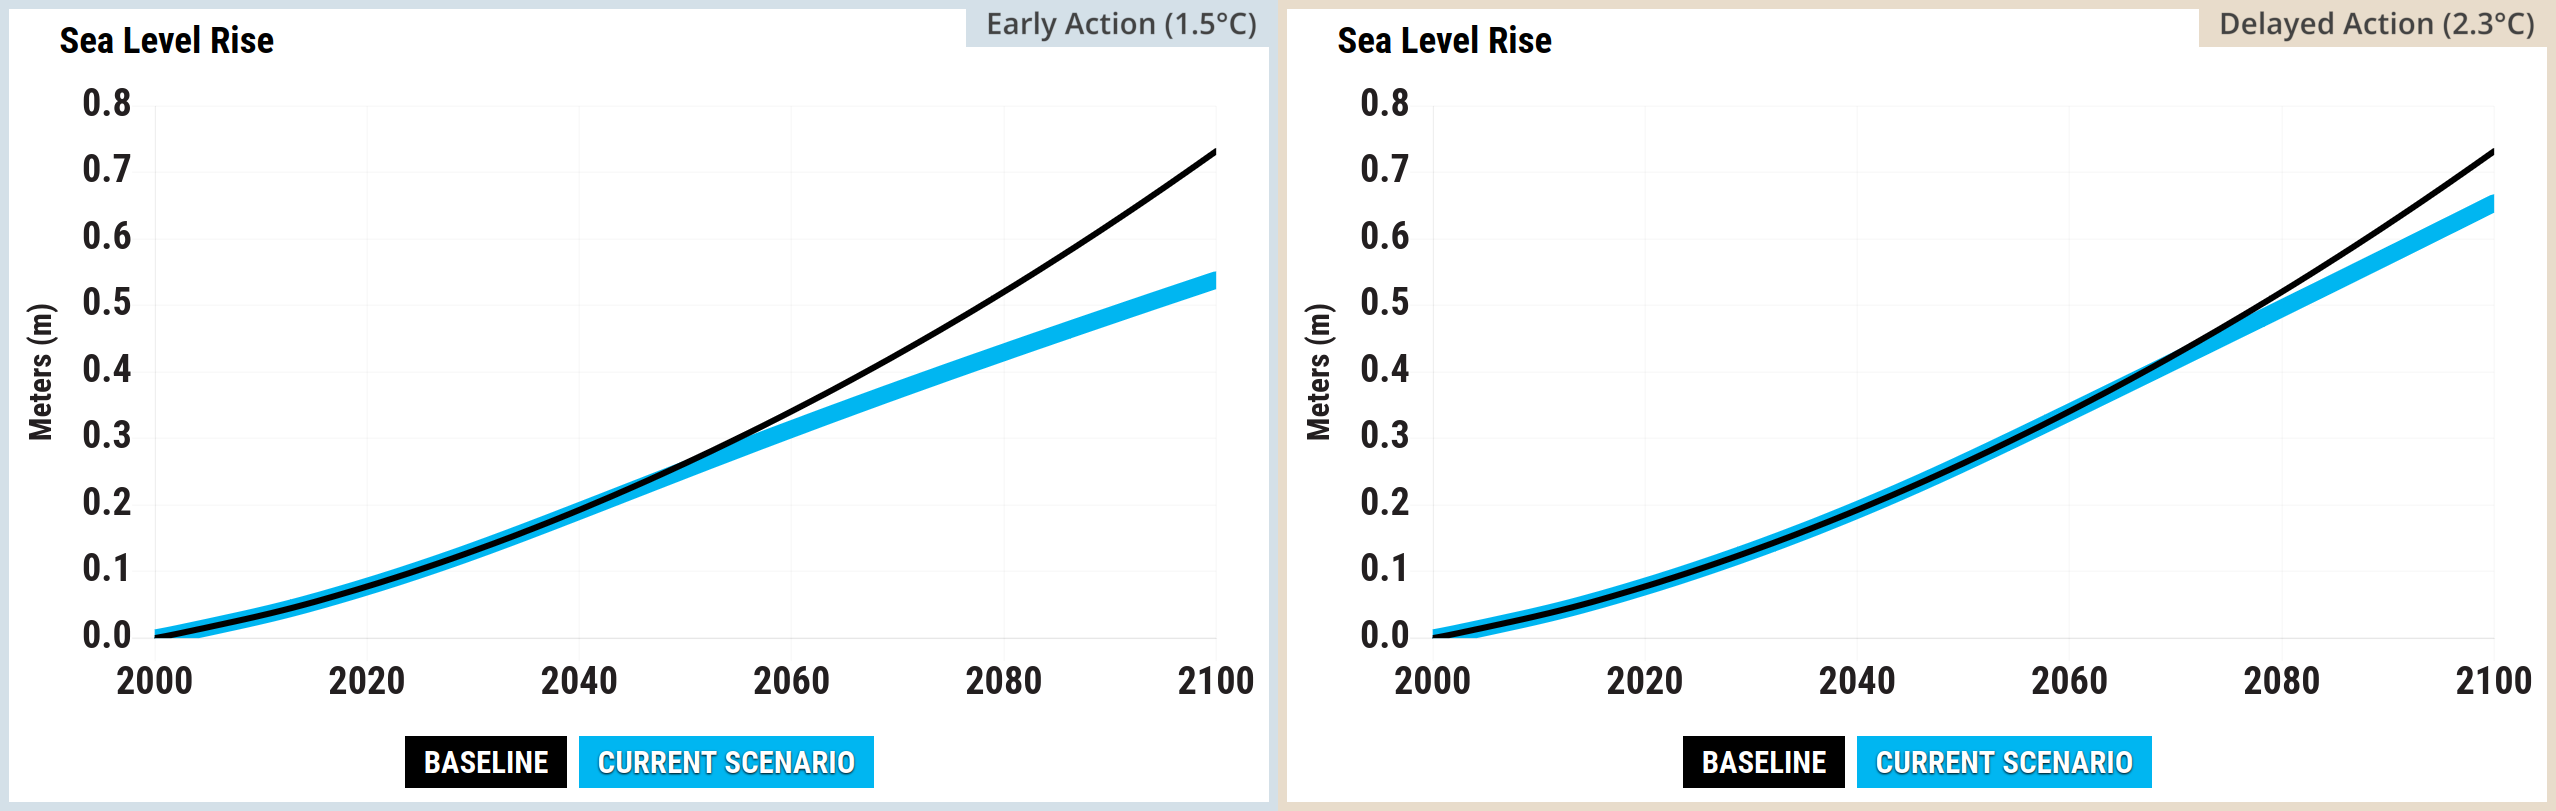
Source: Climate Interactive & MIT Sloan (2026) En-ROADS Simulator (Version 26.8.0)
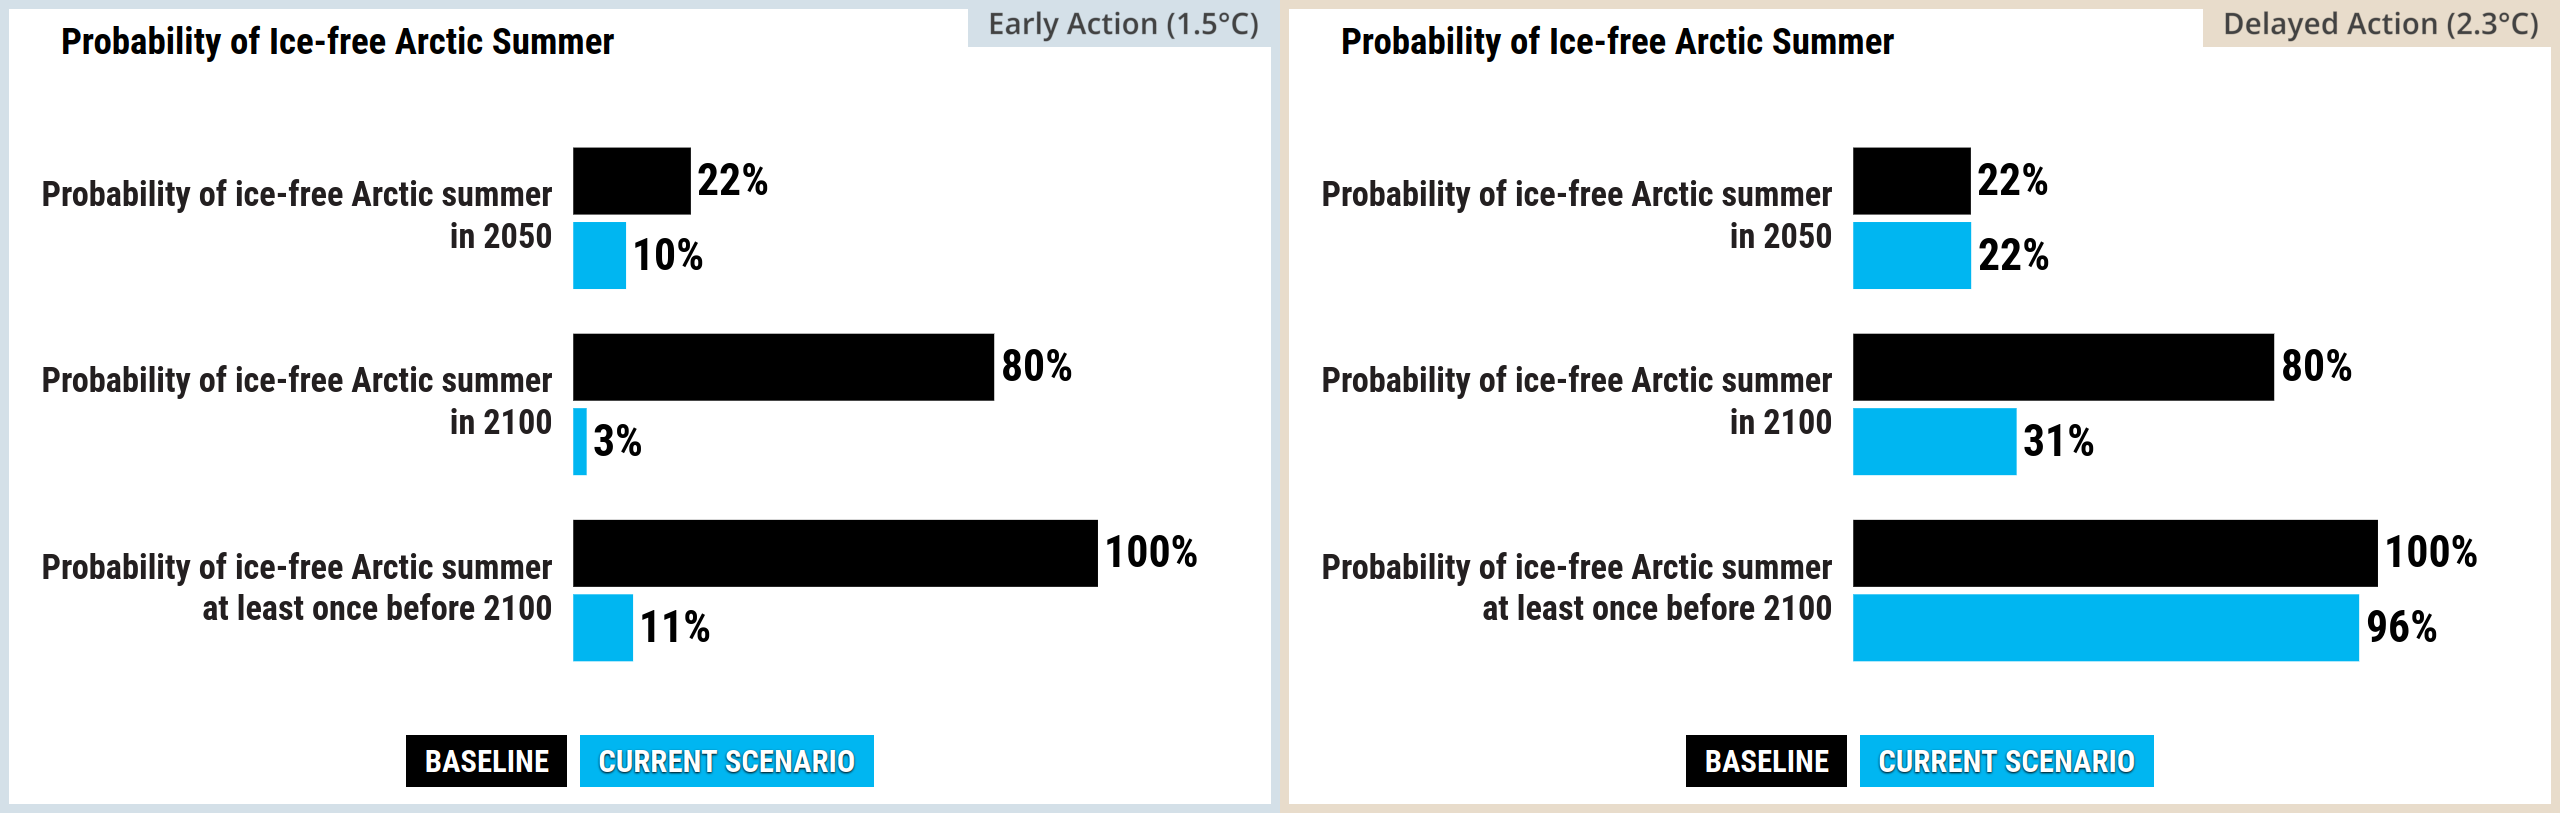
Source: Climate Interactive & MIT Sloan (2026) En-ROADS Simulator (Version 26.8.0)
Agriculture
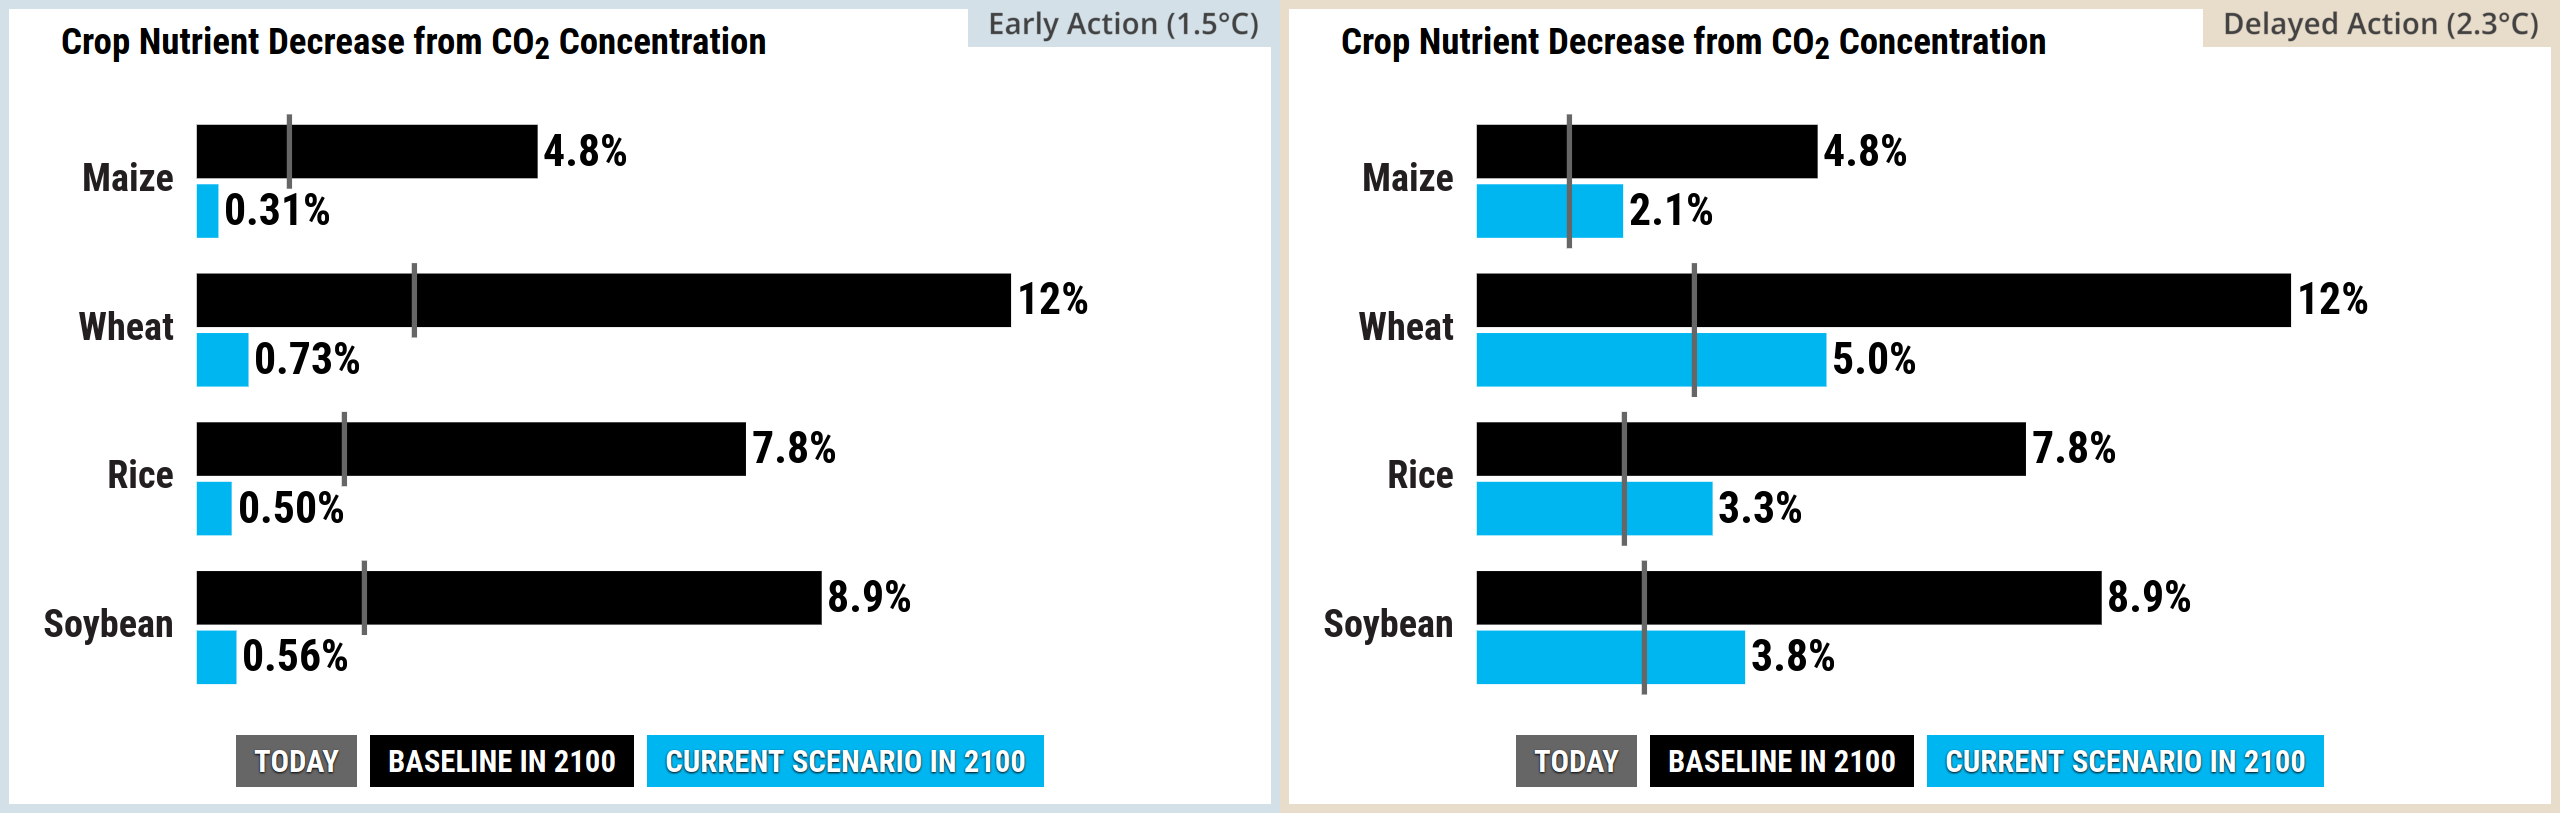
Source: Climate Interactive & MIT Sloan (2026) En-ROADS Simulator (Version 26.8.0)
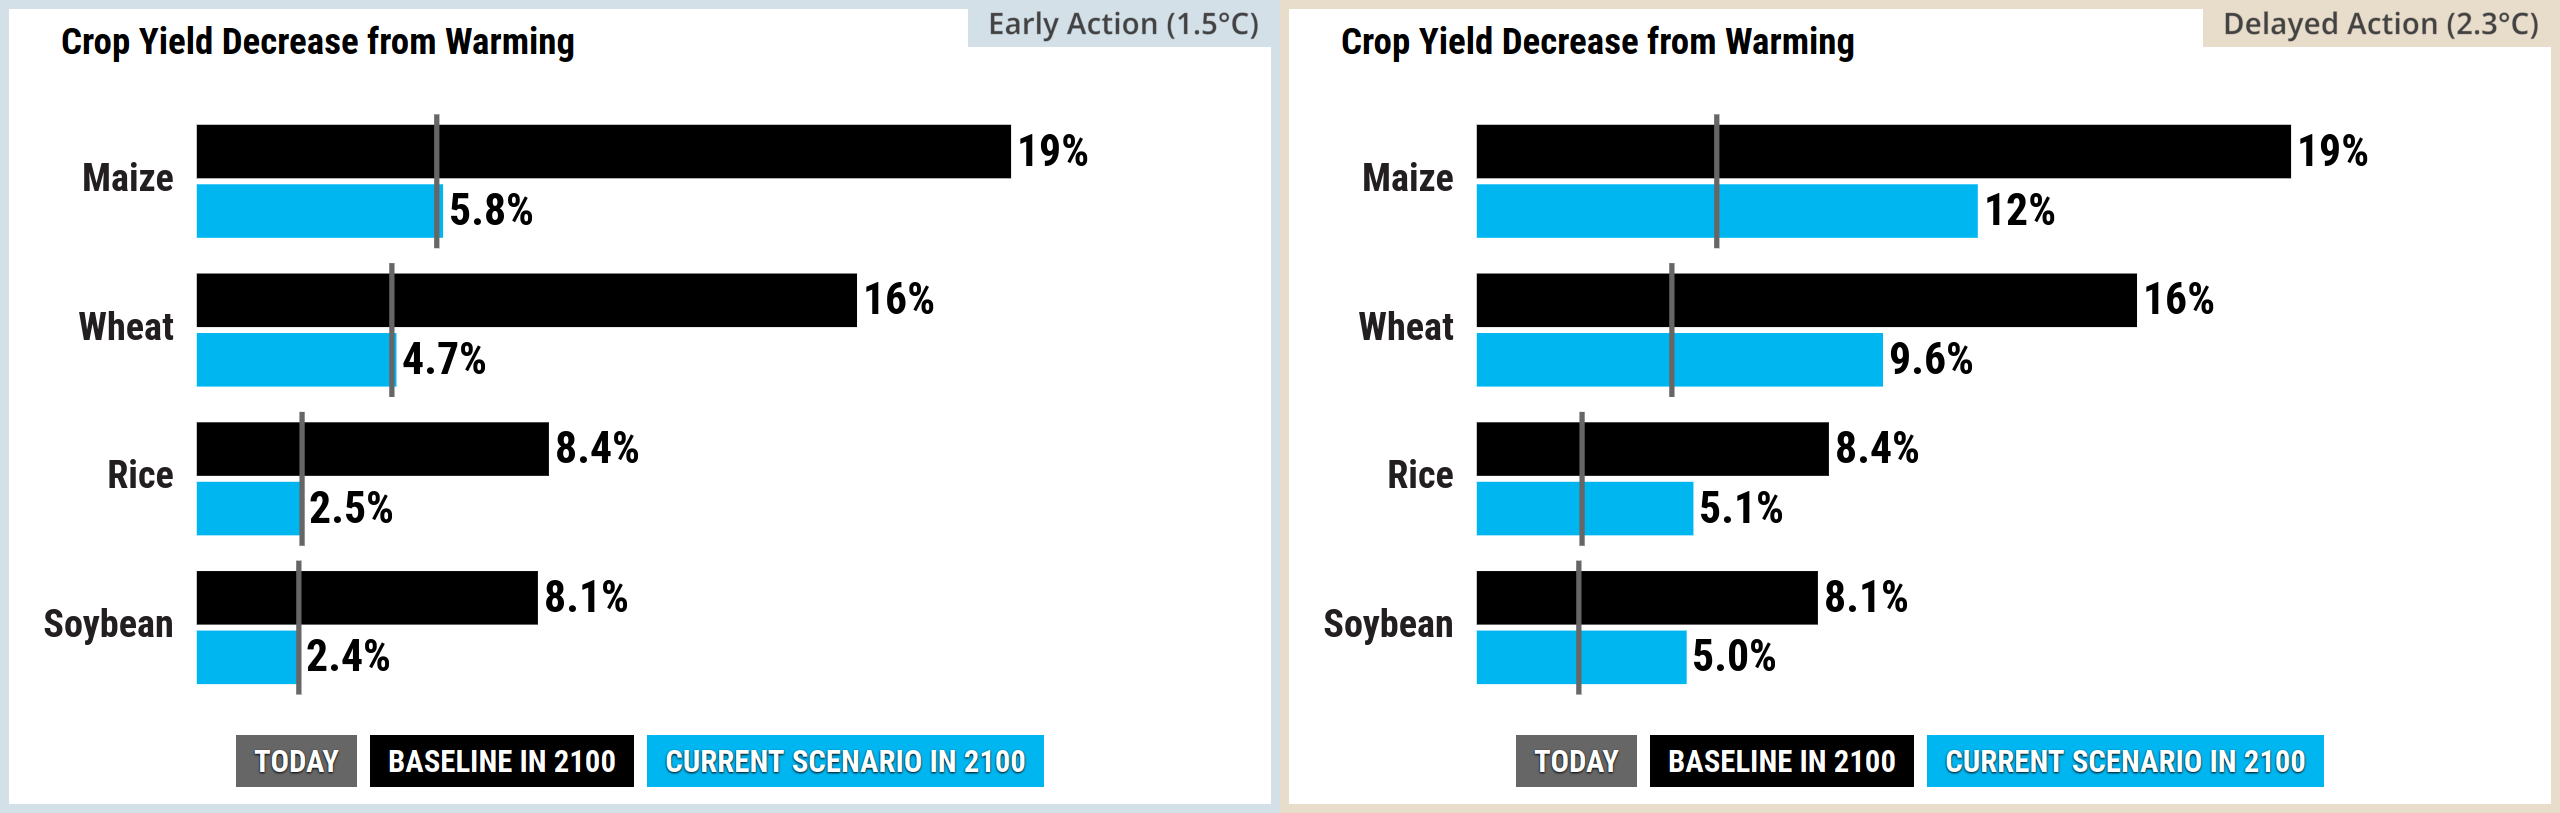
Source: Climate Interactive & MIT Sloan (2026) En-ROADS Simulator (Version 26.8.0)
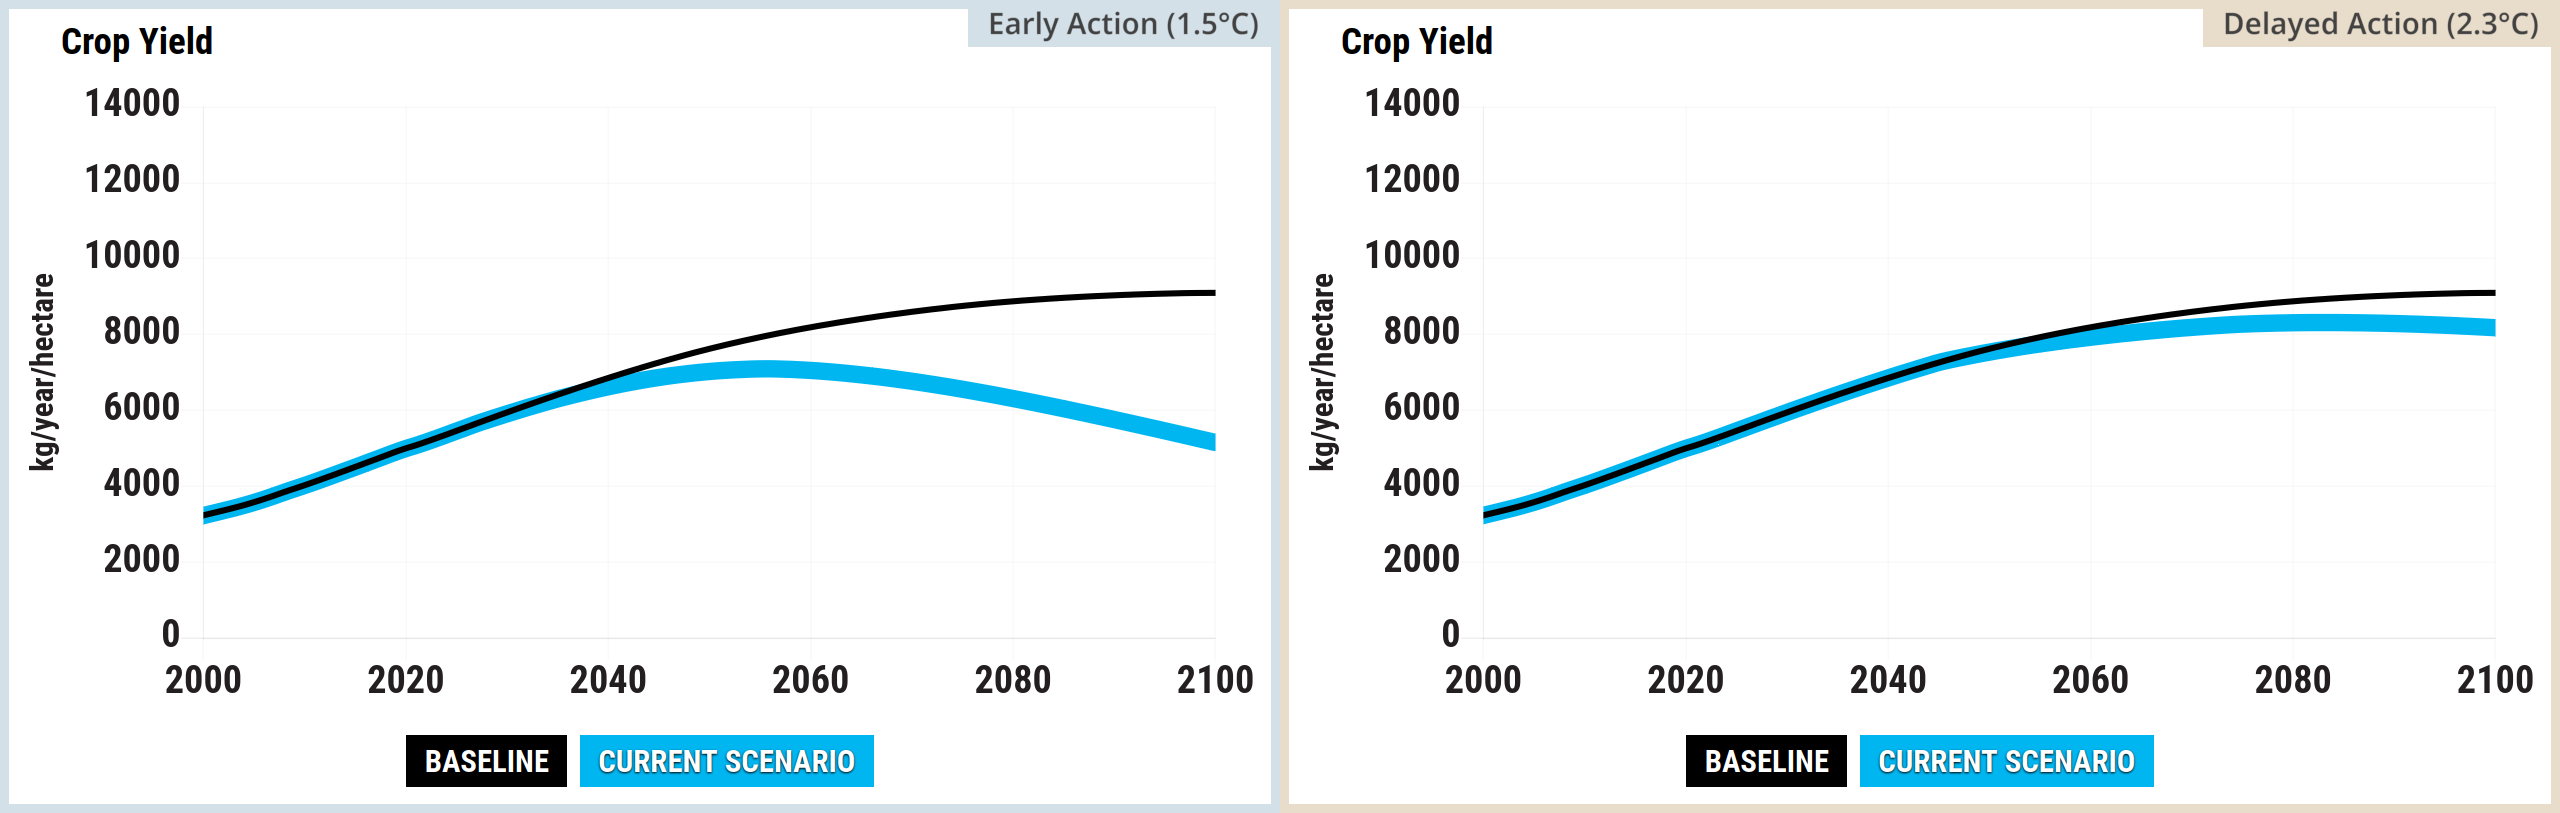
Source: Climate Interactive & MIT Sloan (2026) En-ROADS Simulator (Version 26.8.0)
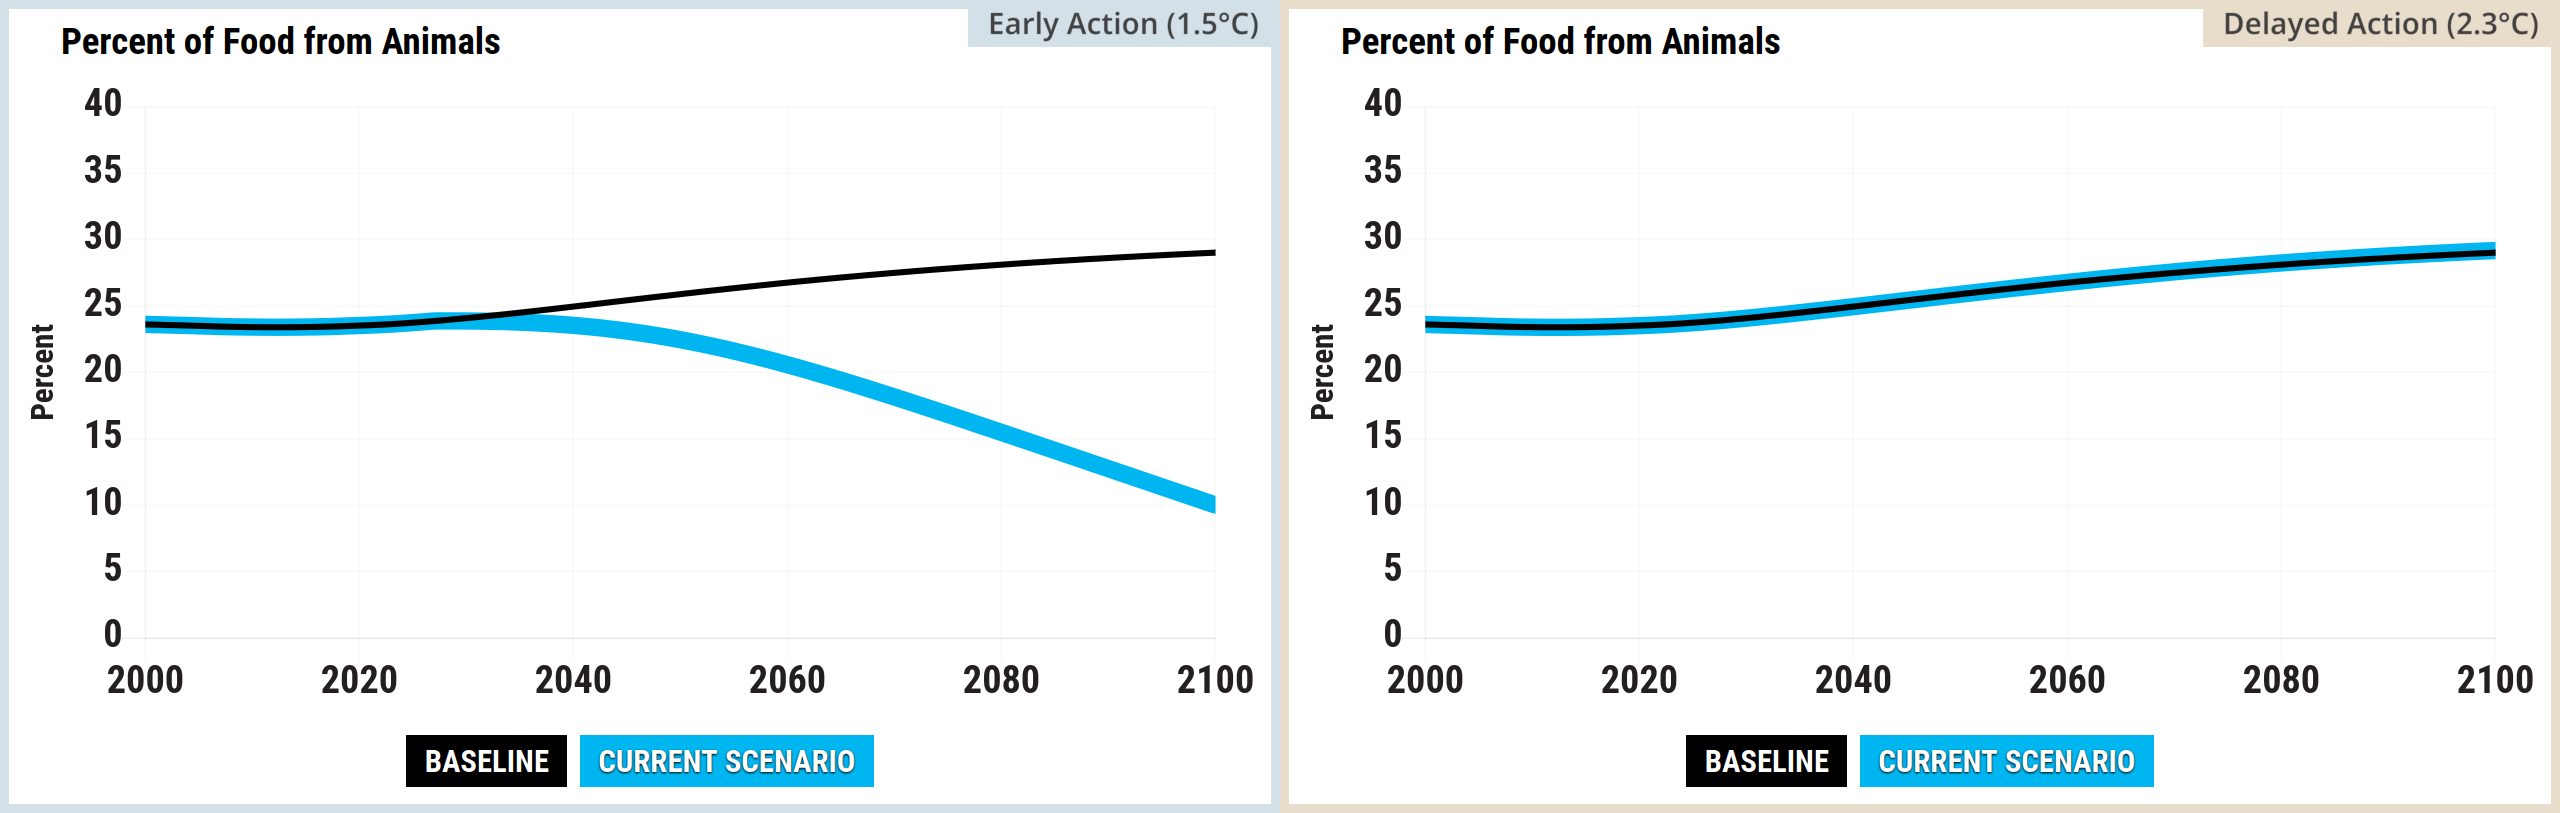
Source: Climate Interactive & MIT Sloan (2026) En-ROADS Simulator (Version 26.8.0)
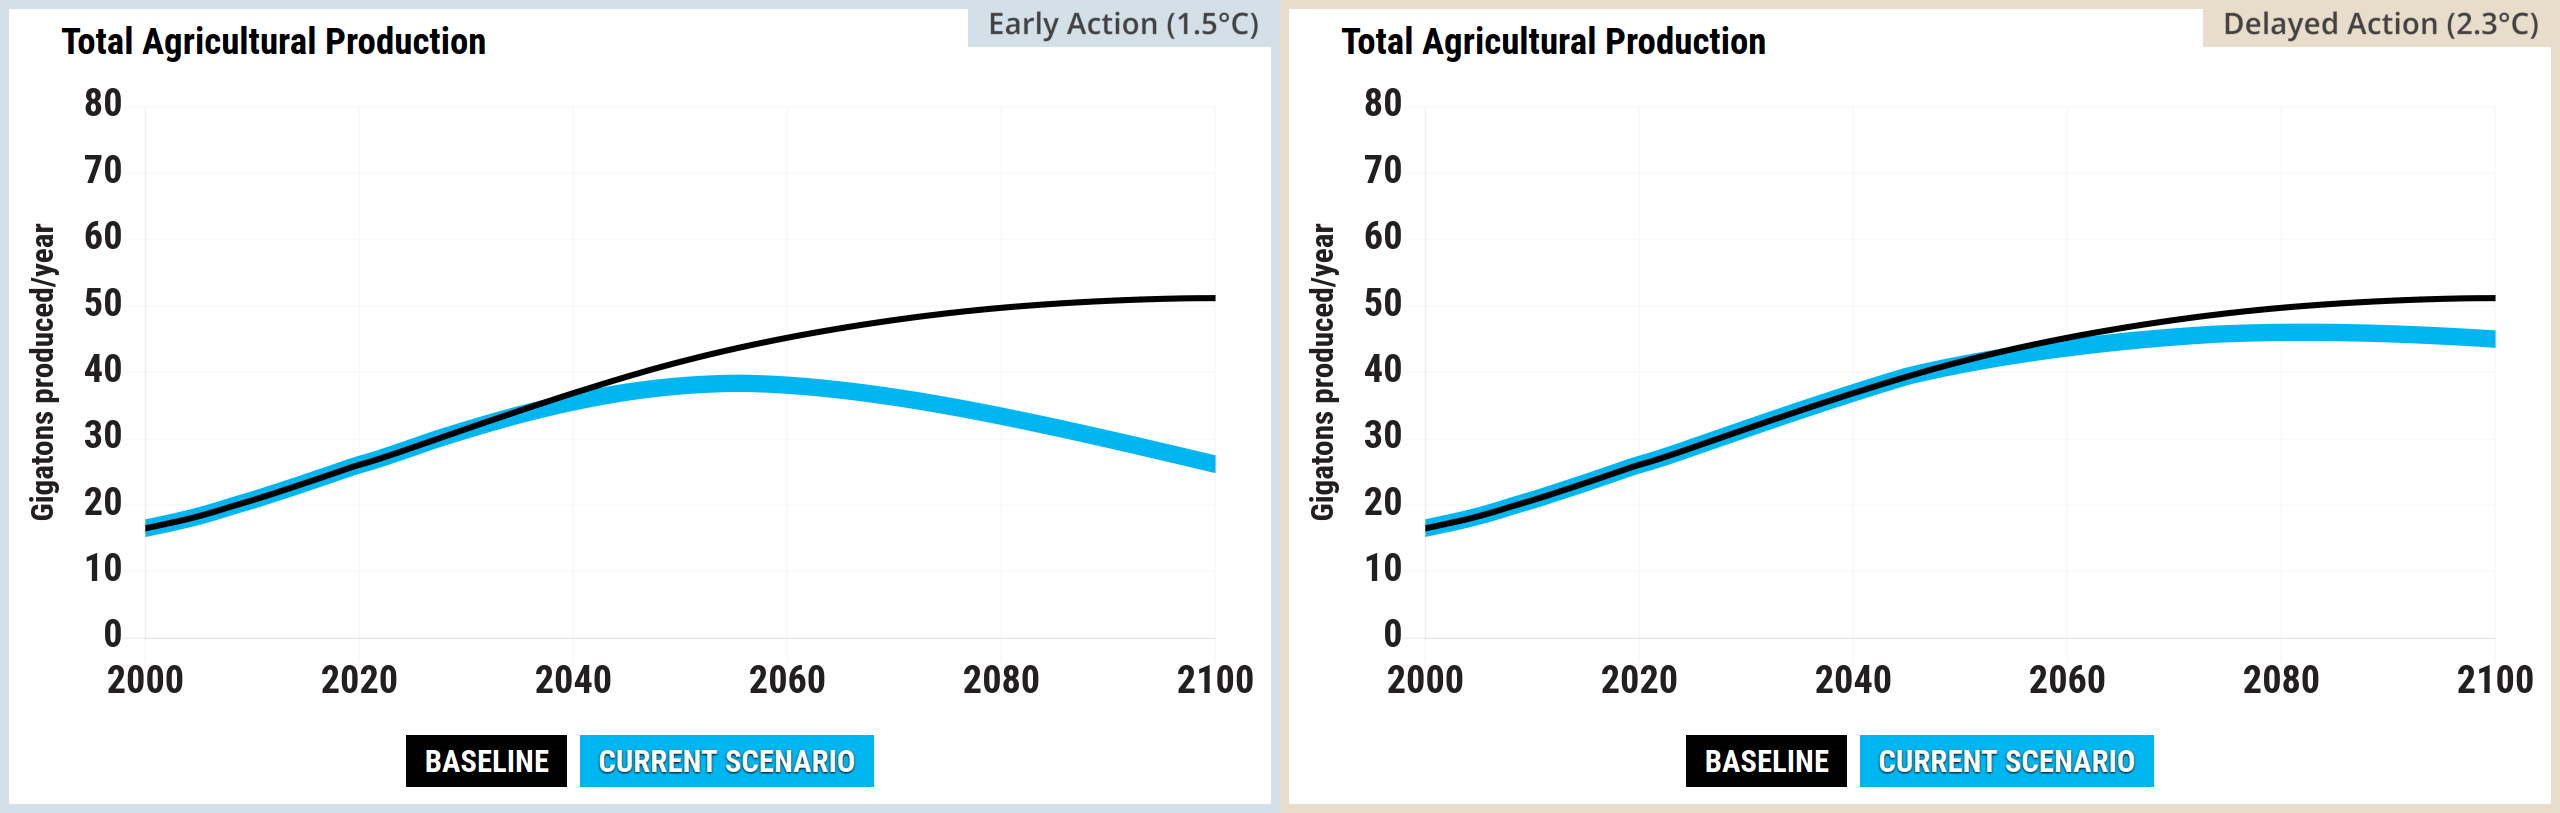
Source: Climate Interactive & MIT Sloan (2026) En-ROADS Simulator (Version 26.8.0)
GHG emissions
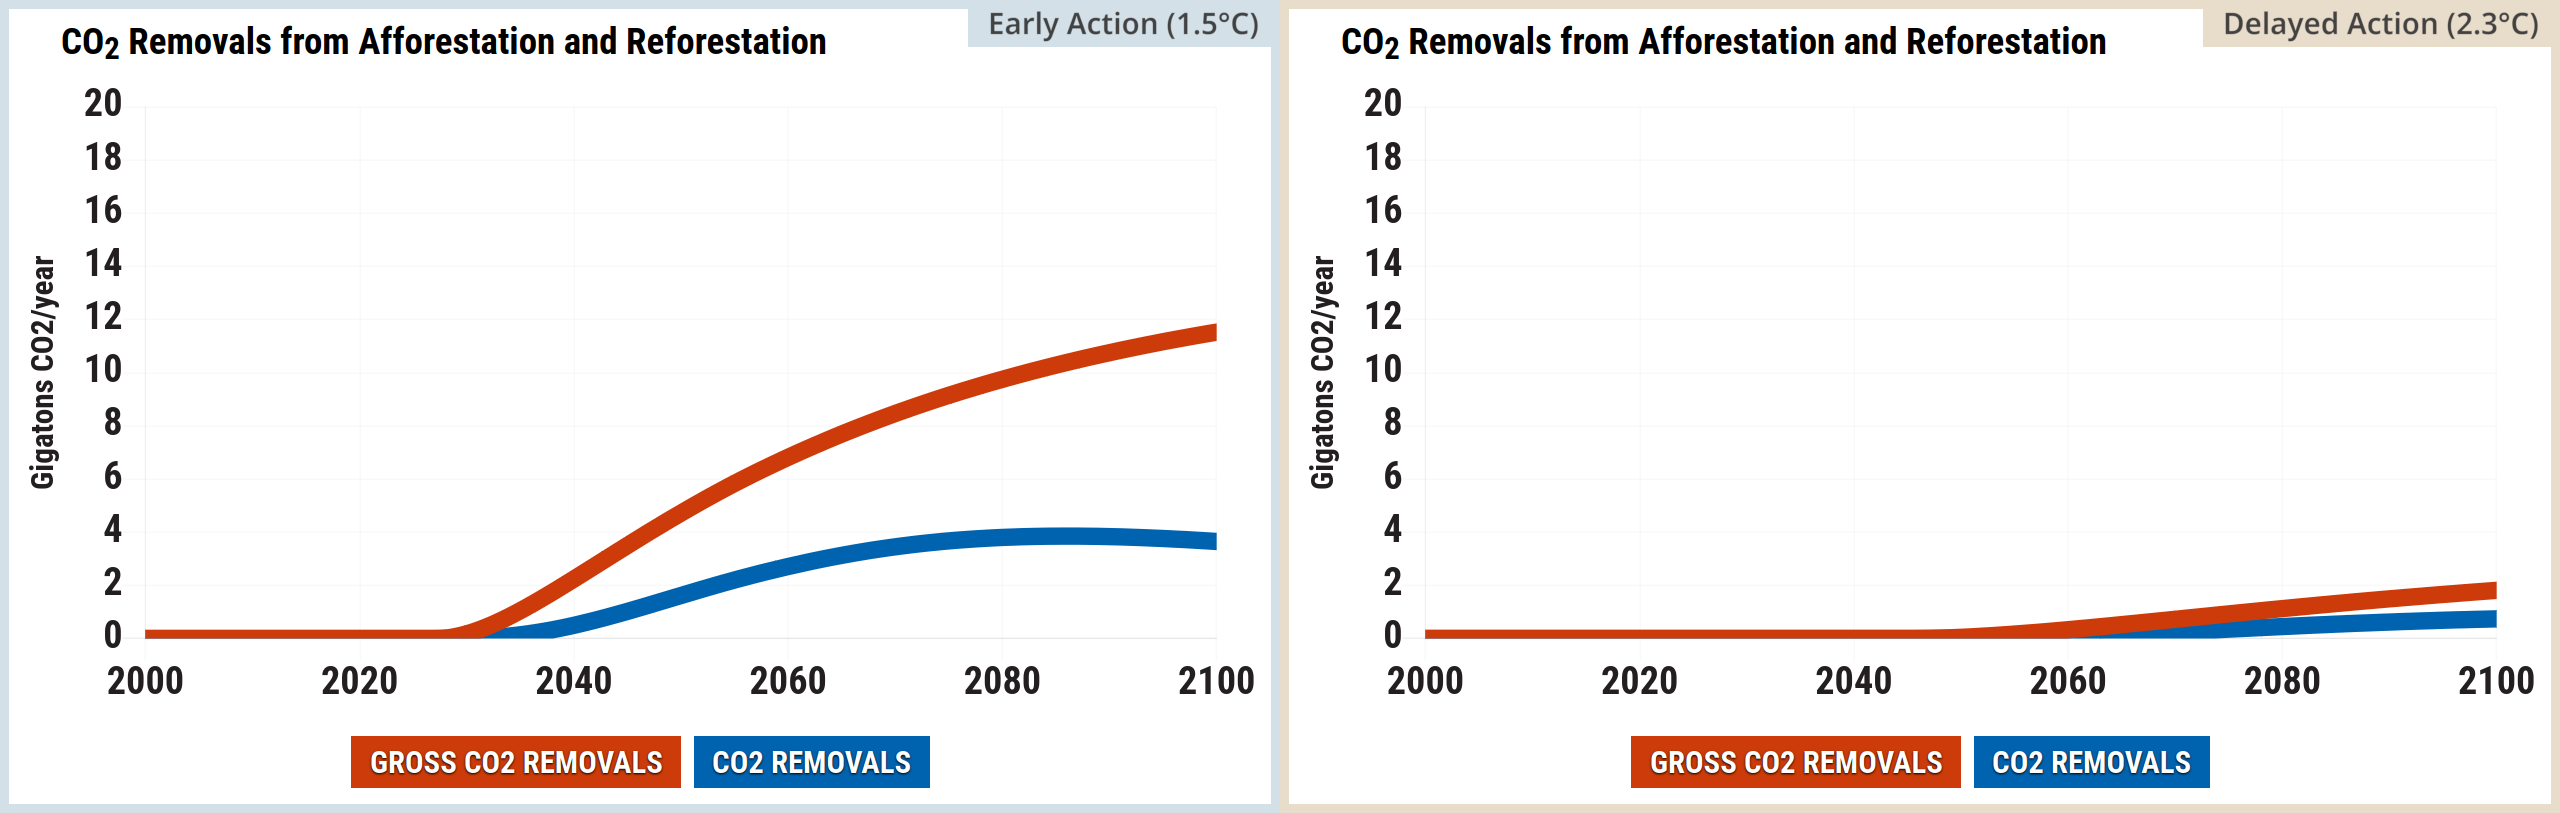
Source: Climate Interactive & MIT Sloan (2026) En-ROADS Simulator (Version 26.8.0)
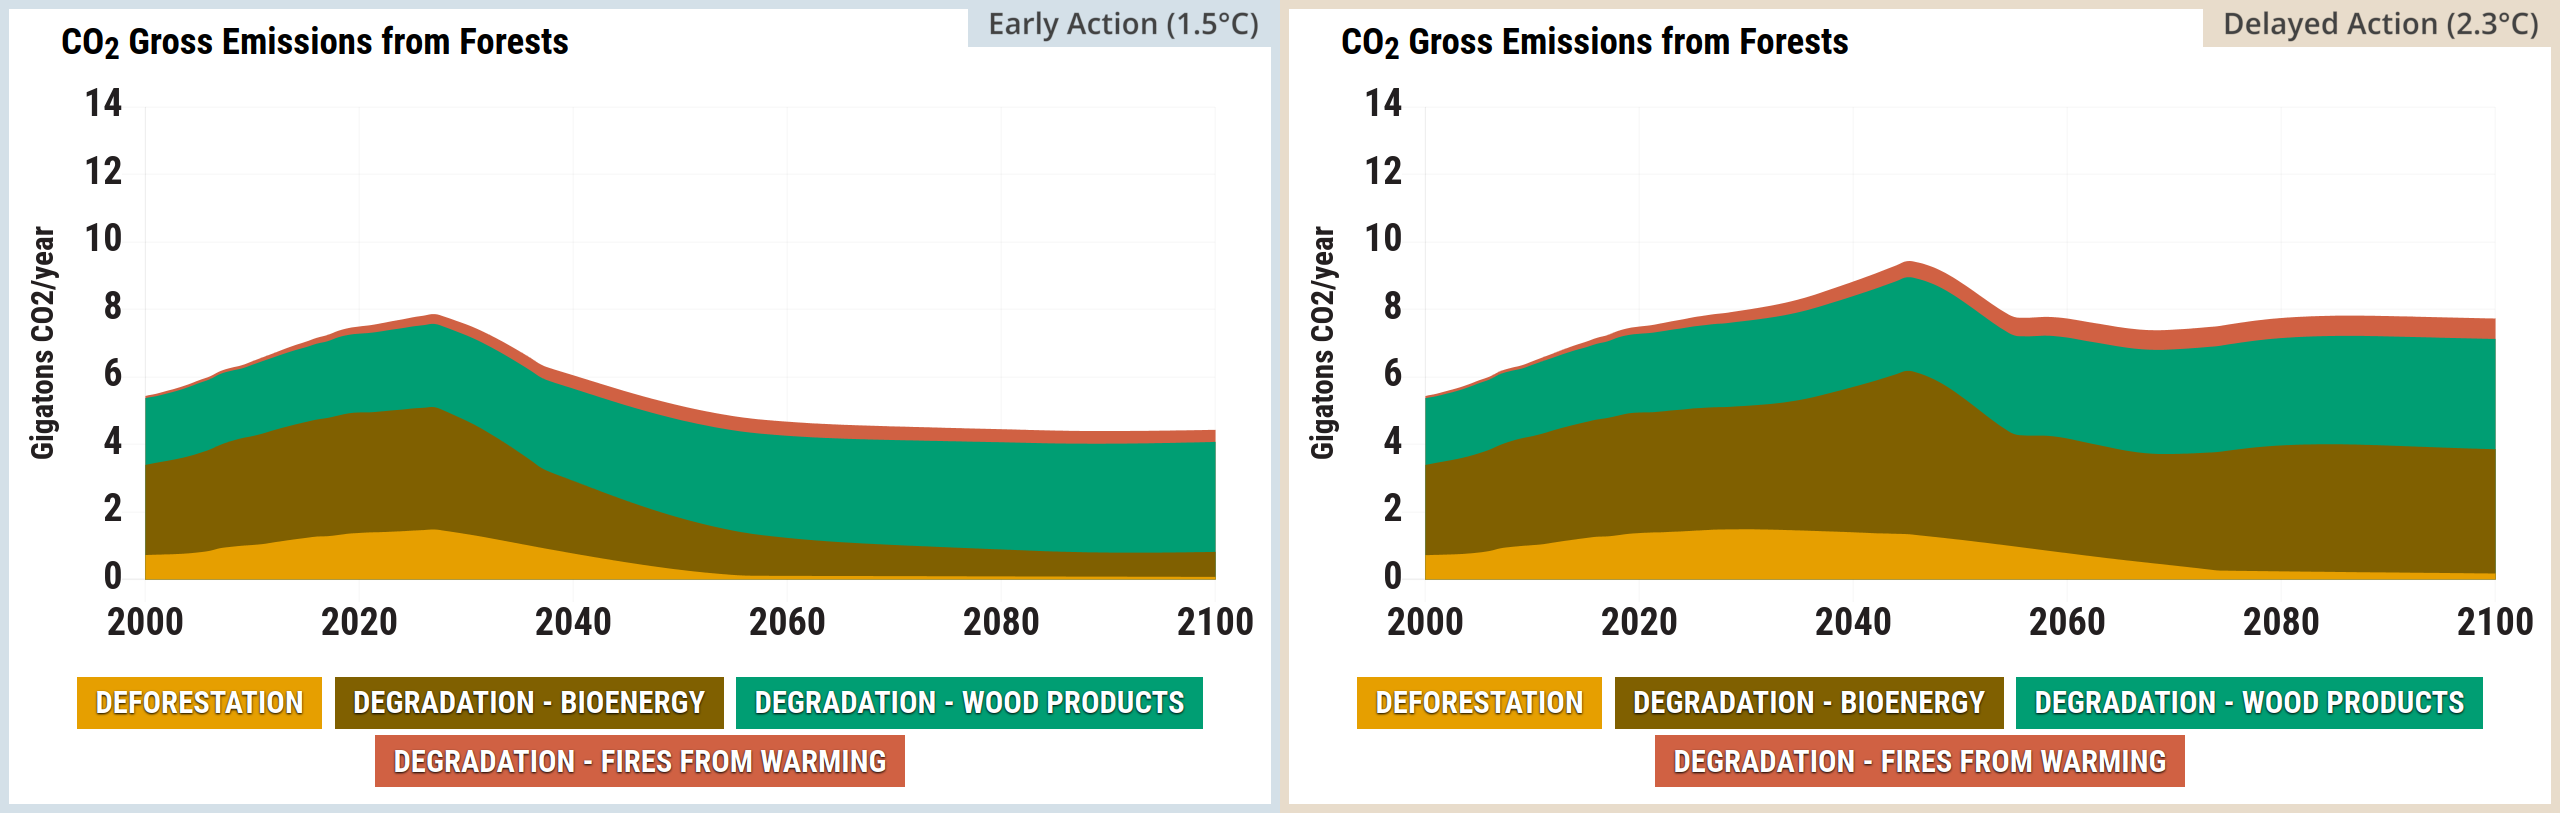
Source: Climate Interactive & MIT Sloan (2026) En-ROADS Simulator (Version 26.8.0)
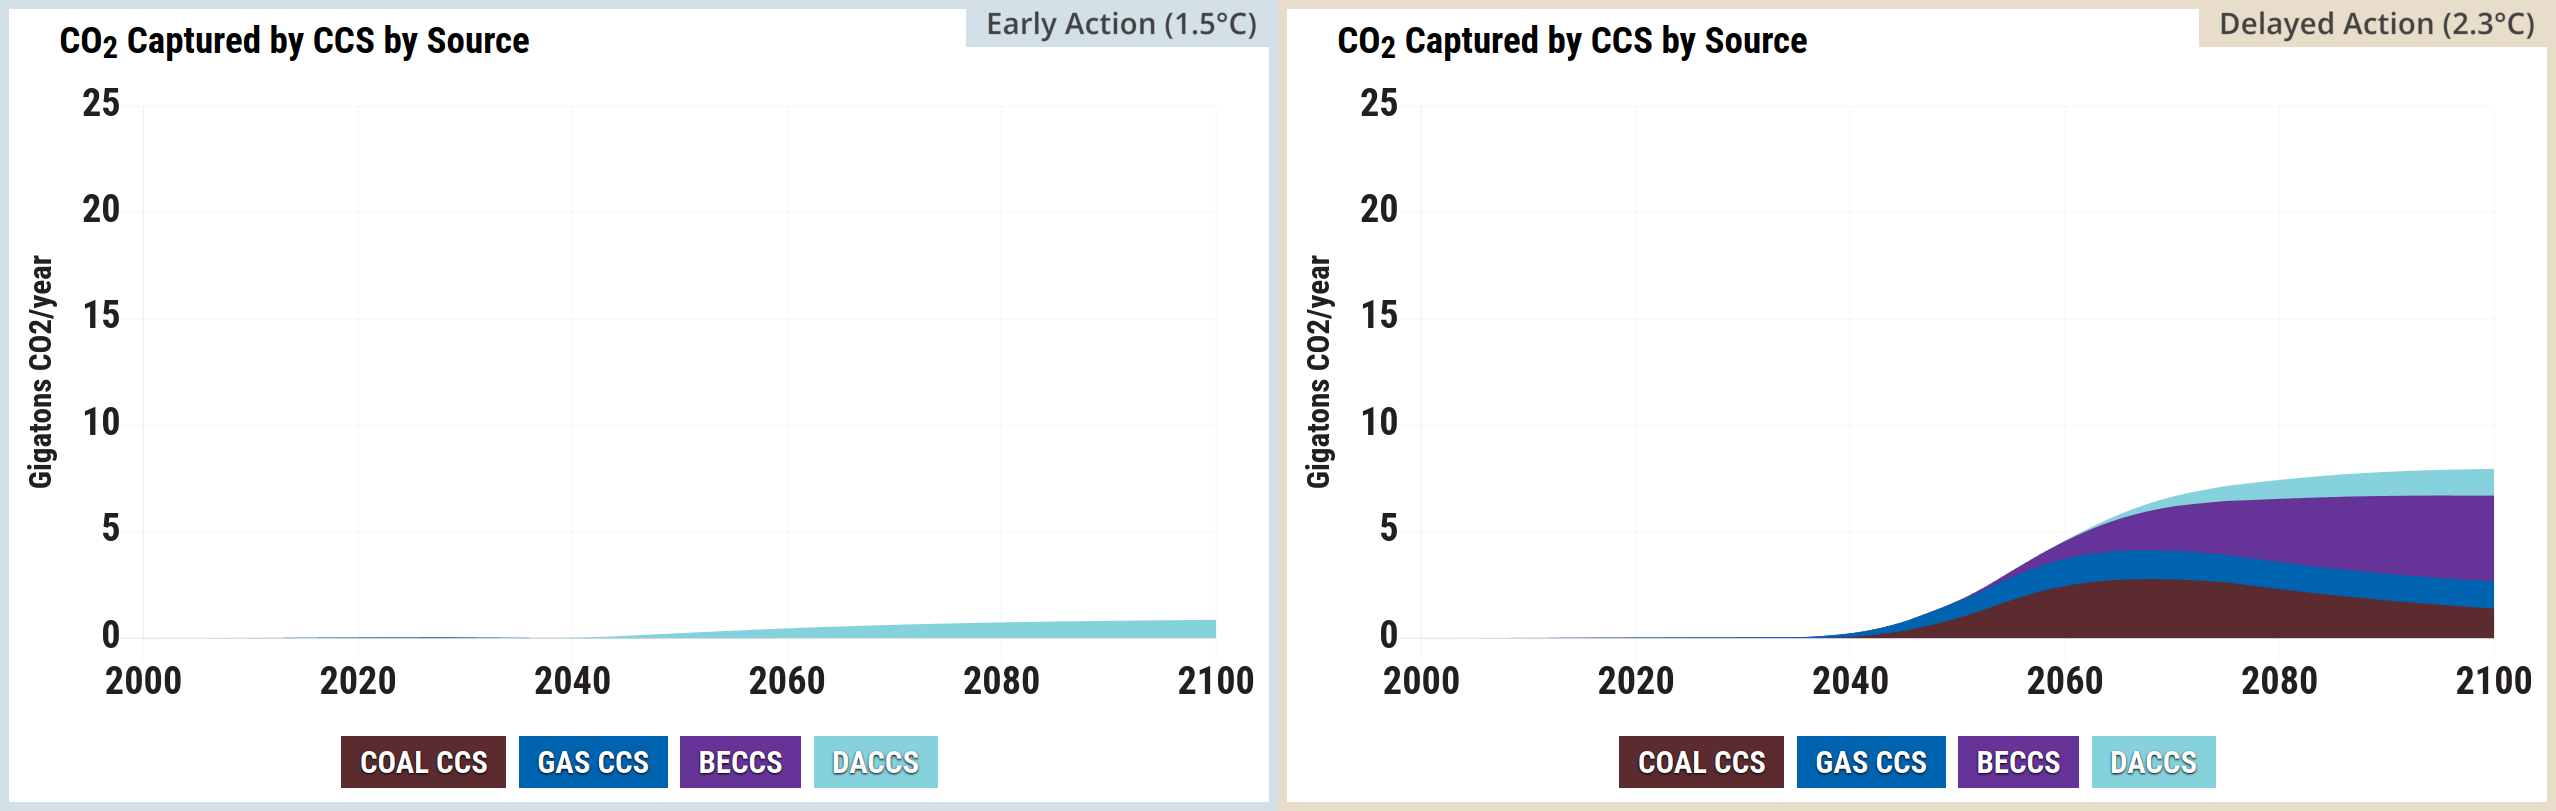
Source: Climate Interactive & MIT Sloan (2026) En-ROADS Simulator (Version 26.8.0)
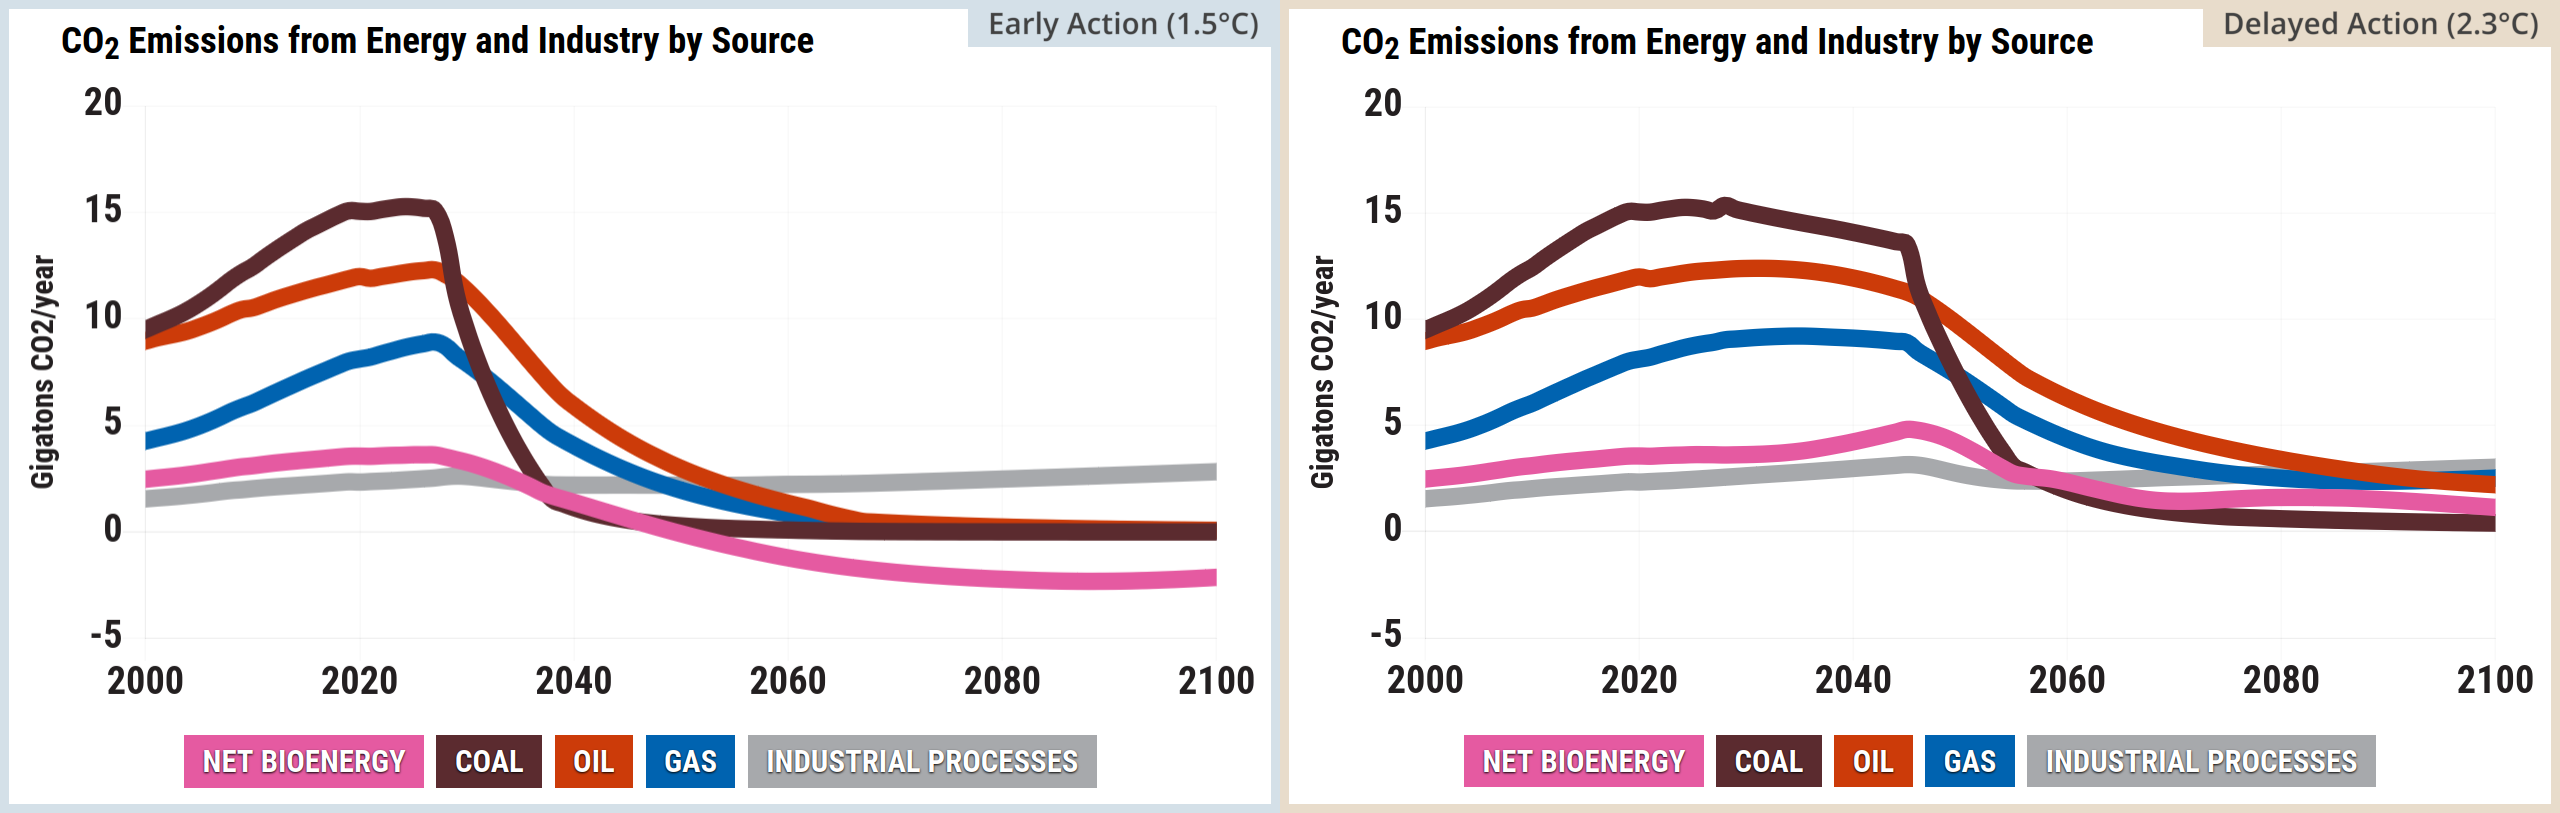
Source: Climate Interactive & MIT Sloan (2026) En-ROADS Simulator (Version 26.8.0)
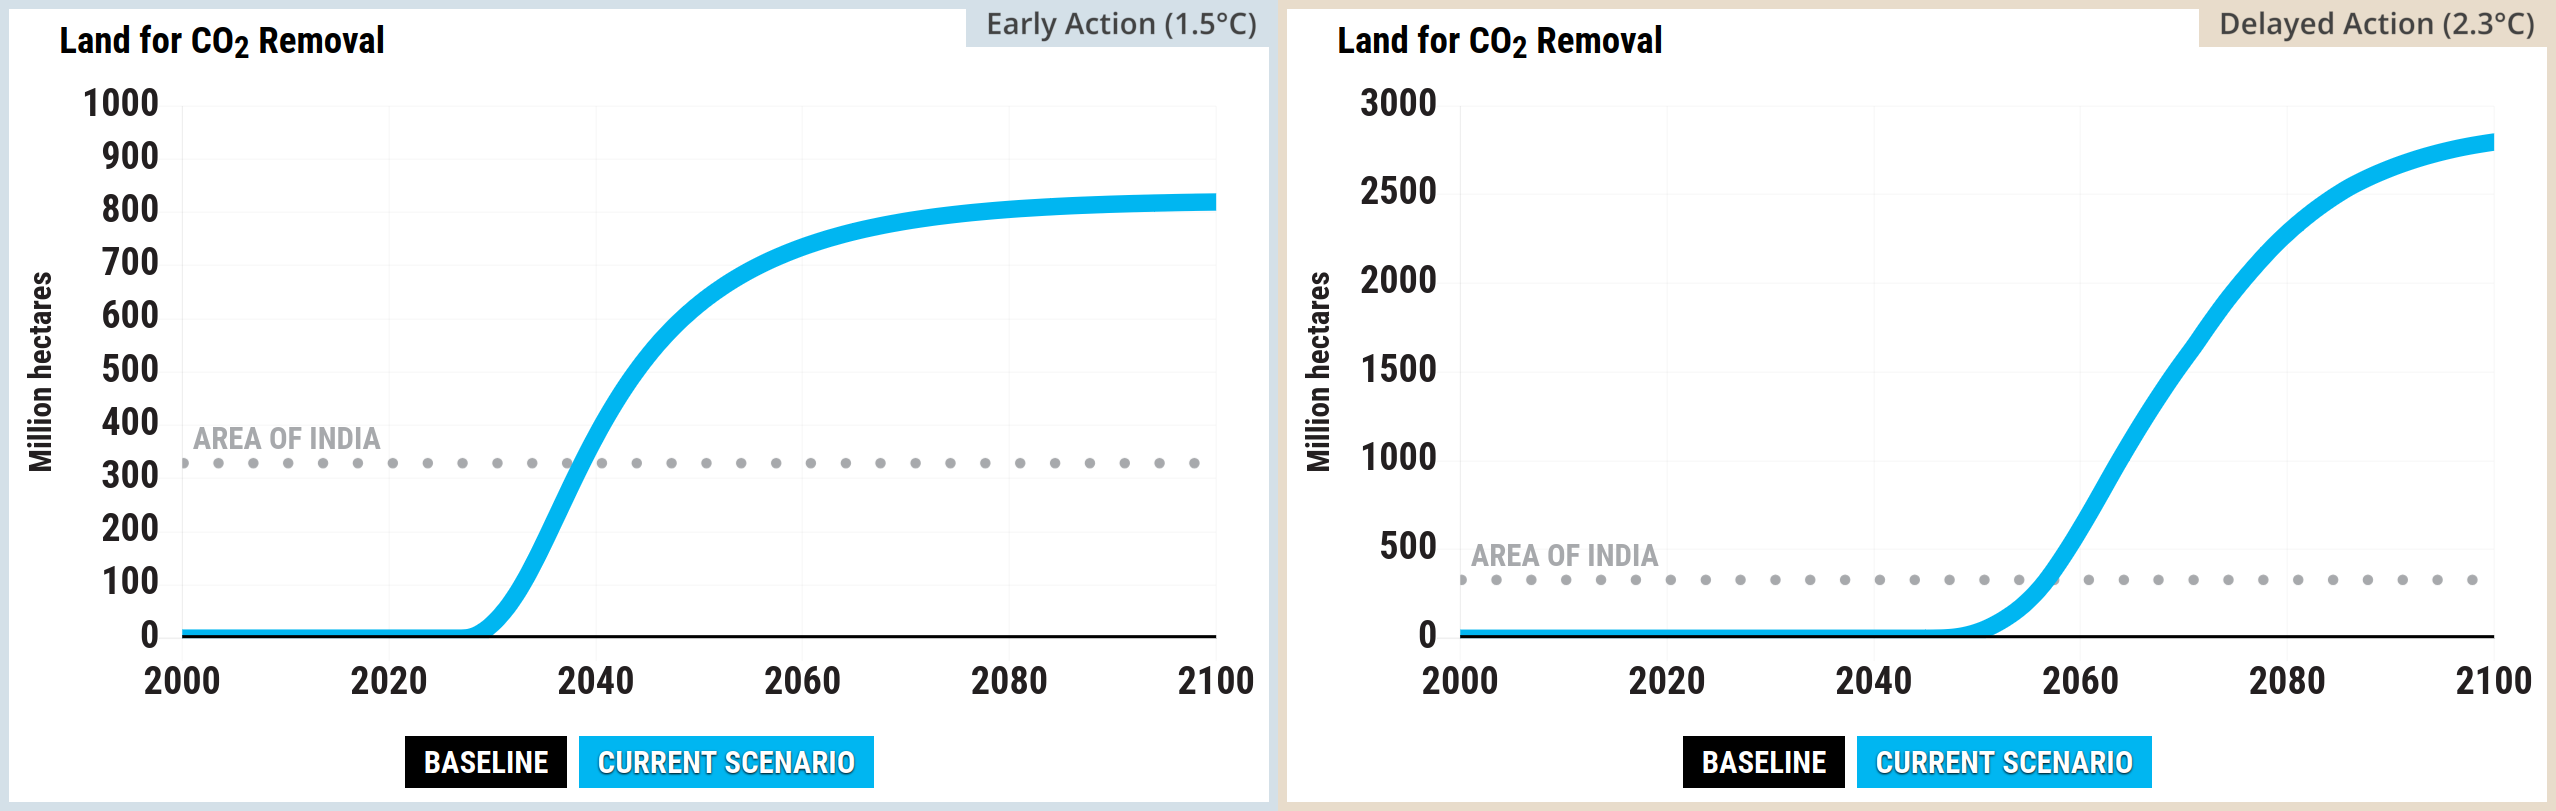
Source: Climate Interactive & MIT Sloan (2026) En-ROADS Simulator (Version 26.8.0)
Source: Climate Interactive & MIT Sloan (2026) En-ROADS Simulator (Version 26.8.0)
Source: Climate Interactive & MIT Sloan (2026) En-ROADS Simulator (Version 26.8.0)
Source: Climate Interactive & MIT Sloan (2026) En-ROADS Simulator (Version 26.8.0)
Source: Climate Interactive & MIT Sloan (2026) En-ROADS Simulator (Version 26.8.0)
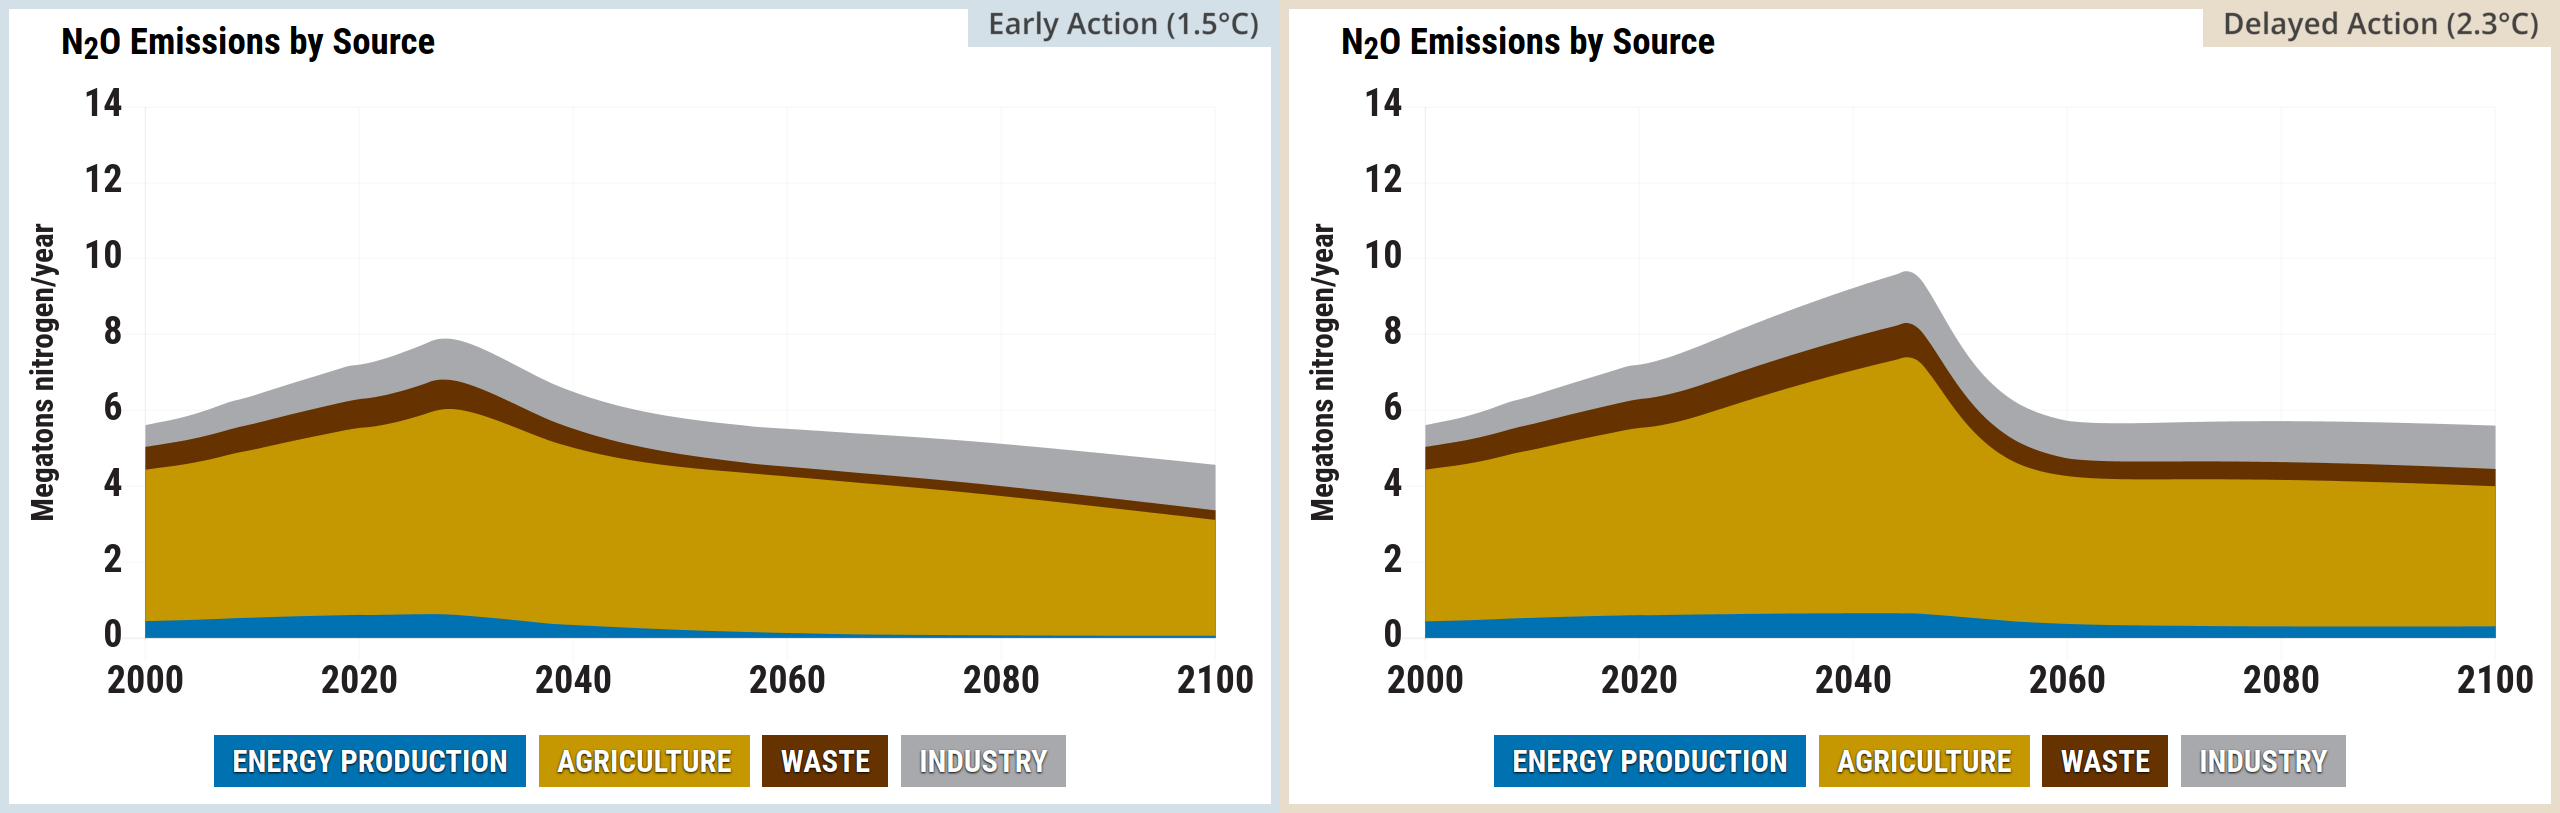
Source: Climate Interactive & MIT Sloan (2026) En-ROADS Simulator (Version 26.8.0)
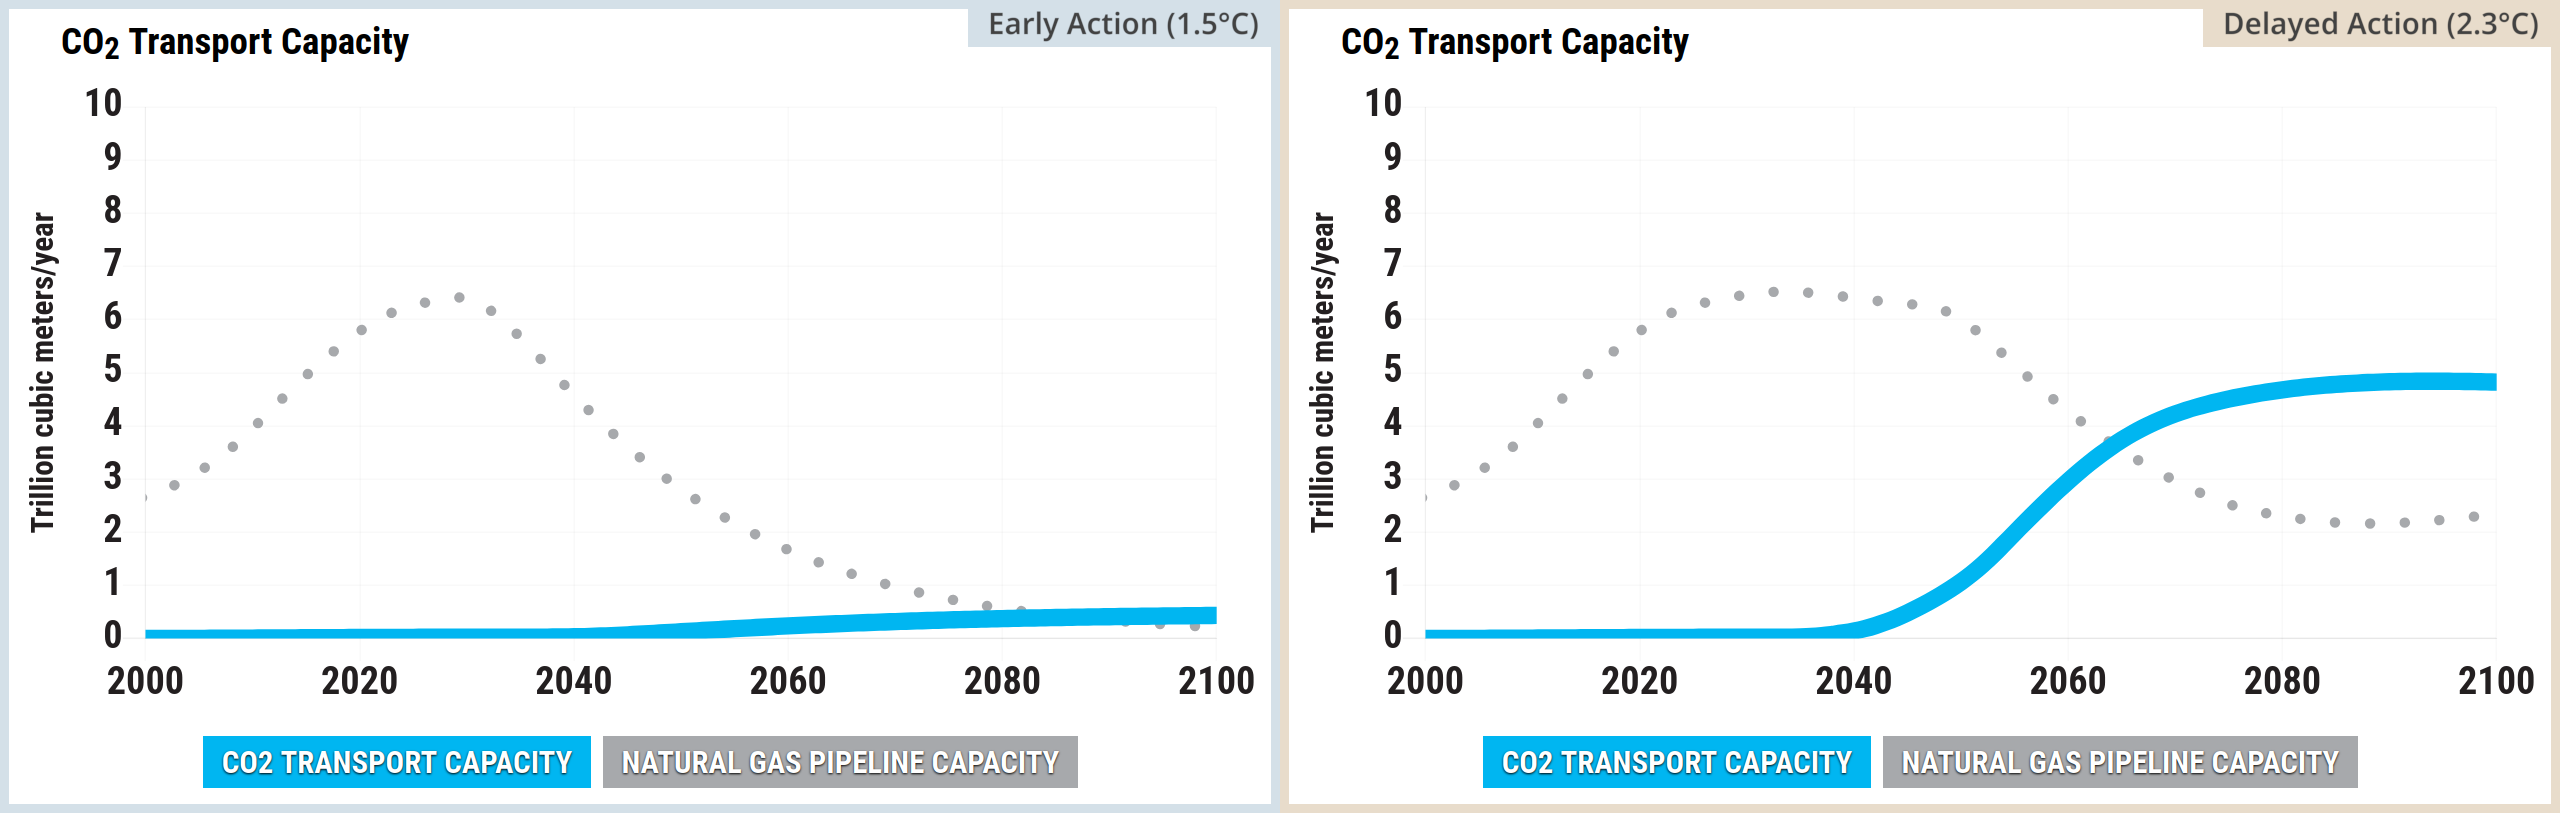
Source: Climate Interactive & MIT Sloan (2026) En-ROADS Simulator (Version 26.8.0)
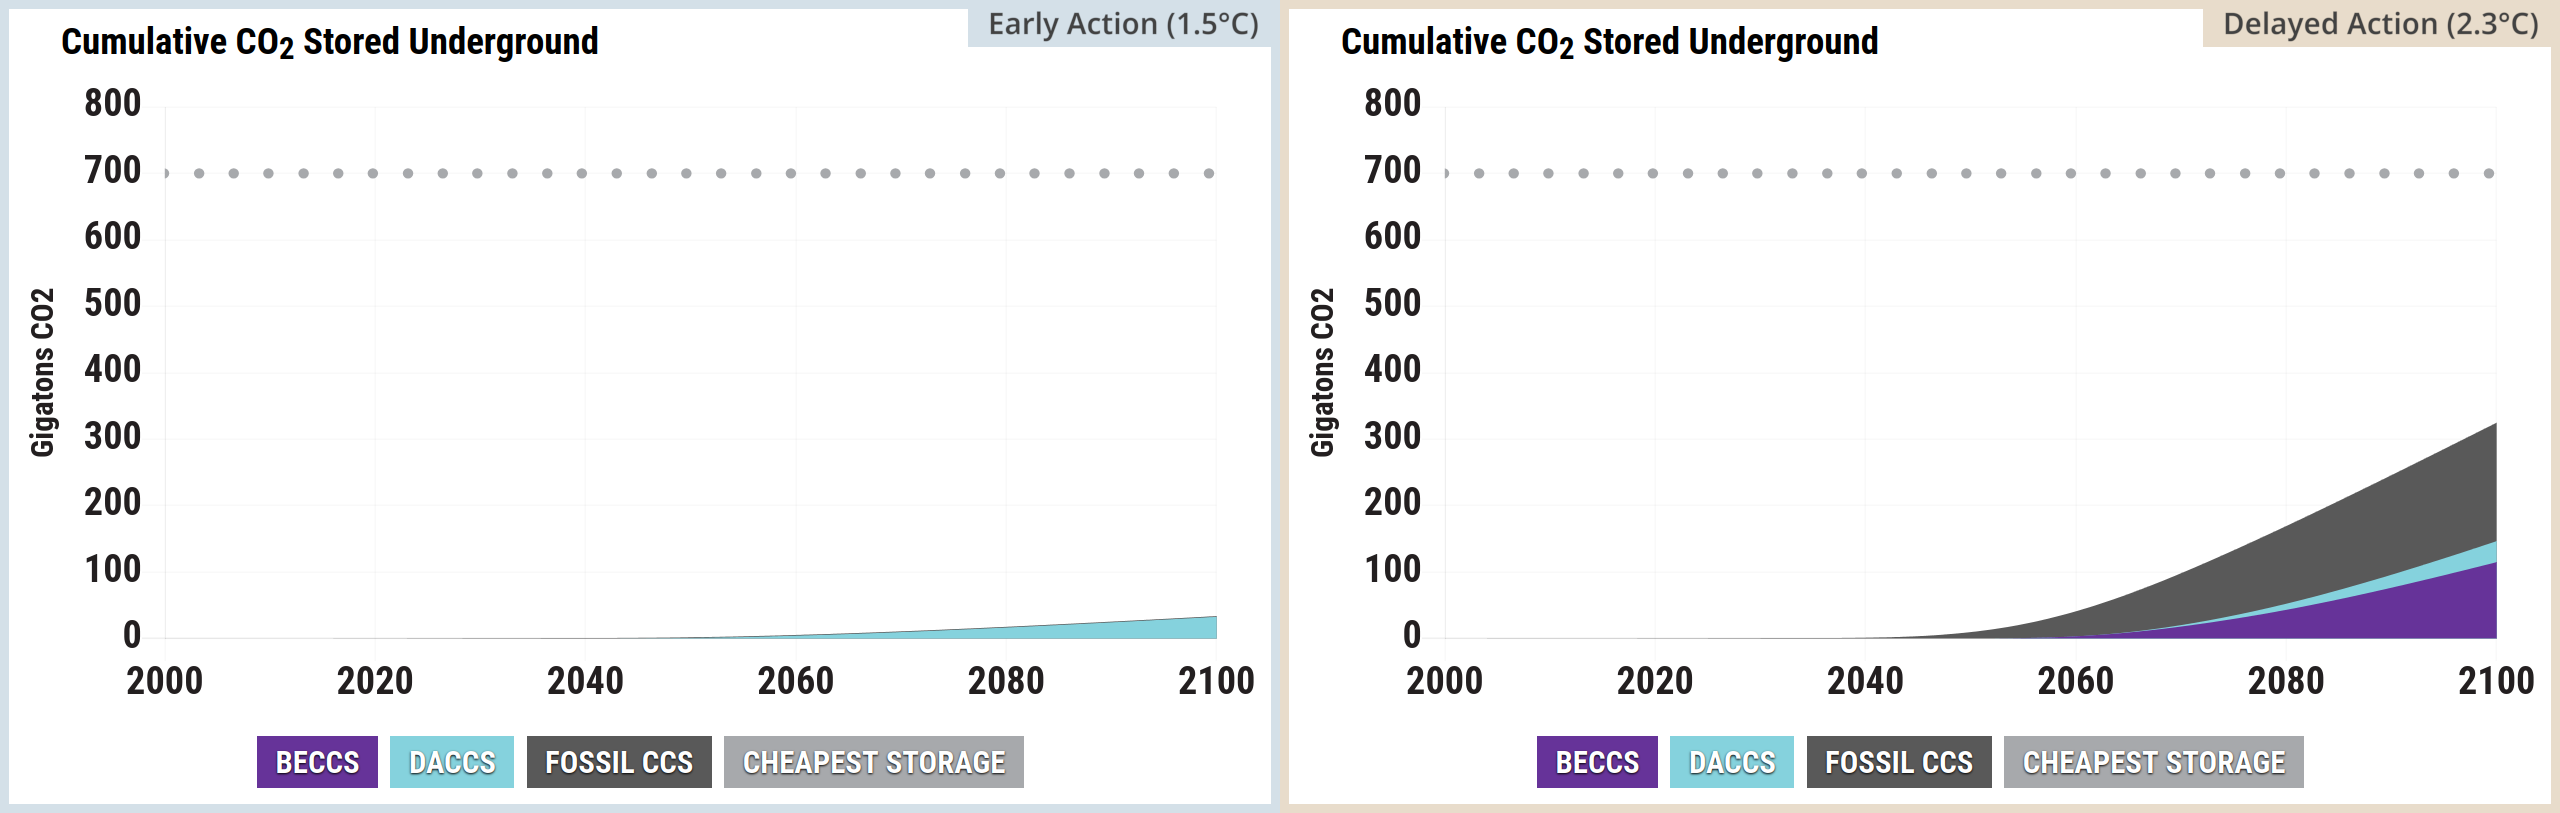
Source: Climate Interactive & MIT Sloan (2026) En-ROADS Simulator (Version 26.8.0)
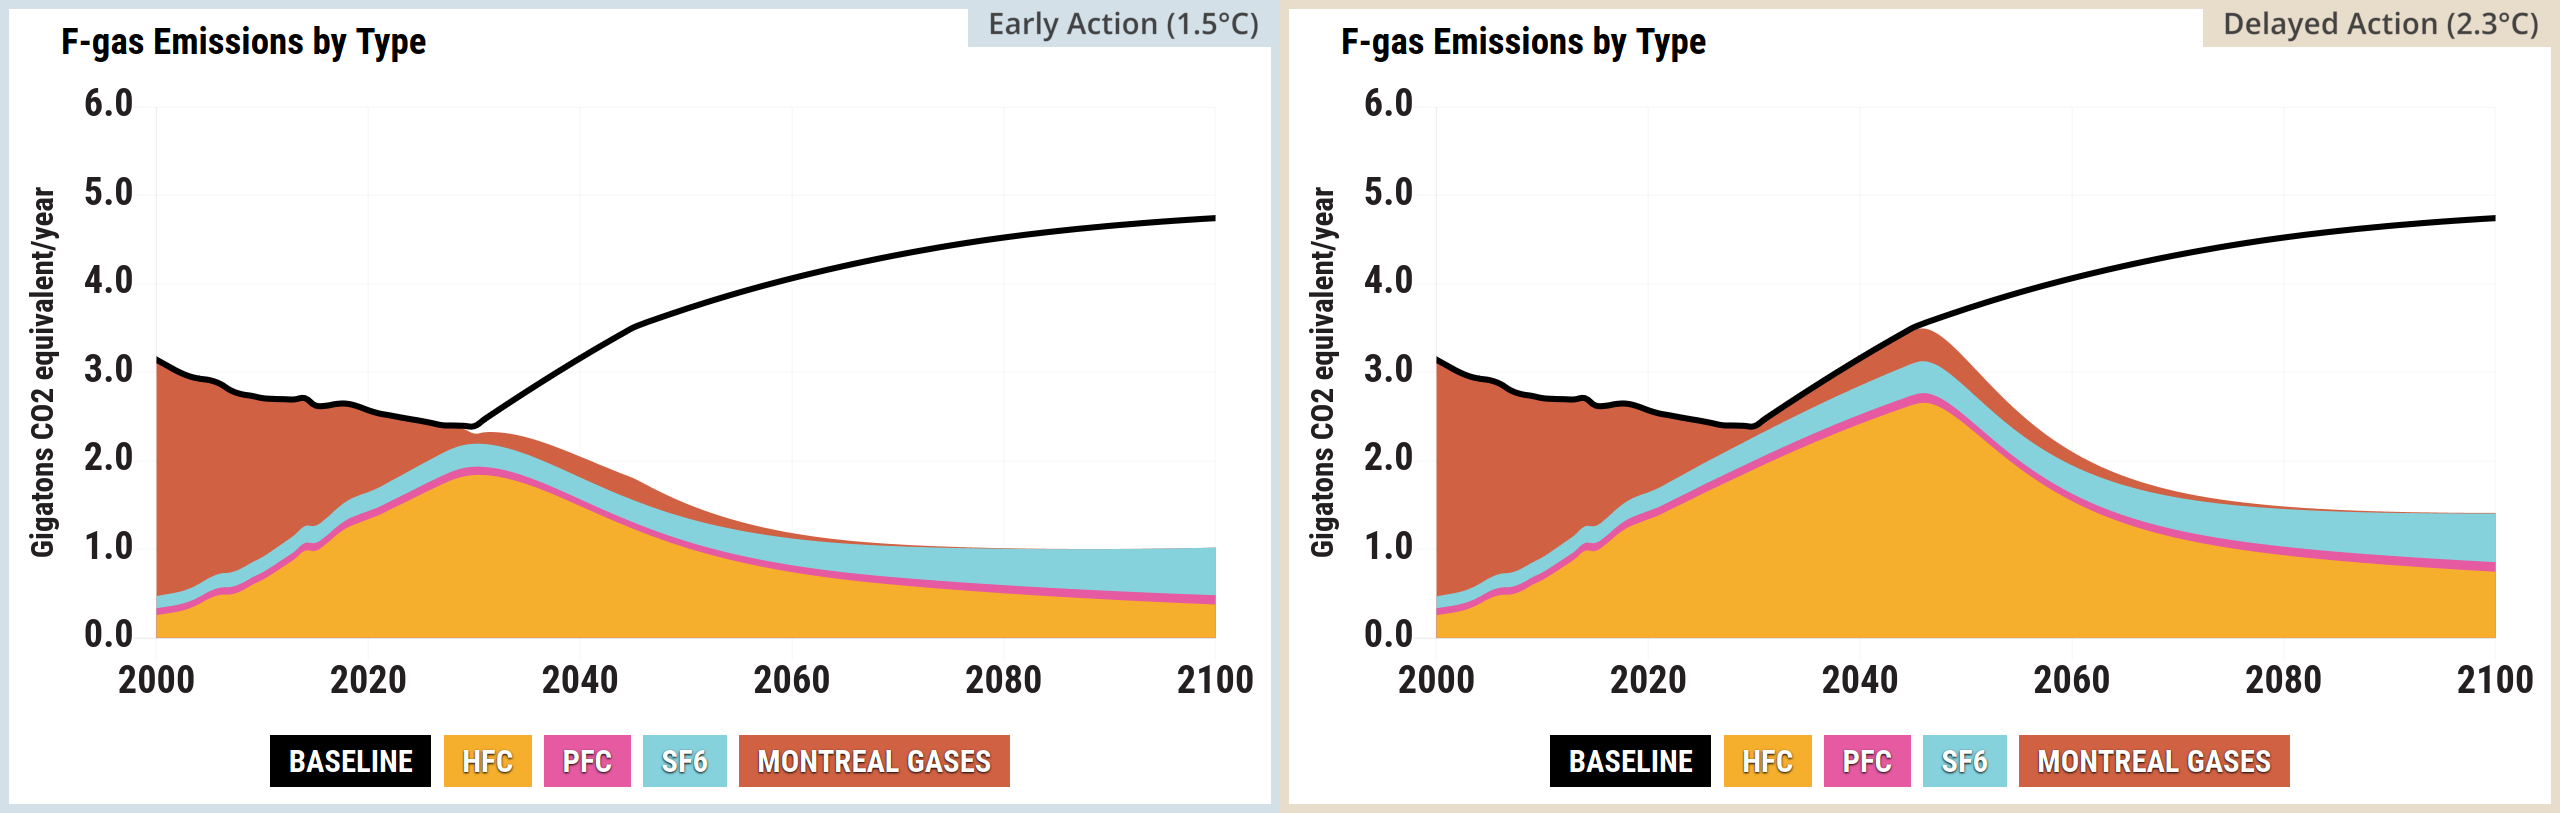
Source: Climate Interactive & MIT Sloan (2026) En-ROADS Simulator (Version 26.8.0)
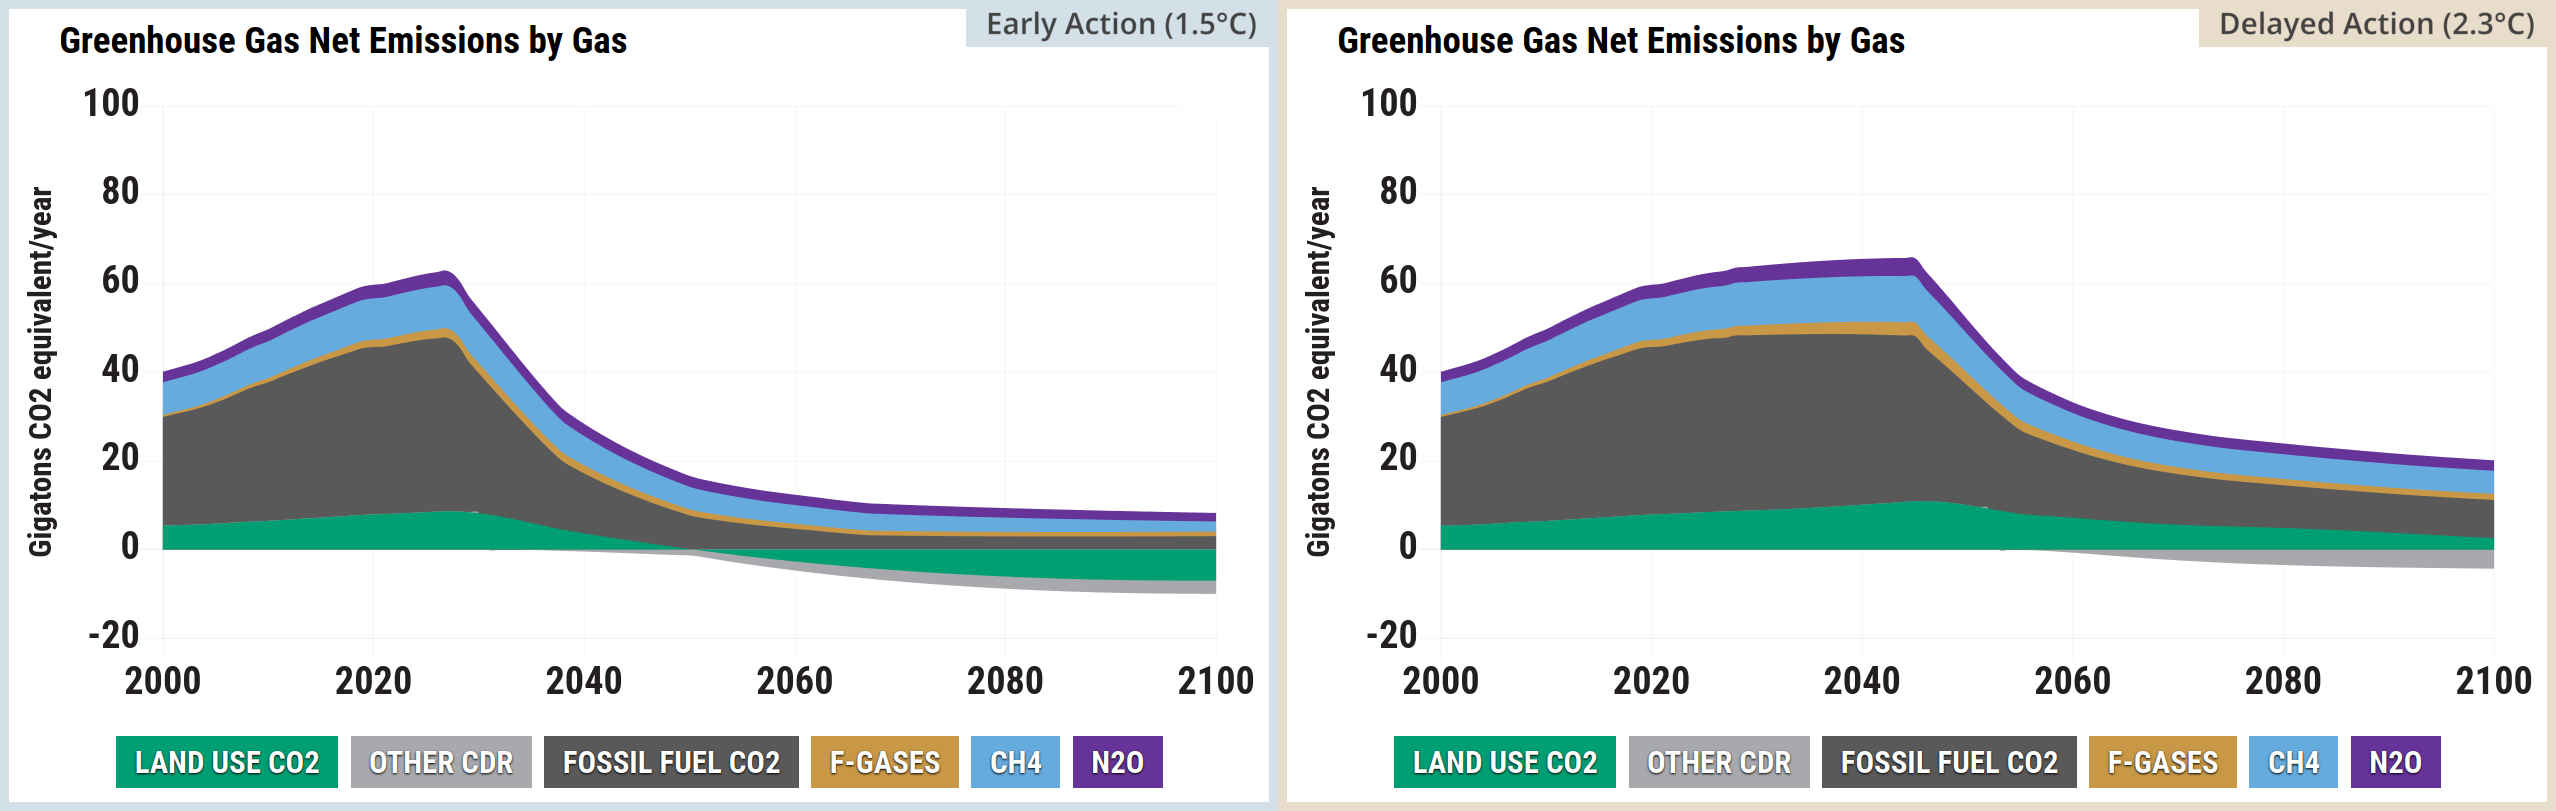
Source: Climate Interactive & MIT Sloan (2026) En-ROADS Simulator (Version 26.8.0)
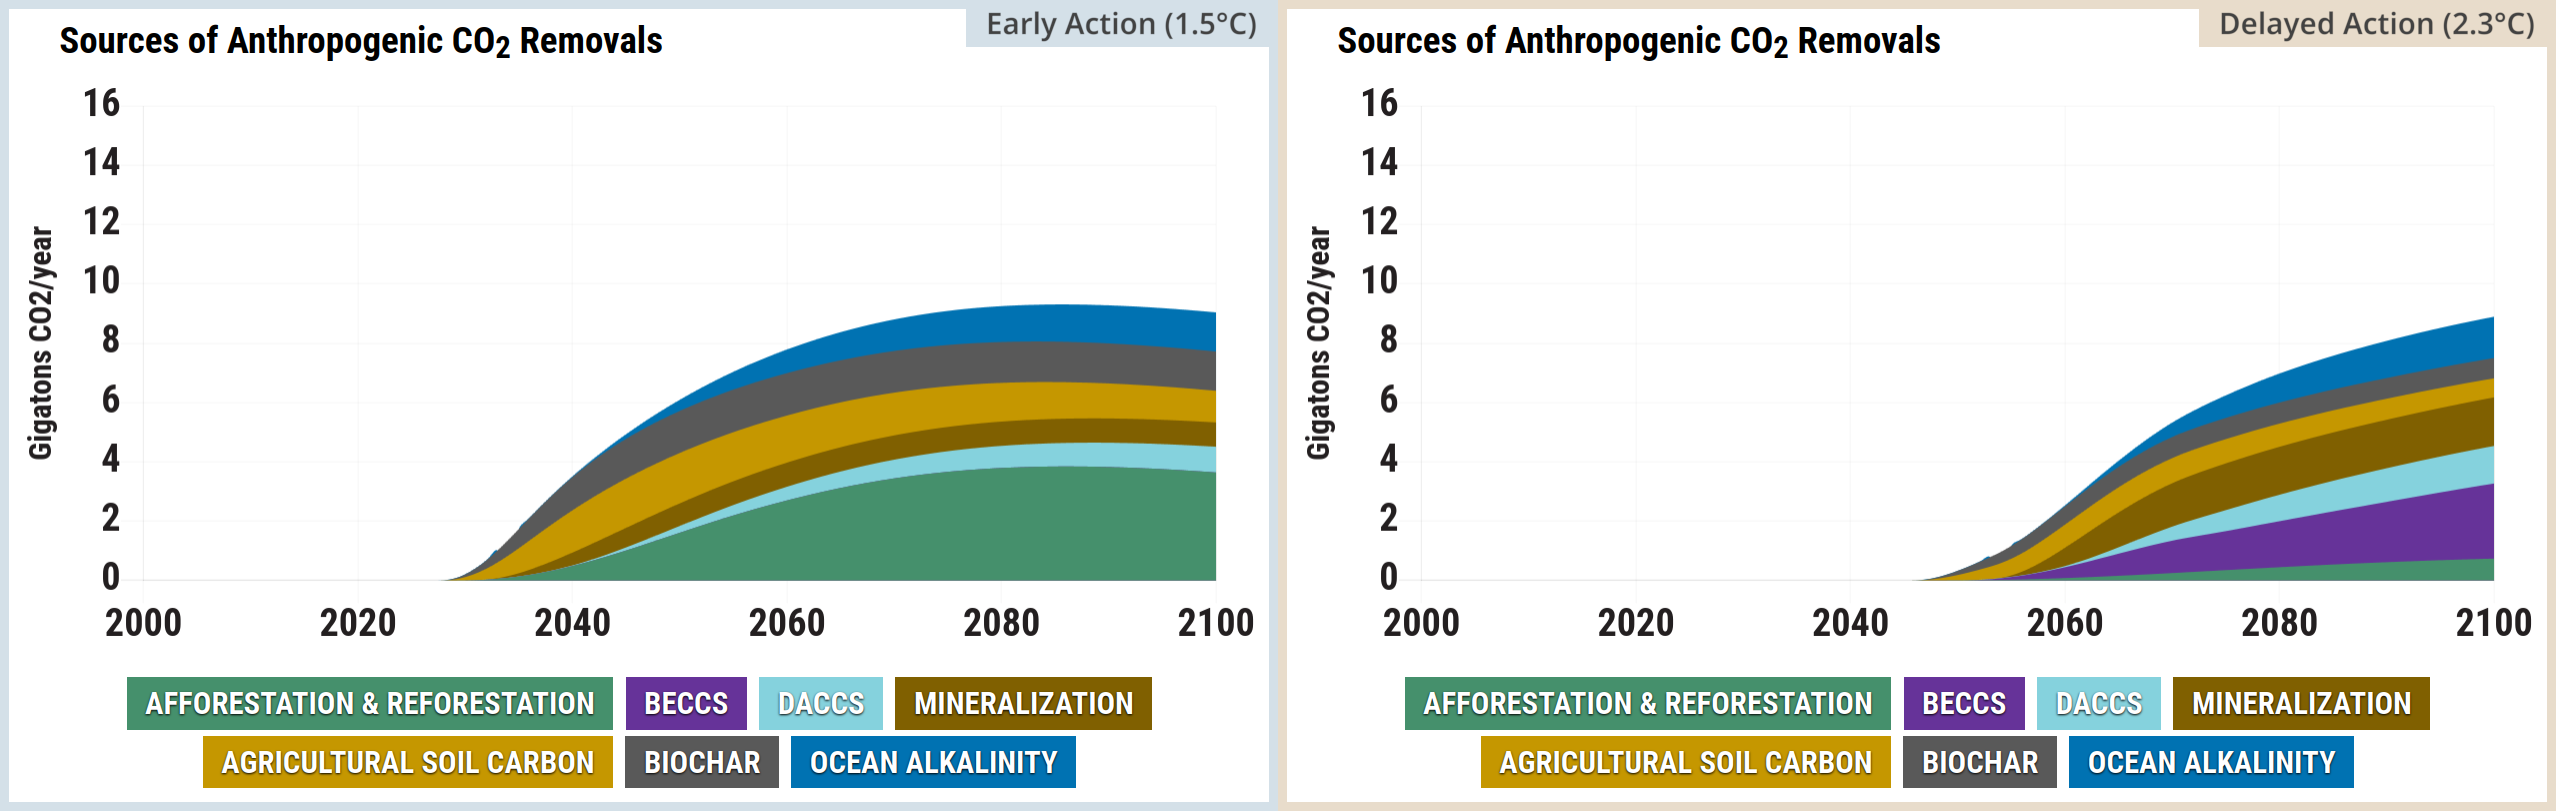
Source: Climate Interactive & MIT Sloan (2026) En-ROADS Simulator (Version 26.8.0)
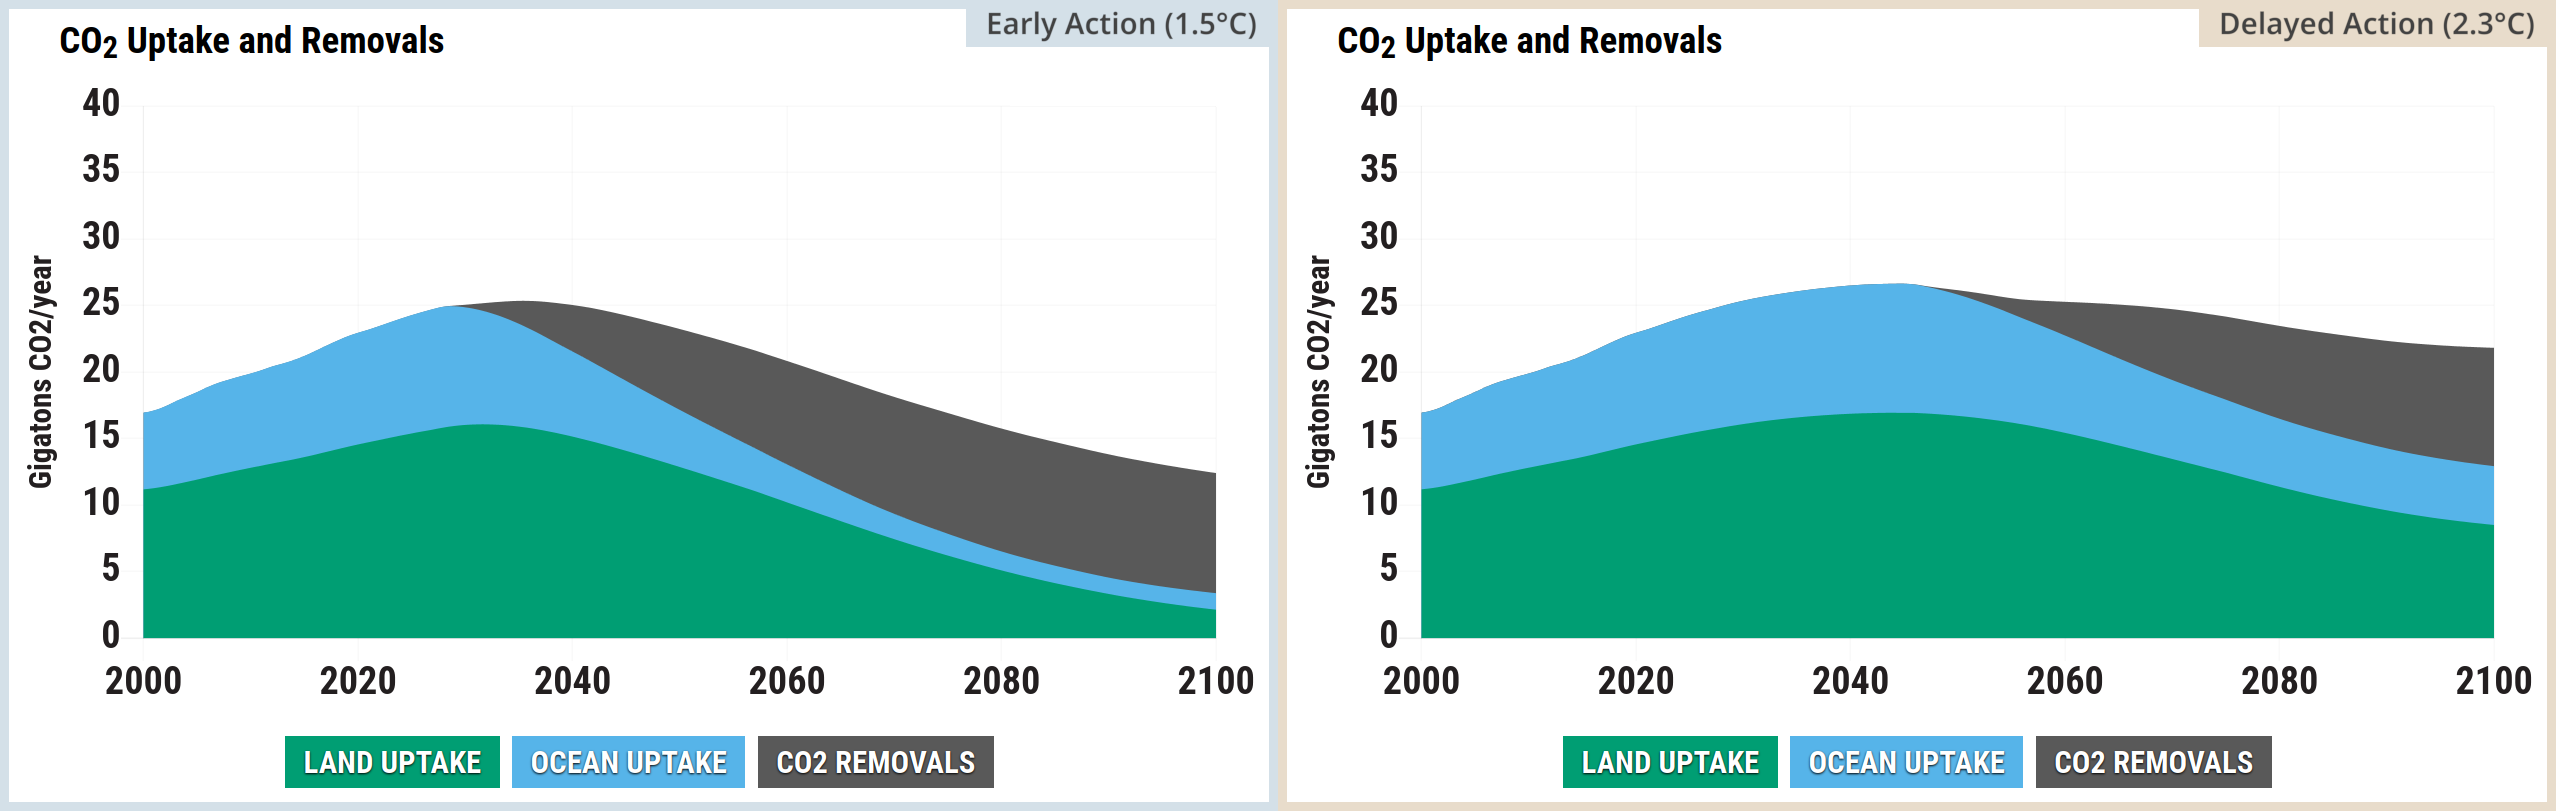
Source: Climate Interactive & MIT Sloan (2026) En-ROADS Simulator (Version 26.8.0)
As stated above, this is an early version of this post:
- The two scenarios haven’t been explained properly yet and the En-ROADS plots in this section haven’t been arranged properly yet
- Some of the plots above won’t remain on the website, but they’re food for thought in the meantime. They were collected together to ensure that they came from the same version of the En-ROADS simulator
IPCC scenarios
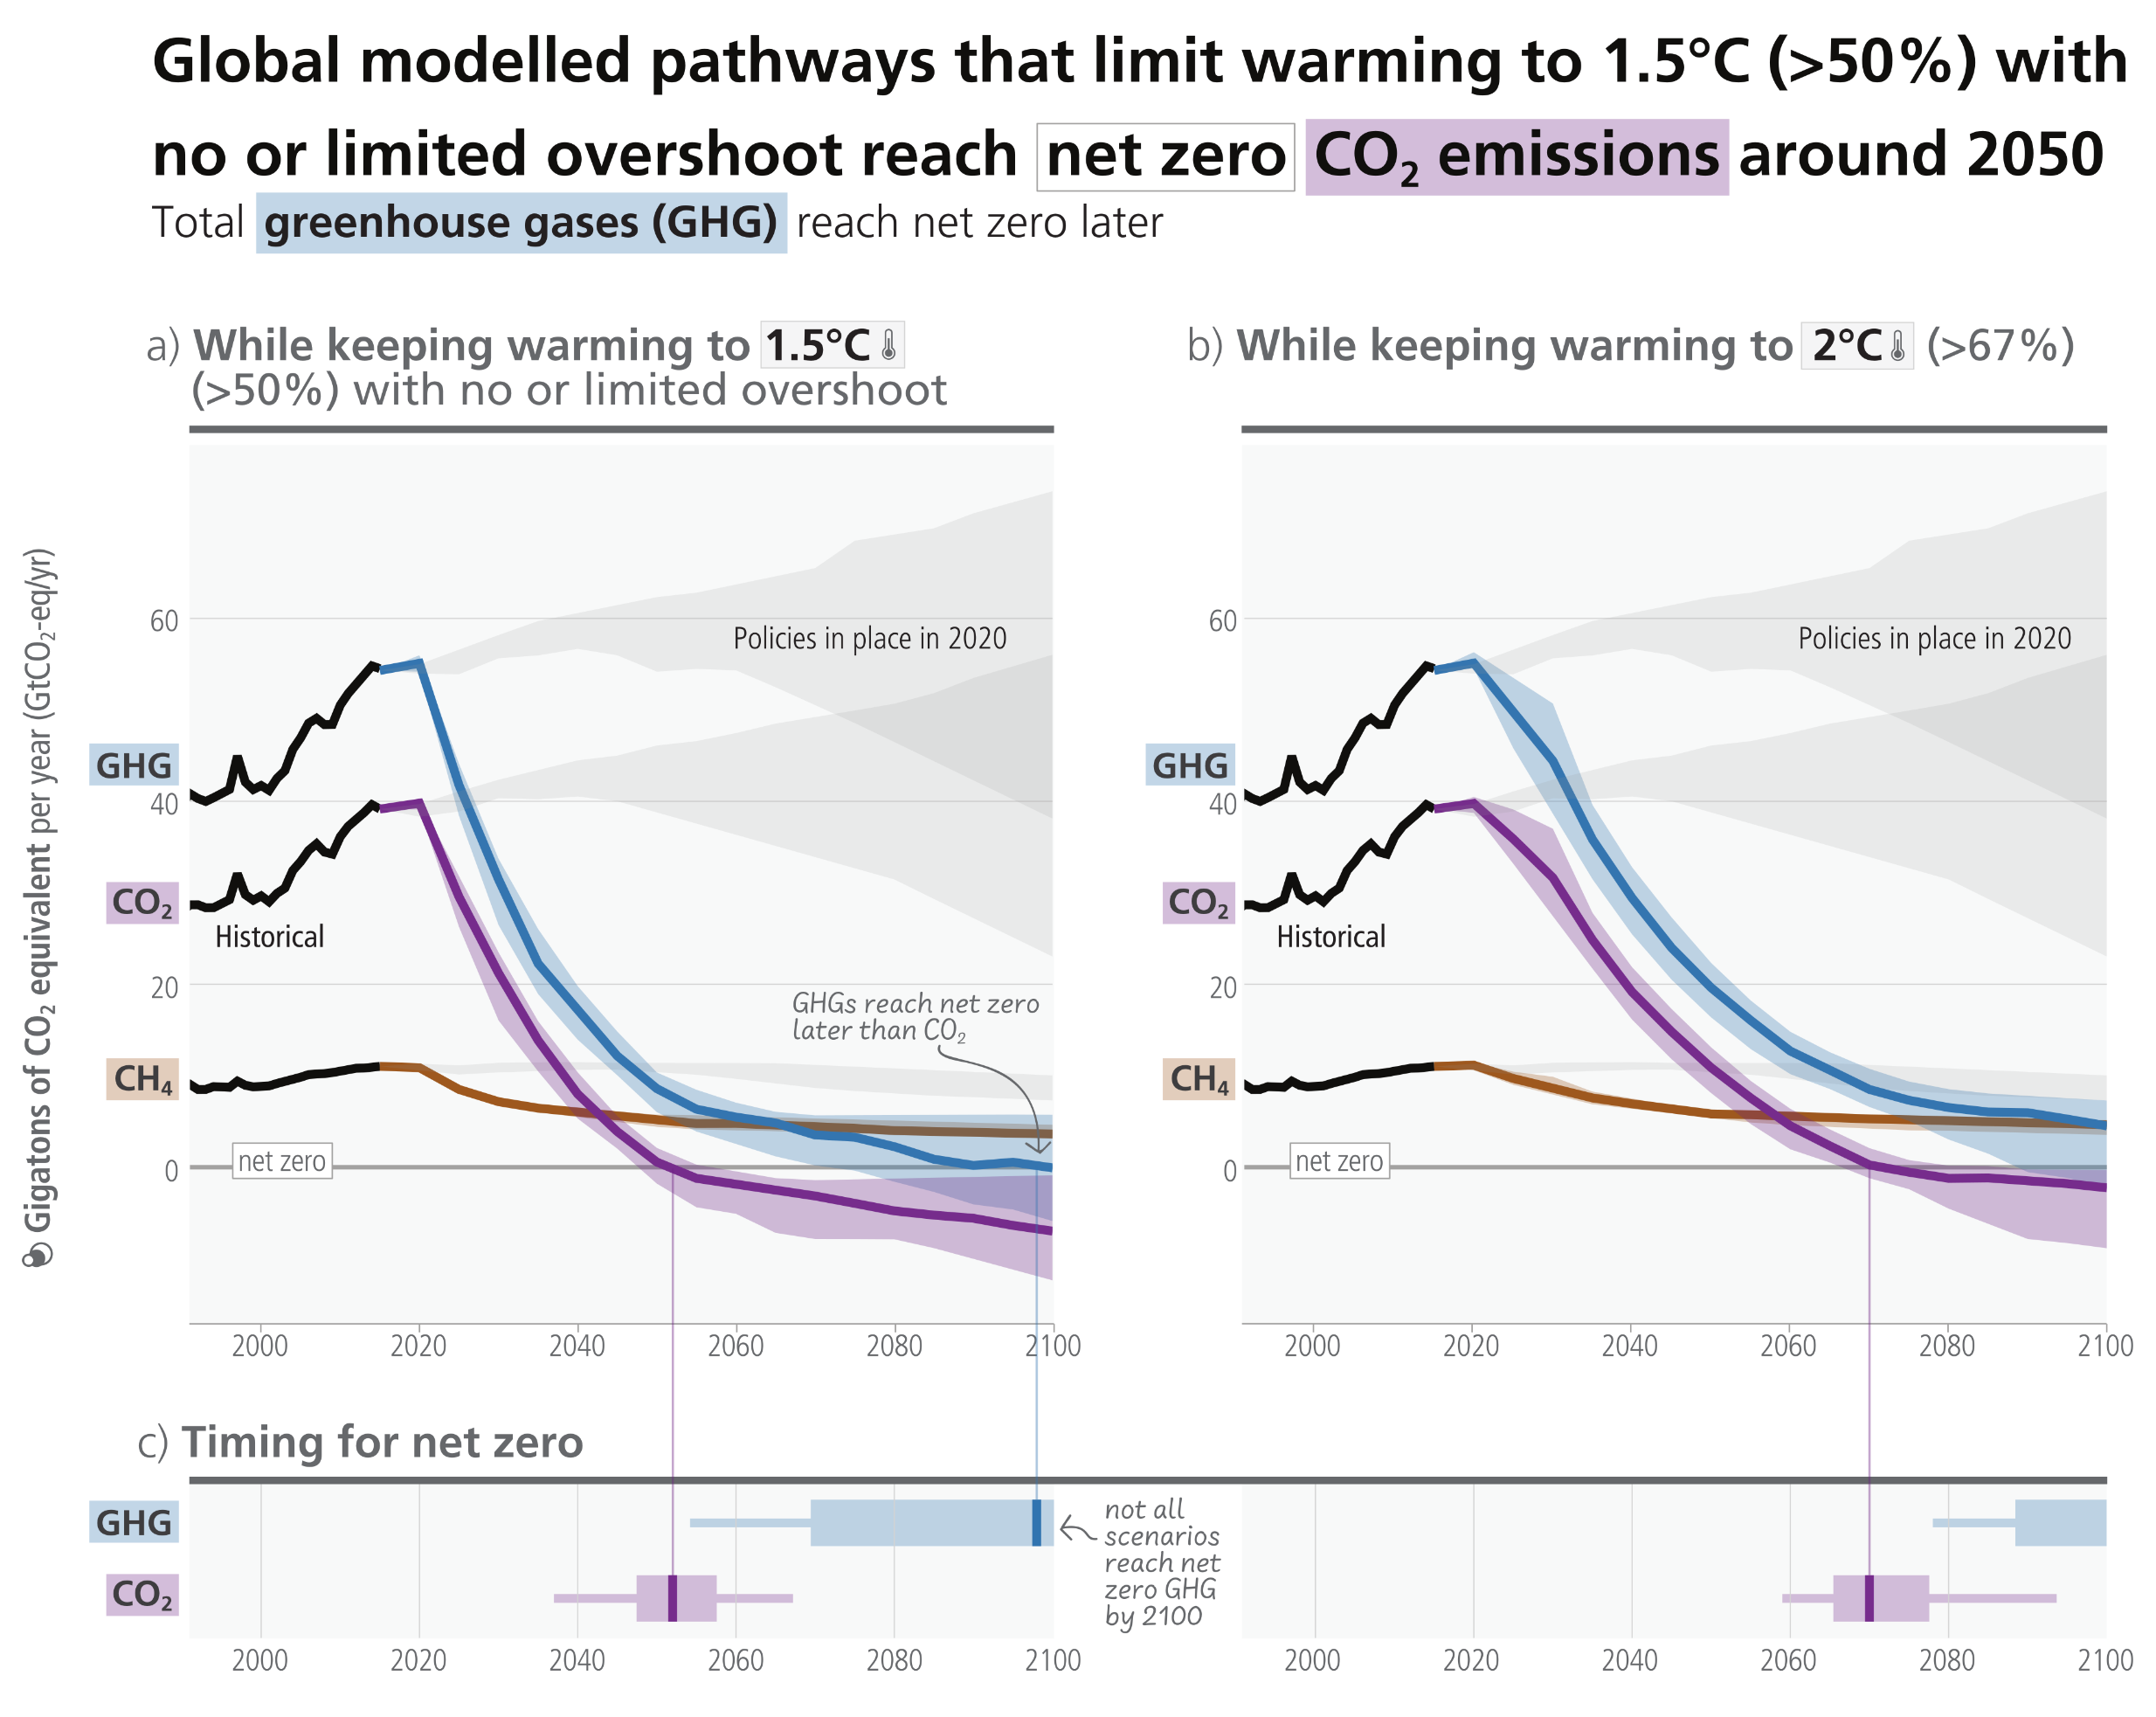

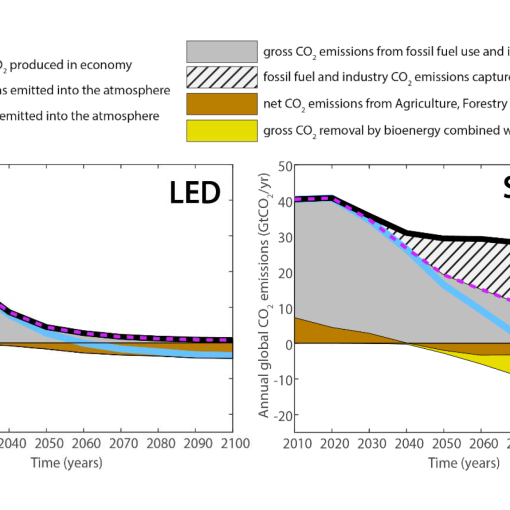
Source: IPCC (2023) AR6 Synthesis Report, Figure 3.6
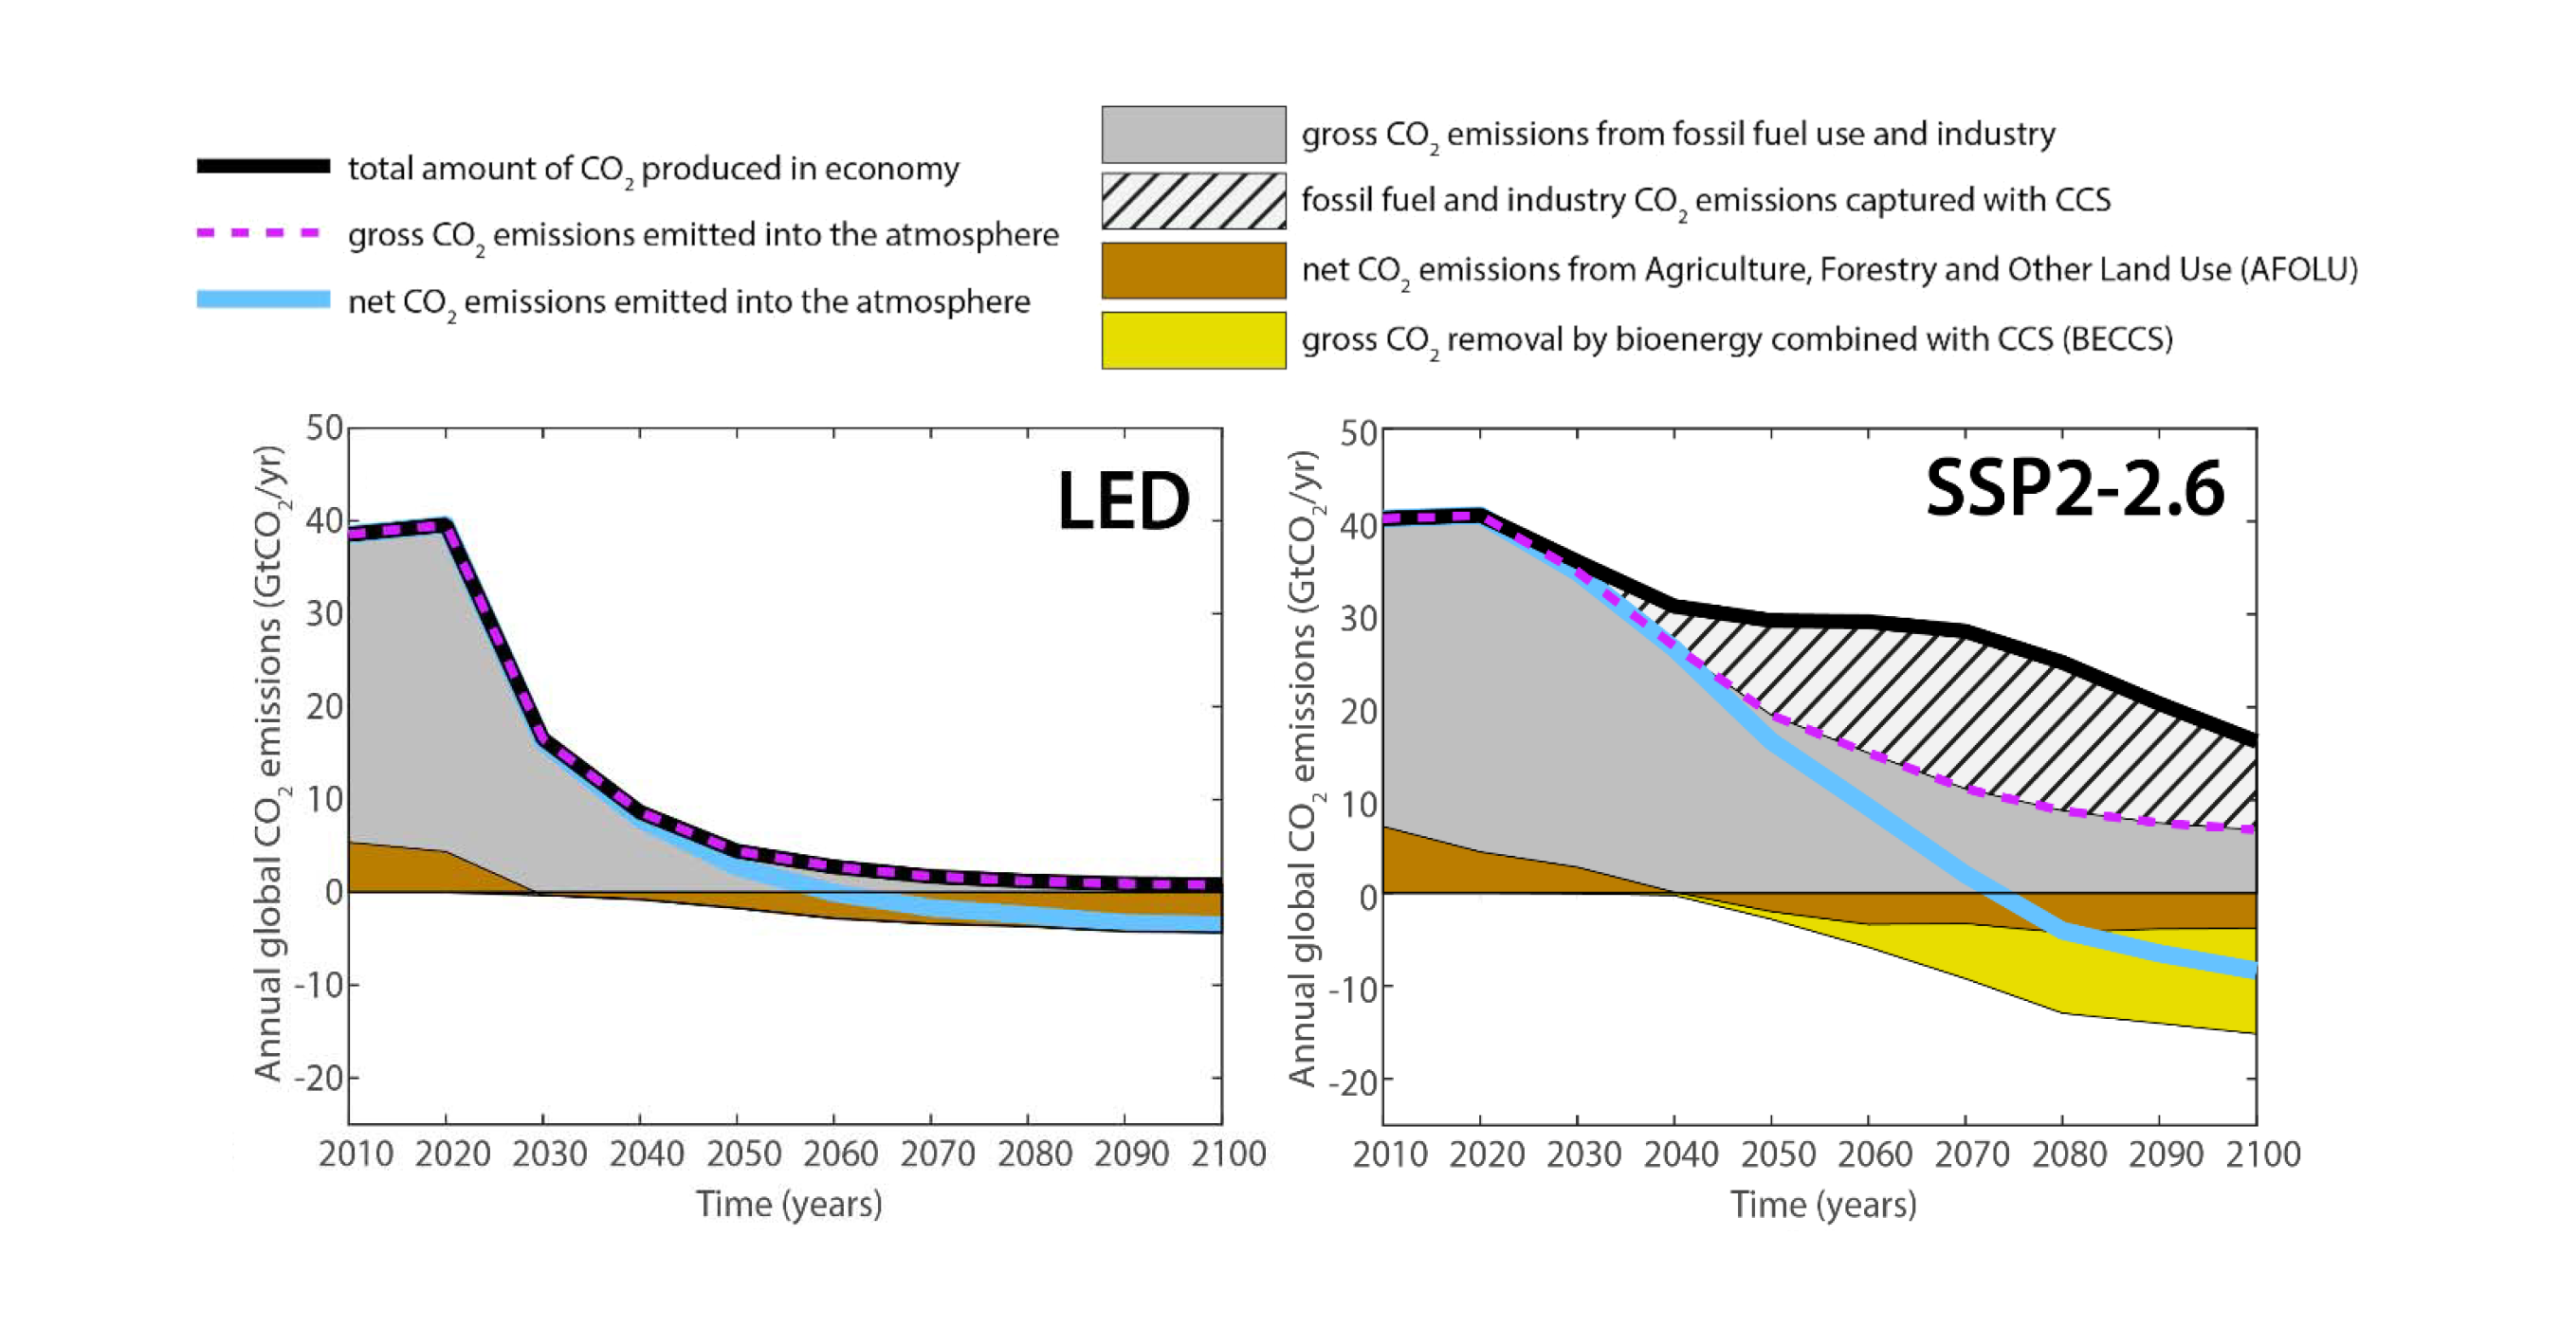
“Global net zero CO2 emissions are reached in the early 2050s in modelled pathways that limit warming to 1.5°C (>50%) with no or limited overshoot, and around the early 2070s in modelled pathways that limit warming to 2°C (>67%). Many of these pathways continue to net negative CO2 emissions after the point of net zero. These pathways also include deep reductions in other GHG emissions. The level of peak warming depends on cumulative CO2 emissions until the time of net zero CO2 and the change in non-CO2 climate forcers by the time of peaking. Deep GHG emissions reductions by 2030 and 2040, particularly reductions of methane emissions, lower peak warming, reduce the likelihood of overshooting warming limits and lead to less reliance on net negative CO2 emissions that reverse warming in the latter half of the century. Reaching and sustaining global net zero GHG emissions results in a gradual decline in warming. (high confidence)”
Source: IPCC (2022) AR6 WGIII Summary for Policymakers, C.2, pg. 23
Global emissions scenarios to 2100
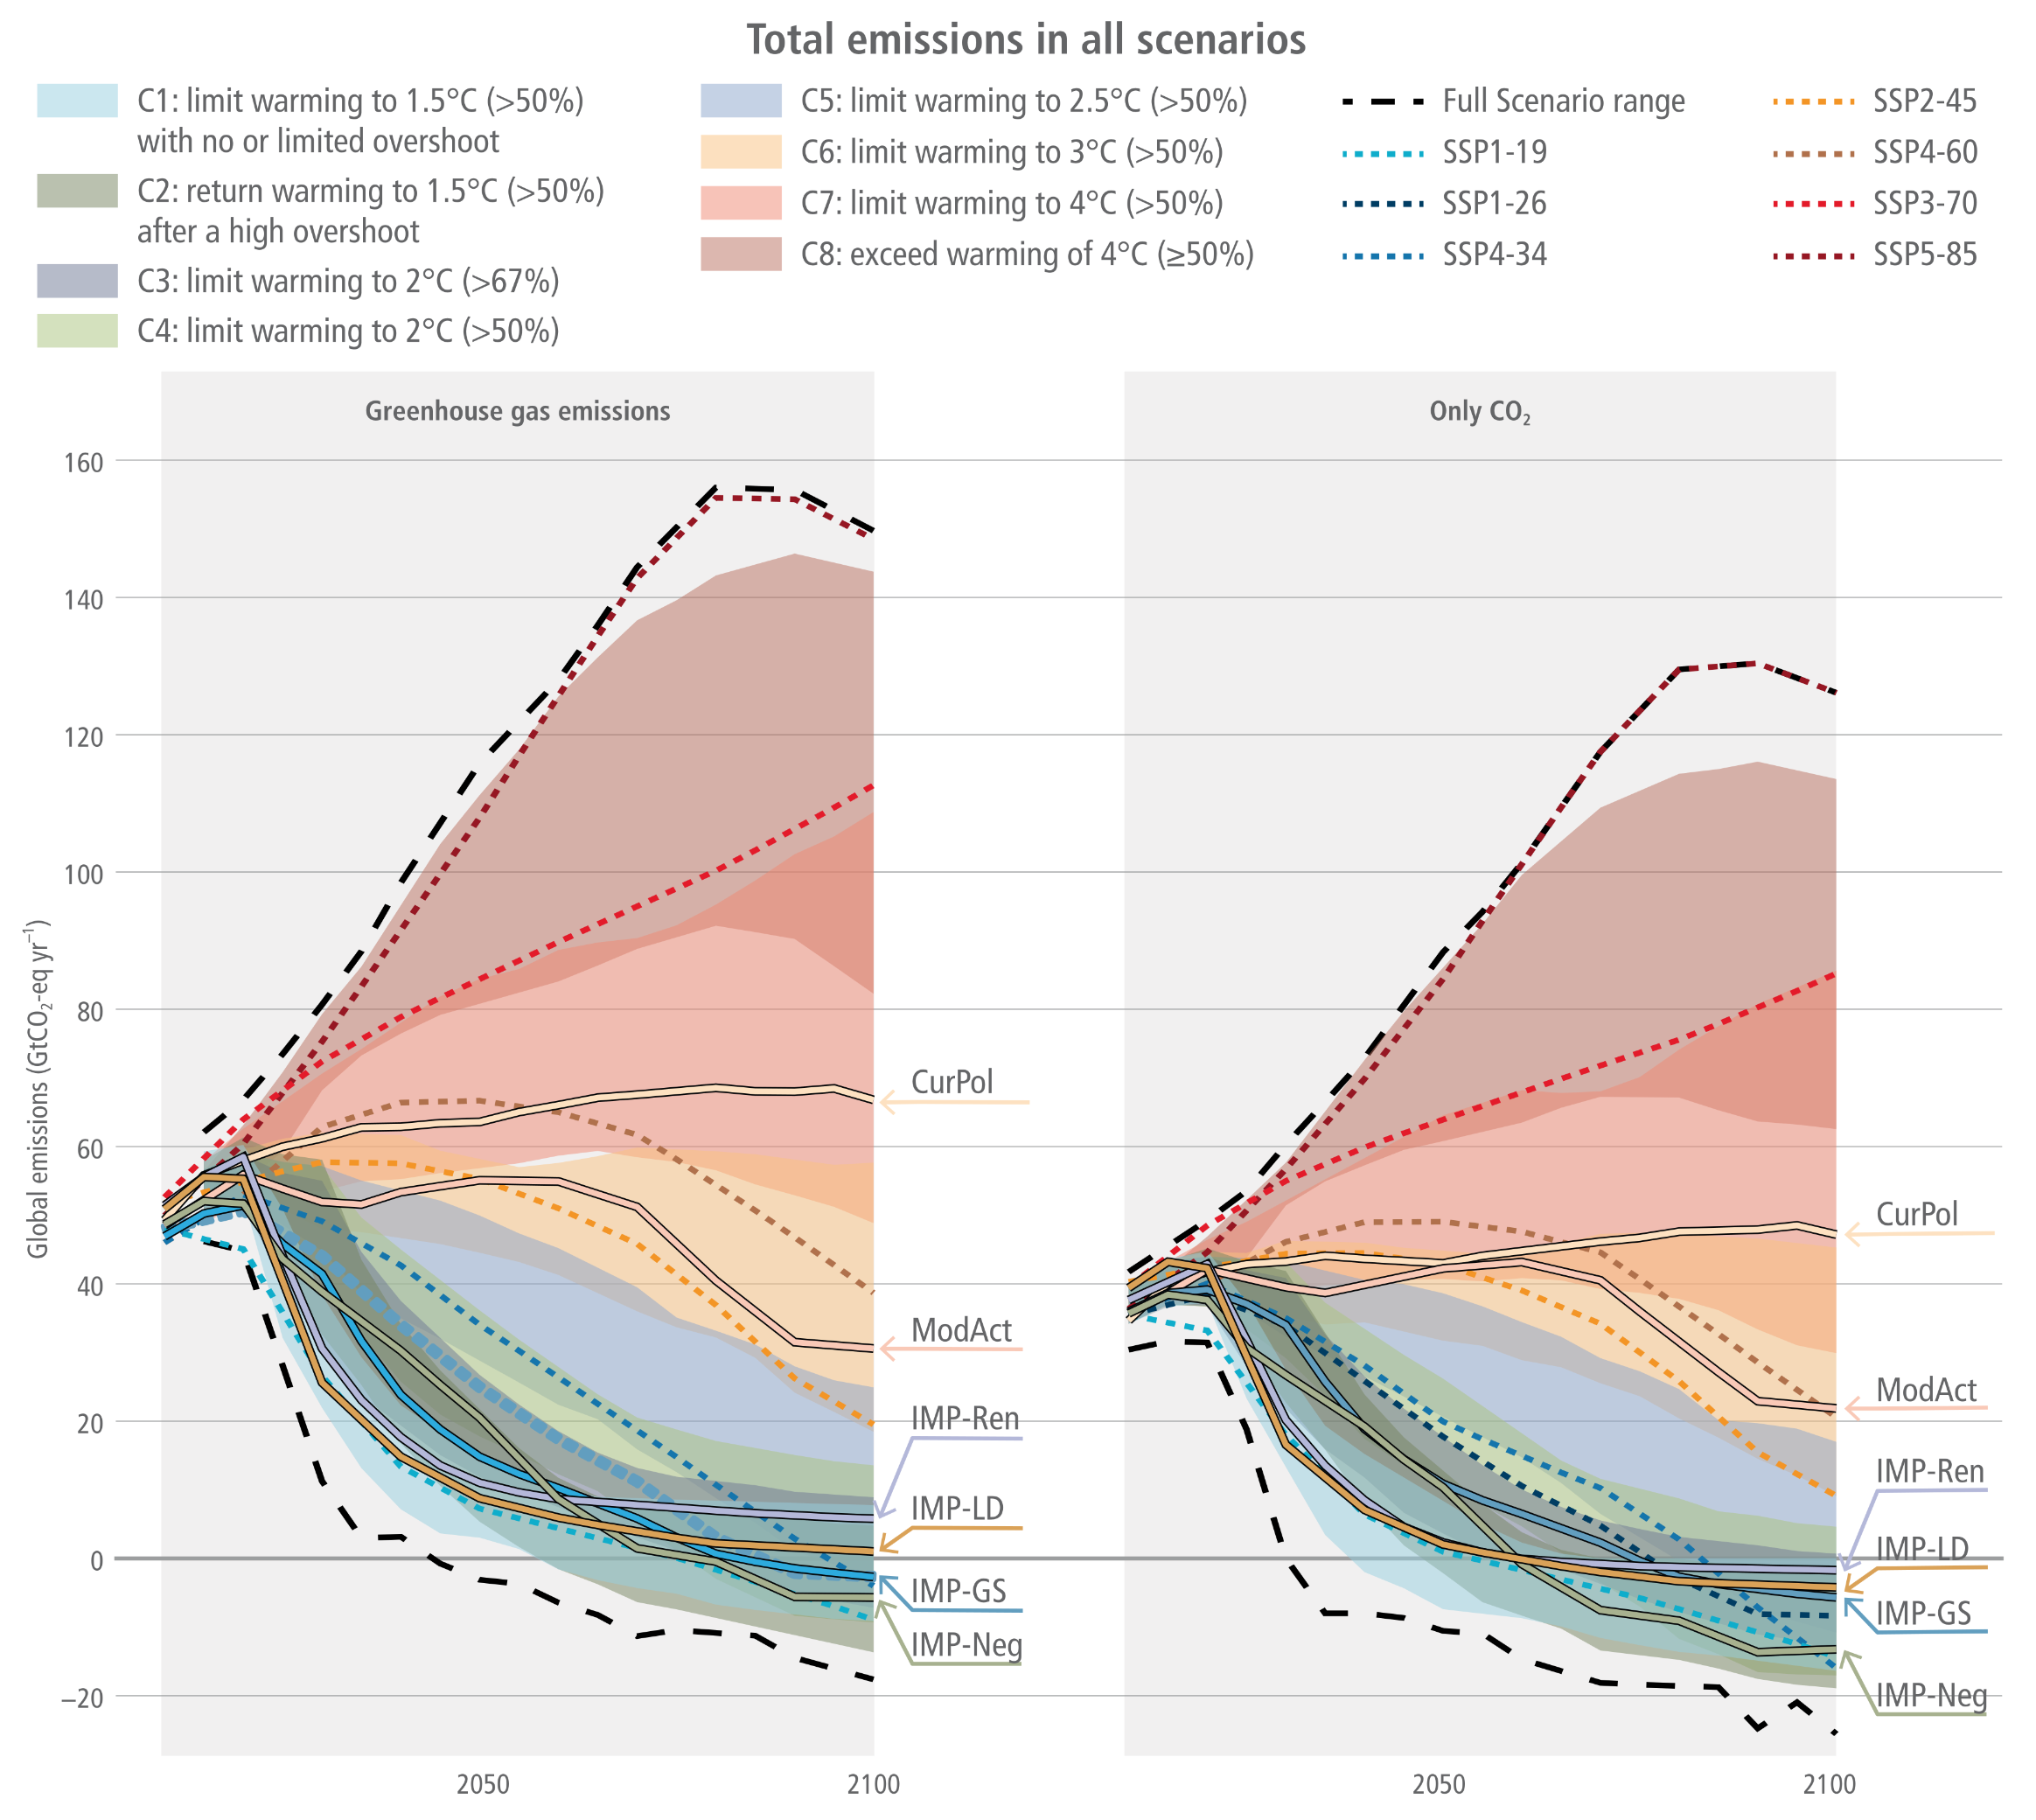

Source: IPCC (2022) WGIII Chapter 3, Figure 3.10, pg. 315
CO2 concentrations for SSPs
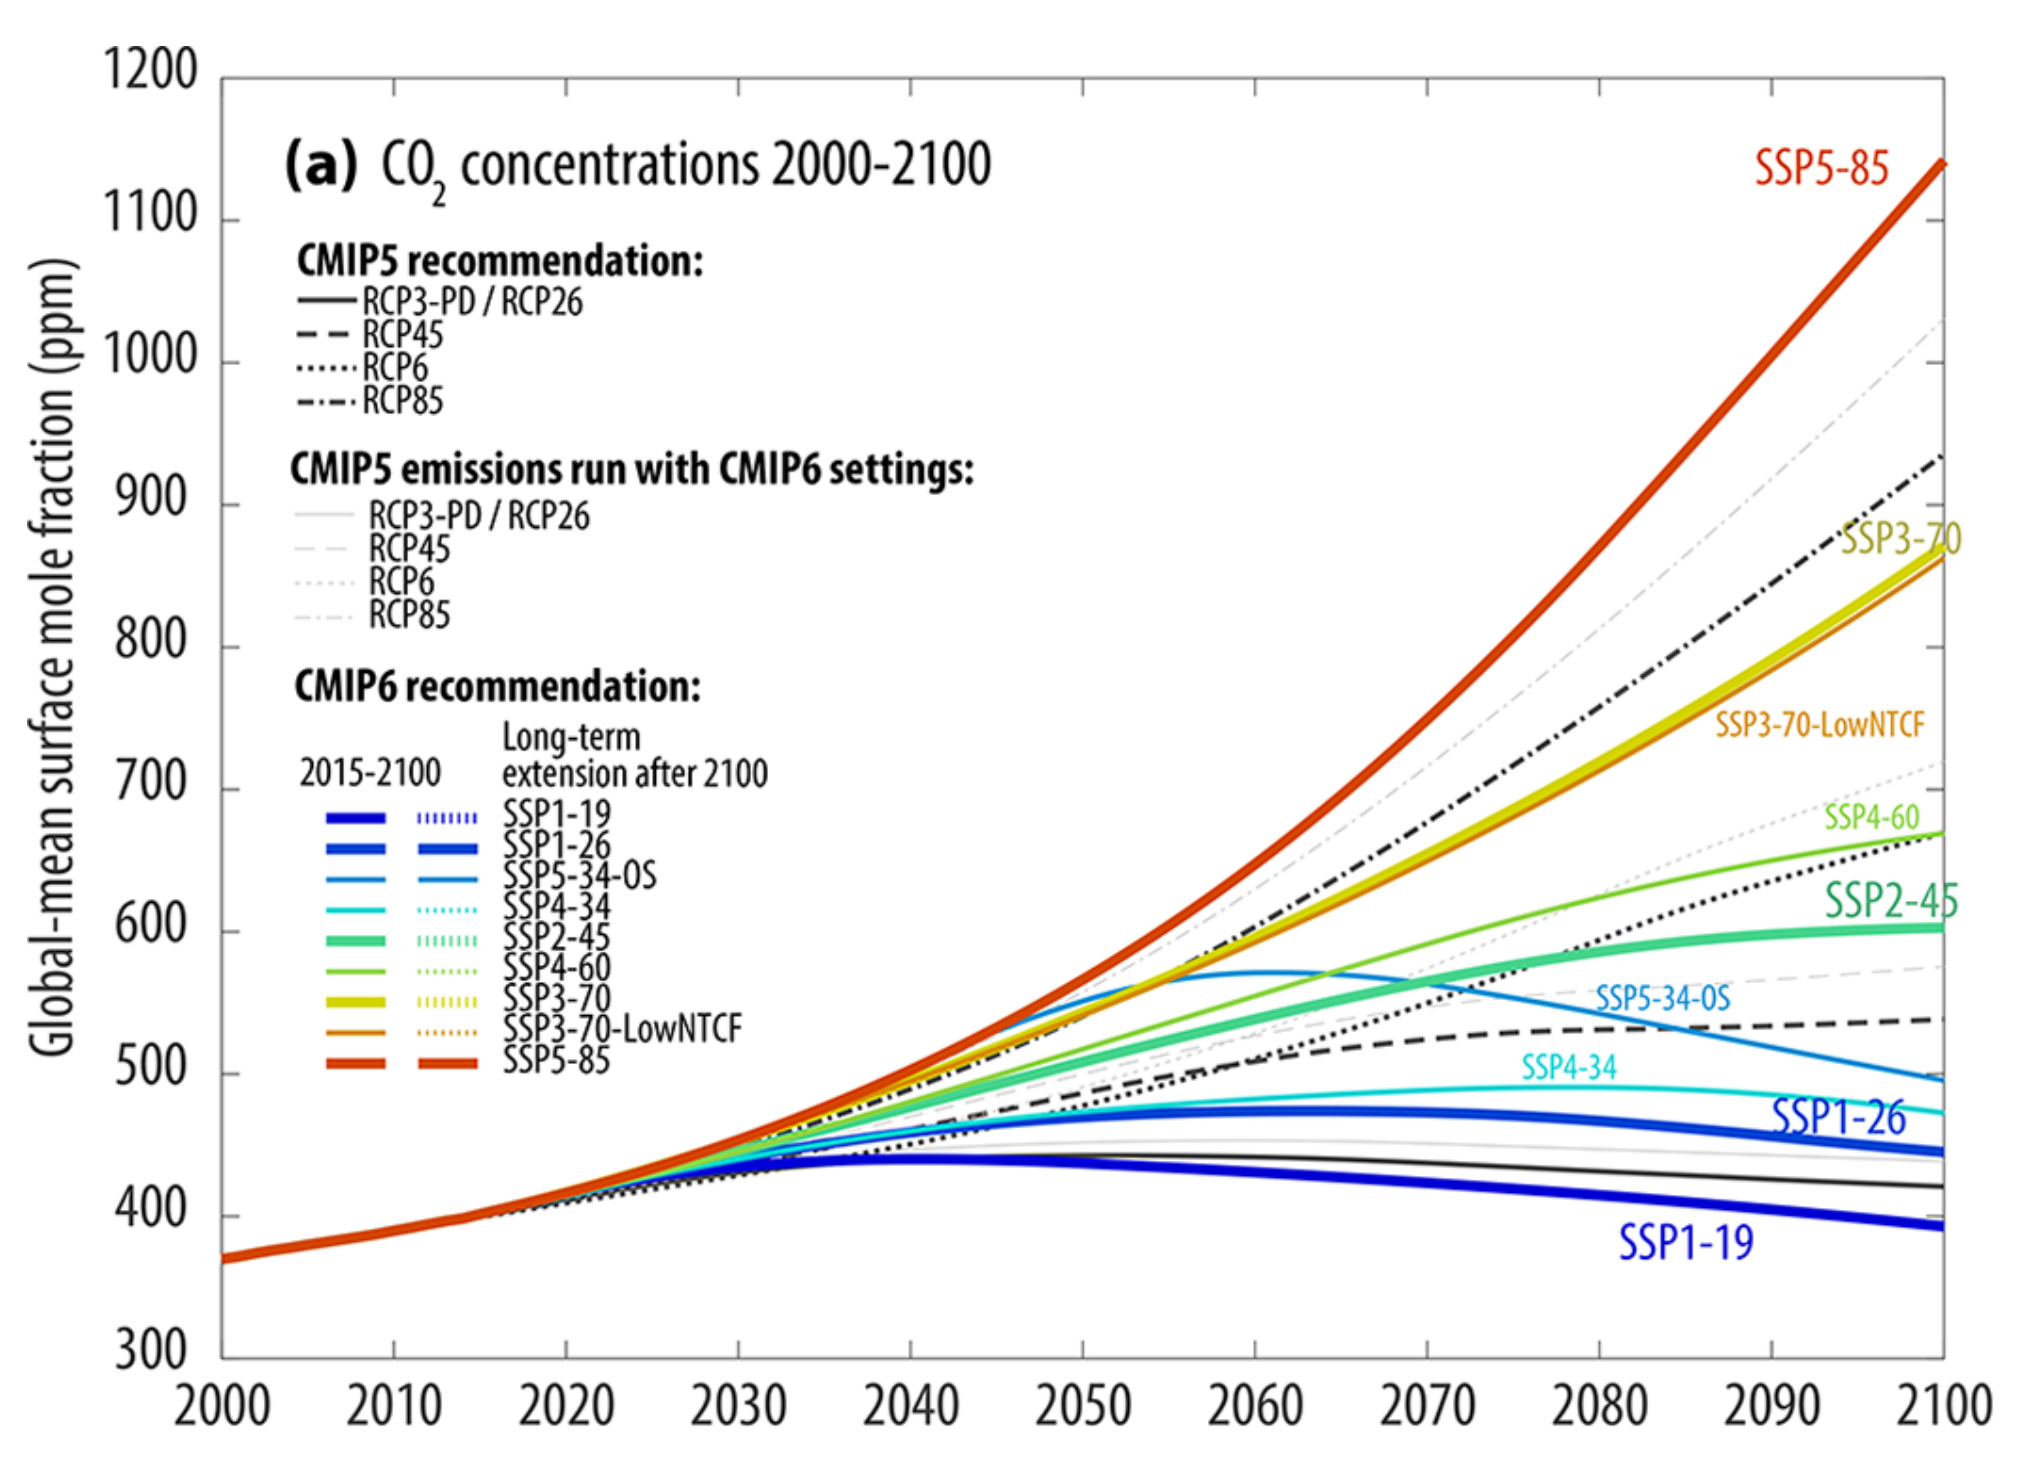
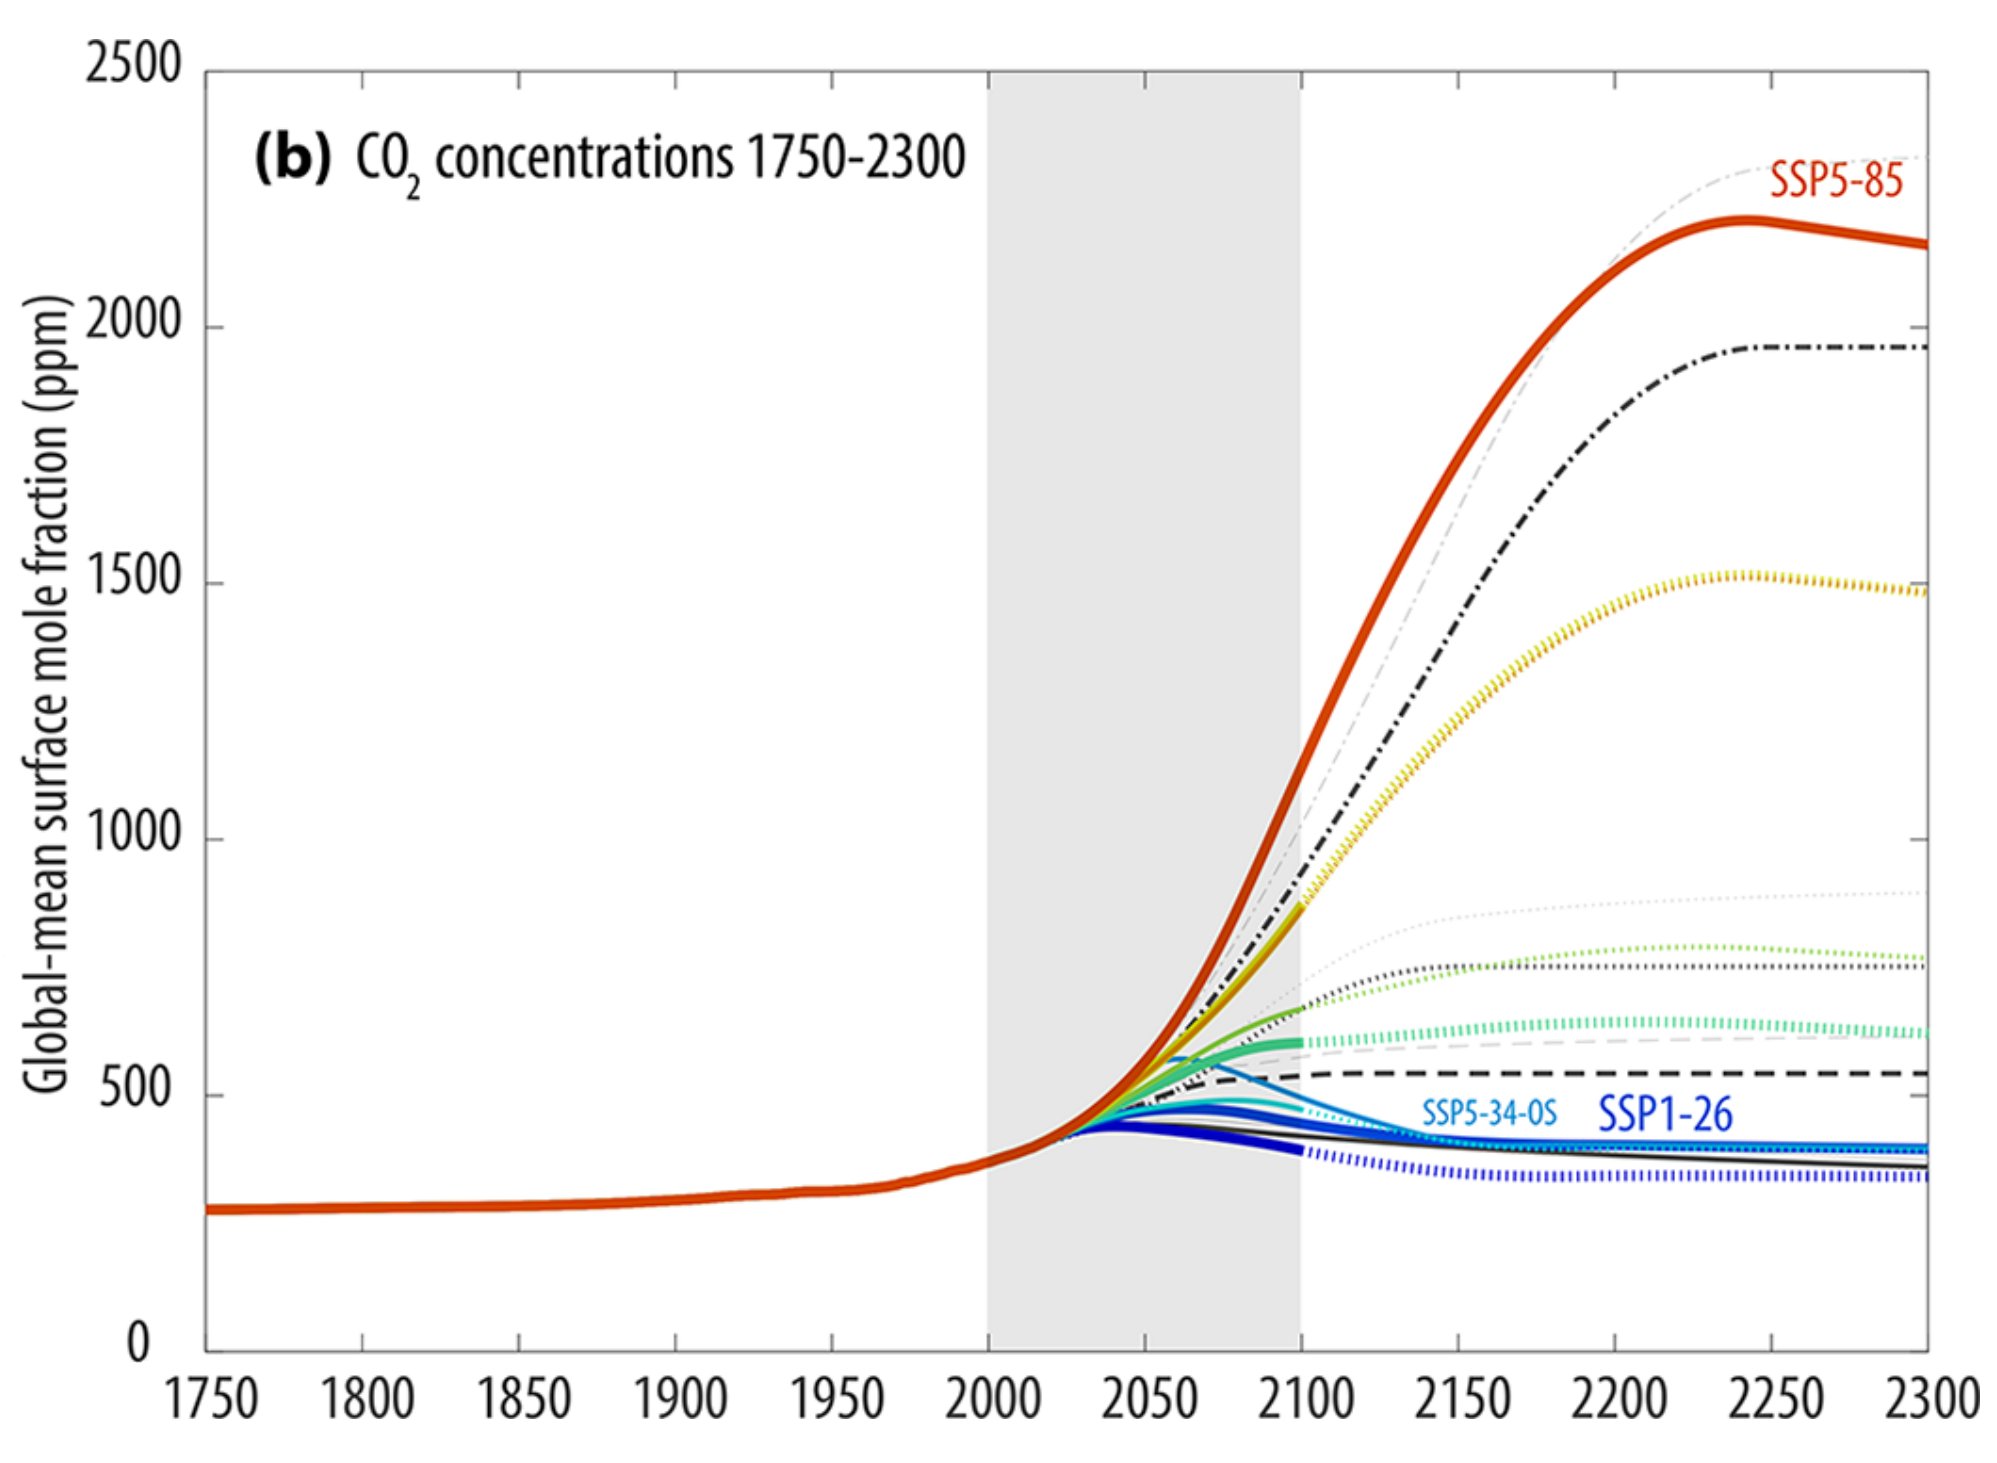

Source: Meinshausen et al. (2020) Figure 11 (modified to show CO2 only)
Global warming scenarios to 2100
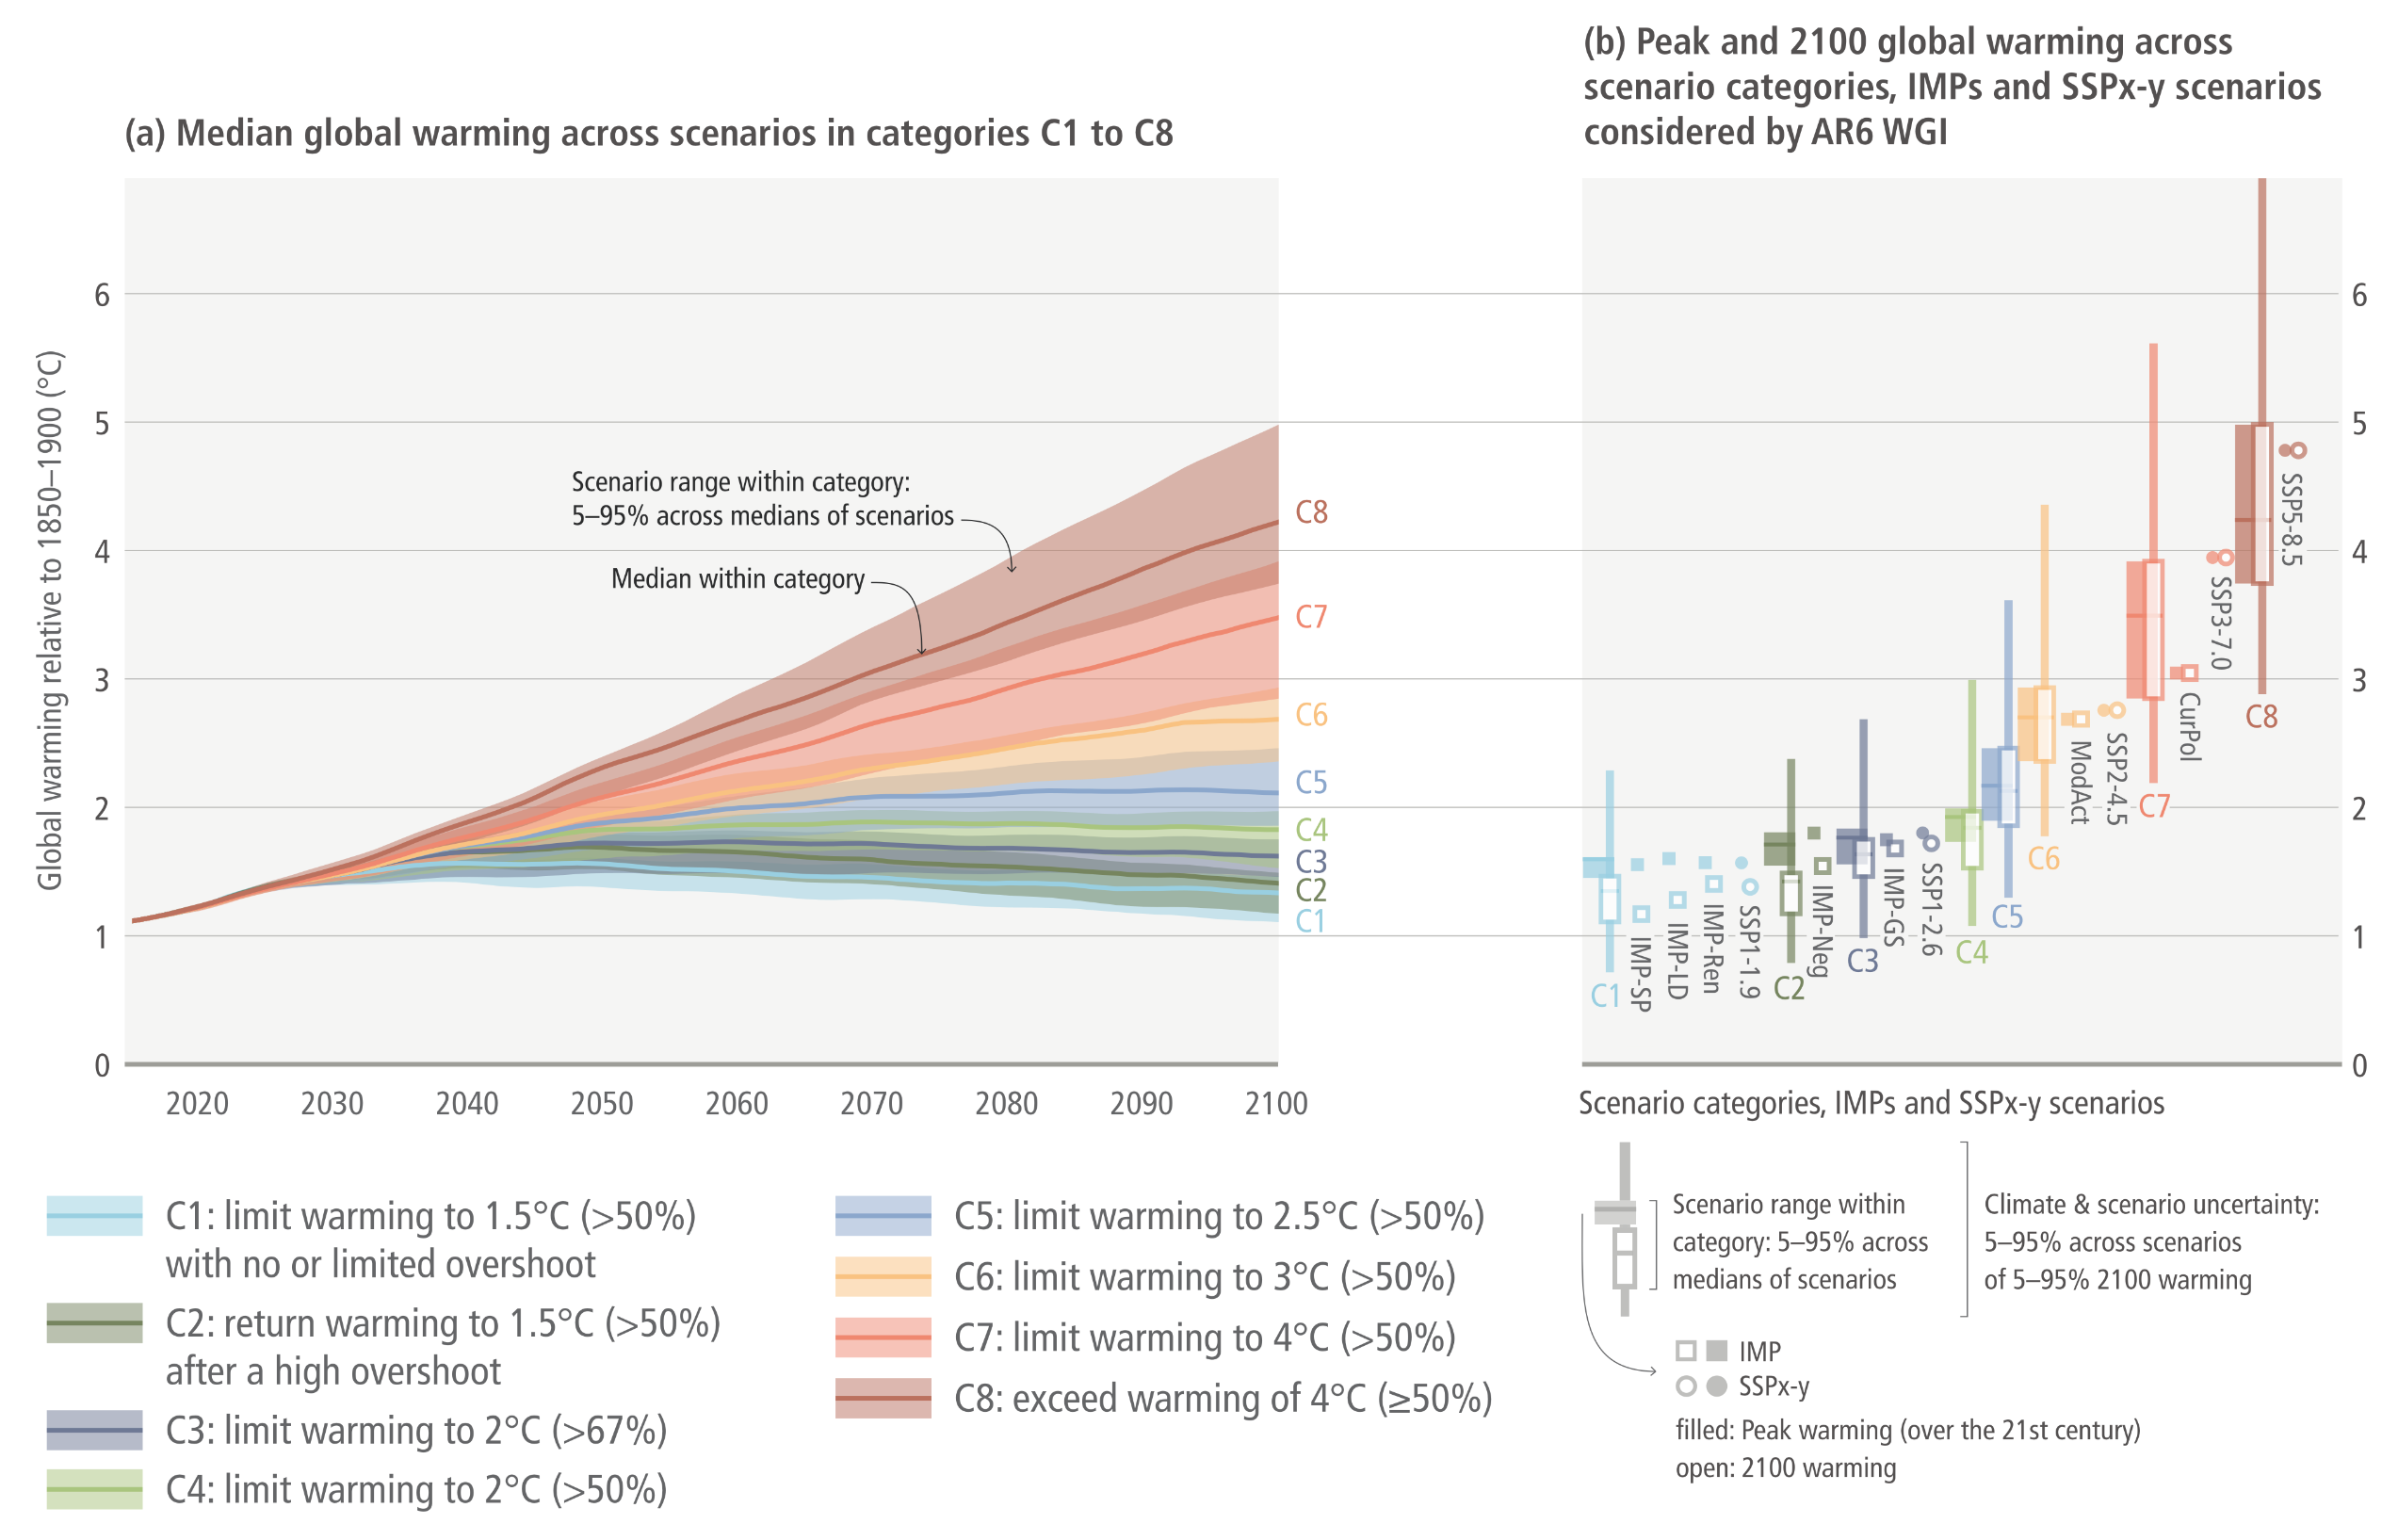

Source: IPCC (2022) AR6 WGIII Chapter 3, Figure 3.11, pg. 317
Simulated temperature change up to 2300 under the extended SSP scenarios
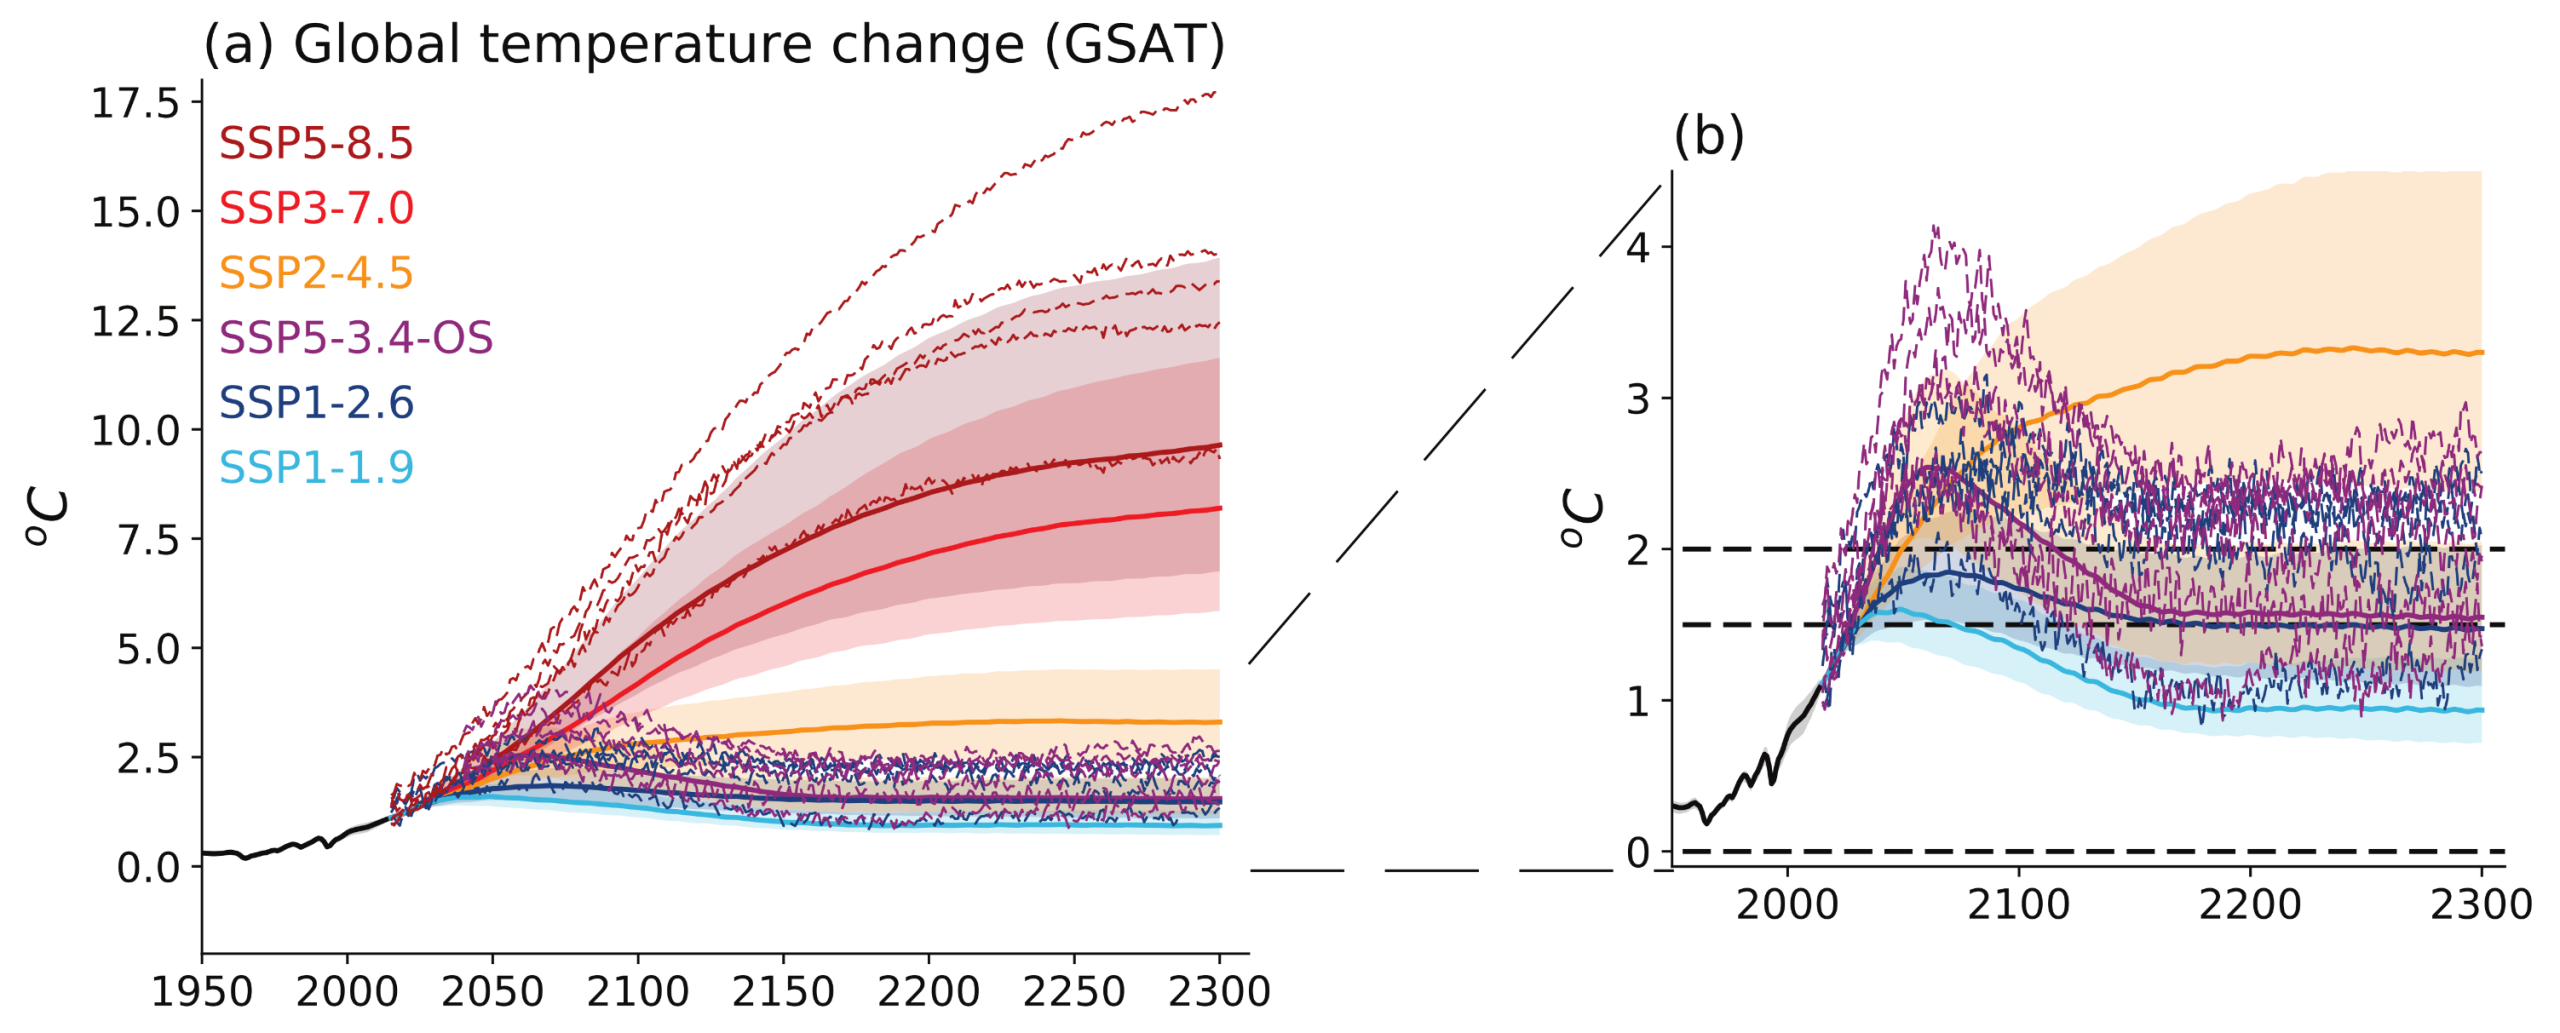

Source: IPCC (2021) AR6 WGI Chapter 4, Figure 4.40, pg. 632

Sources for this post:
- Climate Interactive & MIT Sloan (2026) En-ROADS Simulator (Version 26.8.0)
- IPCC (2021) AR6 WGI, Summary for Policymakers
- IPCC (2021) AR6 WGI, Chapter 4, Future Global Climate: Scenario-based Projections and Near-term Information
- IPCC (2022) AR6 WGIII, Chapter 3, Mitigation pathways compatible with long-term goals
- IPCC (2022) AR6 WGIII, Annex 1, Glossary, pg. 1809 (PDF)
- IPCC (2023) AR6 Synthesis Report, Section 3, Long-Term Climate and Development Futures
- Meinshausen et al (2020) The shared socio-economic pathway (SSP) greenhouse gas concentrations and their extensions to 2500
- UN (2015) Paris Agreement (PDF)