Historical GHG emissions

1 post

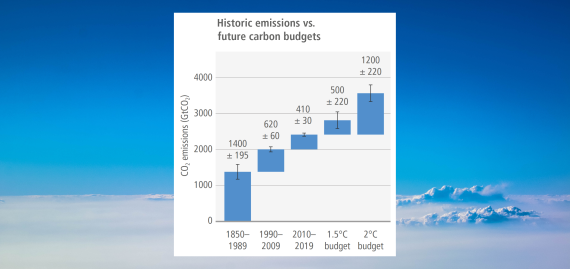
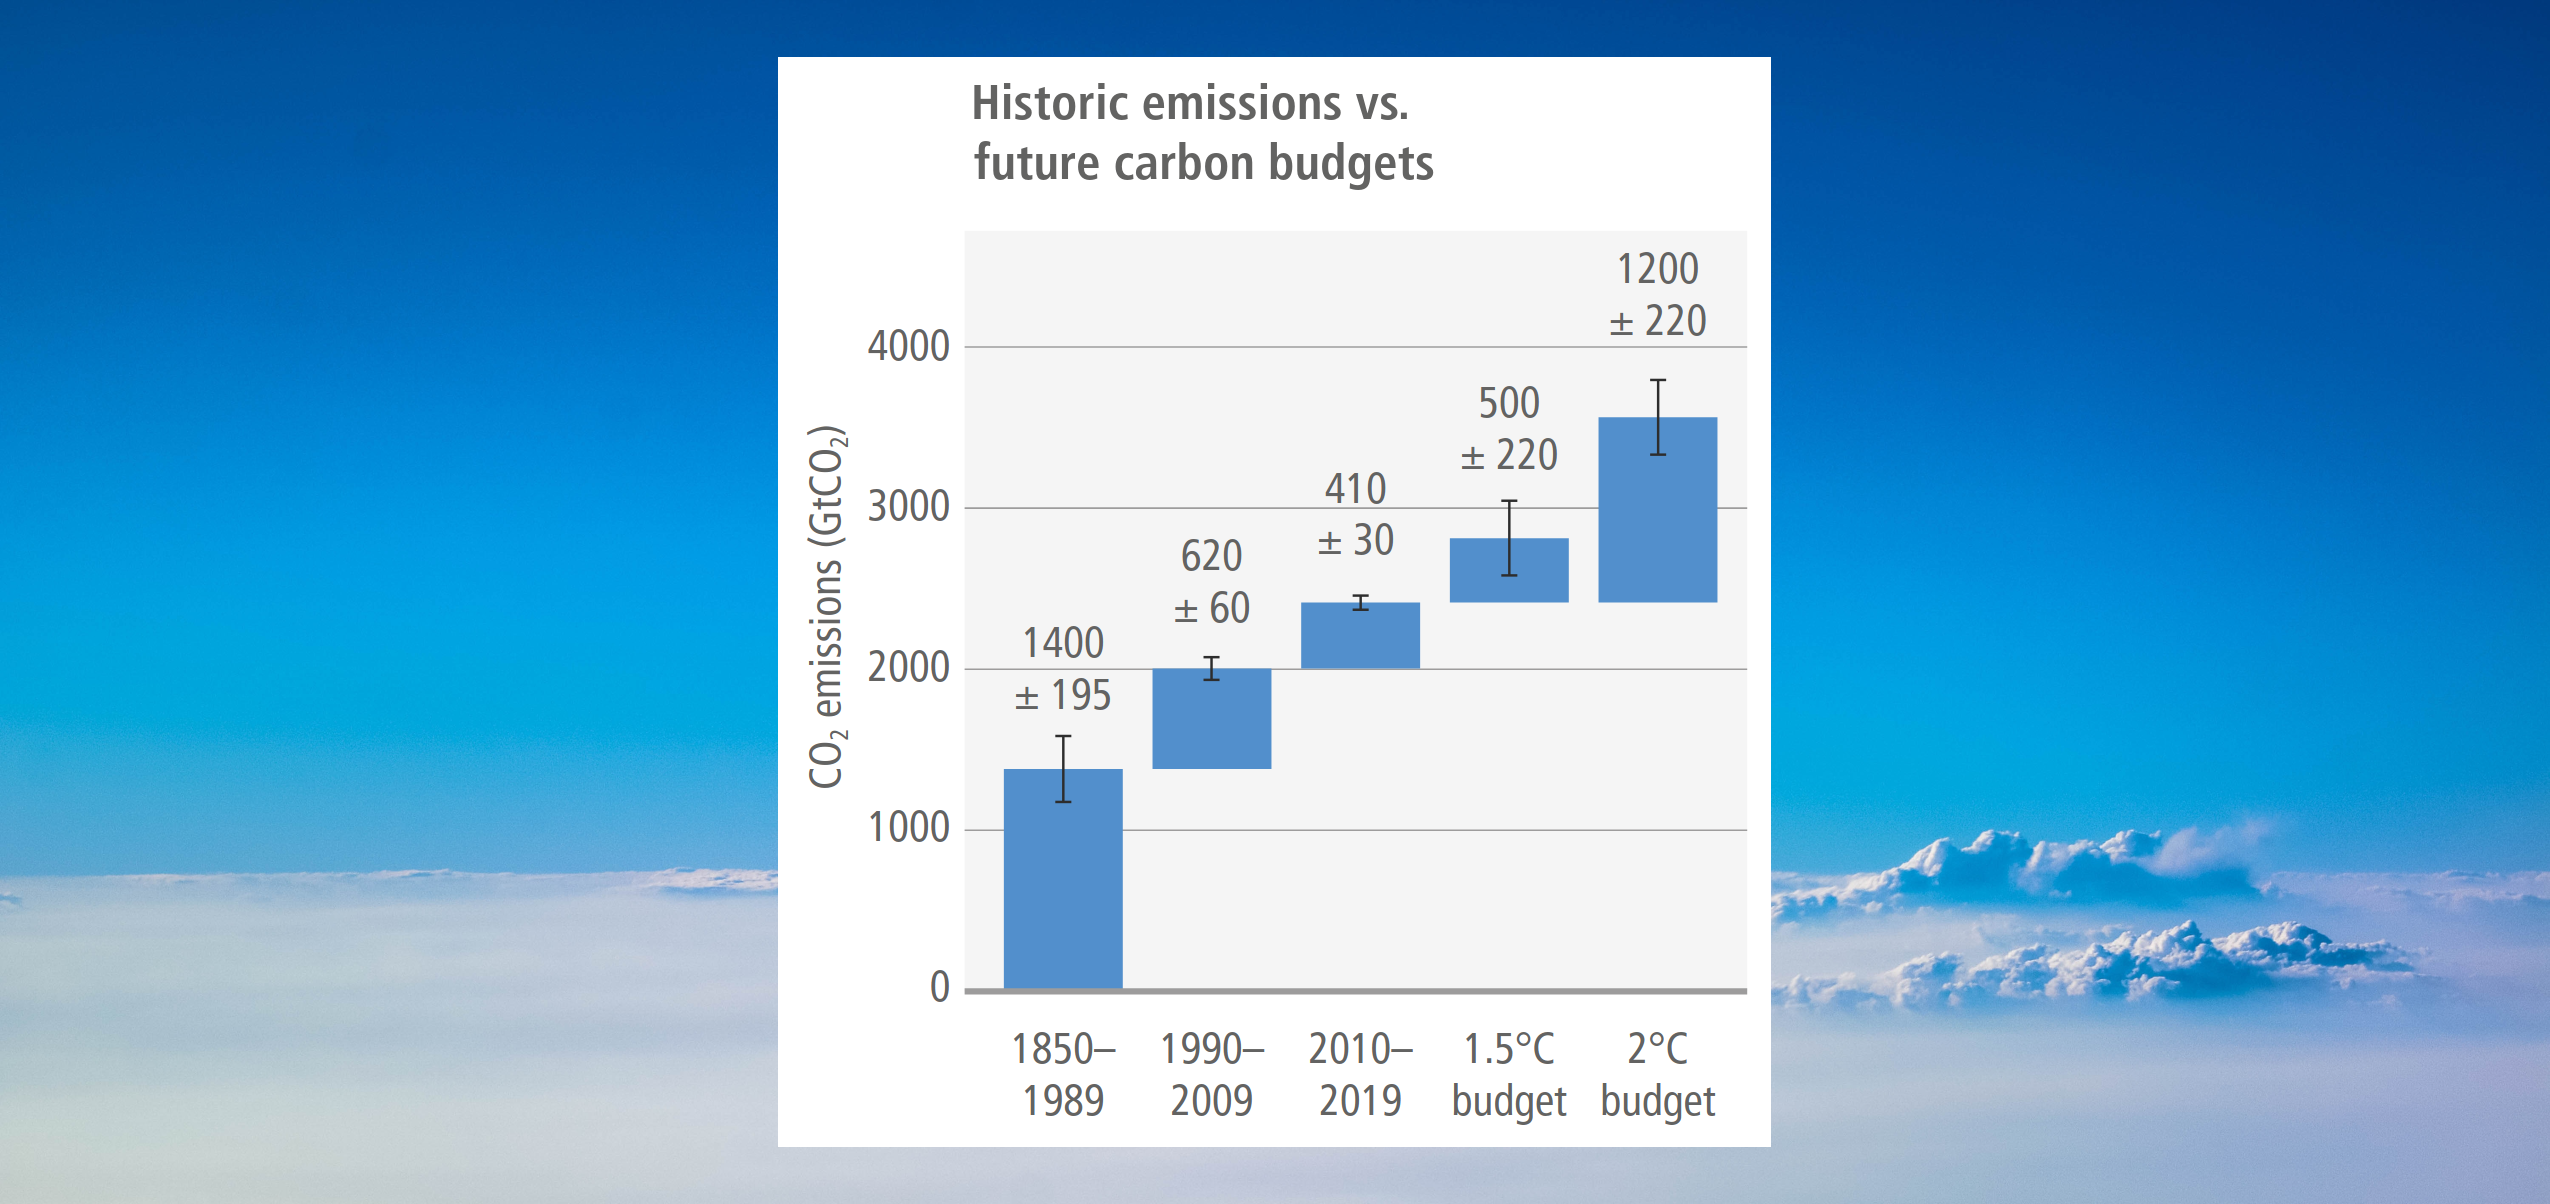
A floating step bar chart set against a photographic background of a bright blue sky and white clouds, comparing historic carbon dioxide emissions against future carbon budgets. The vertical axis measures CO2 emissions in gigatonnes, scaling from 0 to 4000 in increments of 1000. The chart uses blue rectangular blocks to stack cumulative emissions over time, with black vertical whiskers on each block indicating uncertainty ranges. The historical sequence begins with a block for 1850 to 1989 adding 1400 plus or minus 195 gigatonnes. Floating directly above this, the 1990 to 2009 block adds 620 plus or minus 60 gigatonnes. Floating above that, the 2010 to 2019 block adds 410 plus or minus 30 gigatonnes. This creates a cumulative historical baseline of 2430 gigatonnes by the end of 2019. From this identical 2019 baseline level, two alternative future budget blocks are plotted side-by-side. The 1.5 degrees Celsius budget block adds 500 plus or minus 220 gigatonnes. Next to it, the 2 degrees Celsius budget block adds 1200 plus or minus 220 gigatonnes. Visually, the chart emphasises that the remaining budget for 1.5 degrees Celsius is exceptionally small, representing less than the emissions produced in just the single 1990 to 2009 historical time block.

Carbon budgets

“Cumulative net CO2 emissions over the last decade (2010–2019) are about the same size as the remaining carbon budget to limit warming to 1.5°C (>67%) (medium confidence). 62% of total cumulative CO2 emissions from 1850 to 2019 occurred since 1970 (1500 ± 140 GtCO2), about 43% since 1990 (1000 ± 90 GtCO2), and about 17% since 2010 (410 ± 30 GtCO2). For comparison, the remaining carbon budget for keeping warming to 1.5°C with a 67% (50%) probability is about 400 (500) ± 220 GtCO2” [IPCC (2022) AR6 WGIII Technical Summary, pg. 61]